
A lockup expiration is one of the most widely disclosed, extensively studied, and consistently misunderstood events in financial markets. Every IPO produces one. Regulatory filings announce the date months in advance. Academic research spanning four decades quantifies the average price impact with unusual precision. And yet, coverage of these events routinely treats a change in legal selling eligibility as if it were a guaranteed market crash, denominated in billions.
The consequences of that framing gap are not abstract. If you have ever read a headline warning that $100 billion in shares are about to “flood the market” and adjusted your position accordingly, you responded to a number that was mathematically unstable, behaviourally unfounded, and analytically misleading. That does not make lockup expirations irrelevant. It means the standard coverage gives you the wrong tools for evaluating them.
Here is what you need instead: the mechanical reality of what a lockup expiration does, what the empirical evidence actually says about price impact, why the headline dollar figure is the least useful number in any lockup story, and a three-question framework you can apply the next time a major unlock generates headlines. This is a correction to a widespread information failure, not a tutorial.
The mechanical reality of what a lockup expiration actually does
A lockup agreement is a contractual restriction signed at the time of an IPO by founders, employees, and early investors. It legally prohibits them from selling their shares during a specified post-listing period, typically 90-180 days, though large or complex listings sometimes extend far beyond that window. The terms are disclosed in the prospectus and regulatory filings, often months before the expiration date arrives.
On the expiration date, the sole change is that restricted shares transition from prohibited to permitted for sale. No provision within the lockup agreement compels holders to act, and no selling is automatically triggered.
What the lockup expiration changes:
- Legal eligibility to sell previously restricted shares
What it does not change:
- Individual holders’ tax circumstances and liabilities
- Personal financial needs and diversification goals
- Conviction in the company’s long-term value
- Ongoing insider trading restrictions, including Rule 10b5-1 plans and blackout windows
- Board-level or investor-agreement holding requirements
Every subsequent claim about “billions of shares hitting the market” rests on an assumption that legal eligibility produces immediate, universal selling. That assumption is almost never examined in coverage, and it is wrong about how every major holder category actually behaves. Once you see the gap between a legal event and a behavioural one, lockup headlines read very differently.
When big ASX news breaks, our subscribers know first
What four decades of research actually say about price impact
The academic literature on lockup expirations is unusually consistent, because the events are publicly scheduled, clearly defined, and easy to study across large samples. The findings tell a specific story, and it is not the one most headlines imply.
Studies by Field and Hanka, Ofek and Richardson, Bradley et al., and subsequent researchers consistently find average abnormal returns of approximately -1% to -3% around IPO lockup expirations. The most frequently cited benchmark is approximately -1.5%.
Field and Hanka’s IPO lockup study examined 1,948 share lockup agreements and found a statistically prominent three-day abnormal return of -1.5%, establishing the benchmark figure that subsequent researchers have consistently replicated across different sample periods and market conditions.
Key benchmark: The average abnormal return around IPO lockup expirations is approximately -1.5%, accompanied by elevated trading volume. This figure comes from aggregated data across hundreds of IPO lockups over multiple decades.
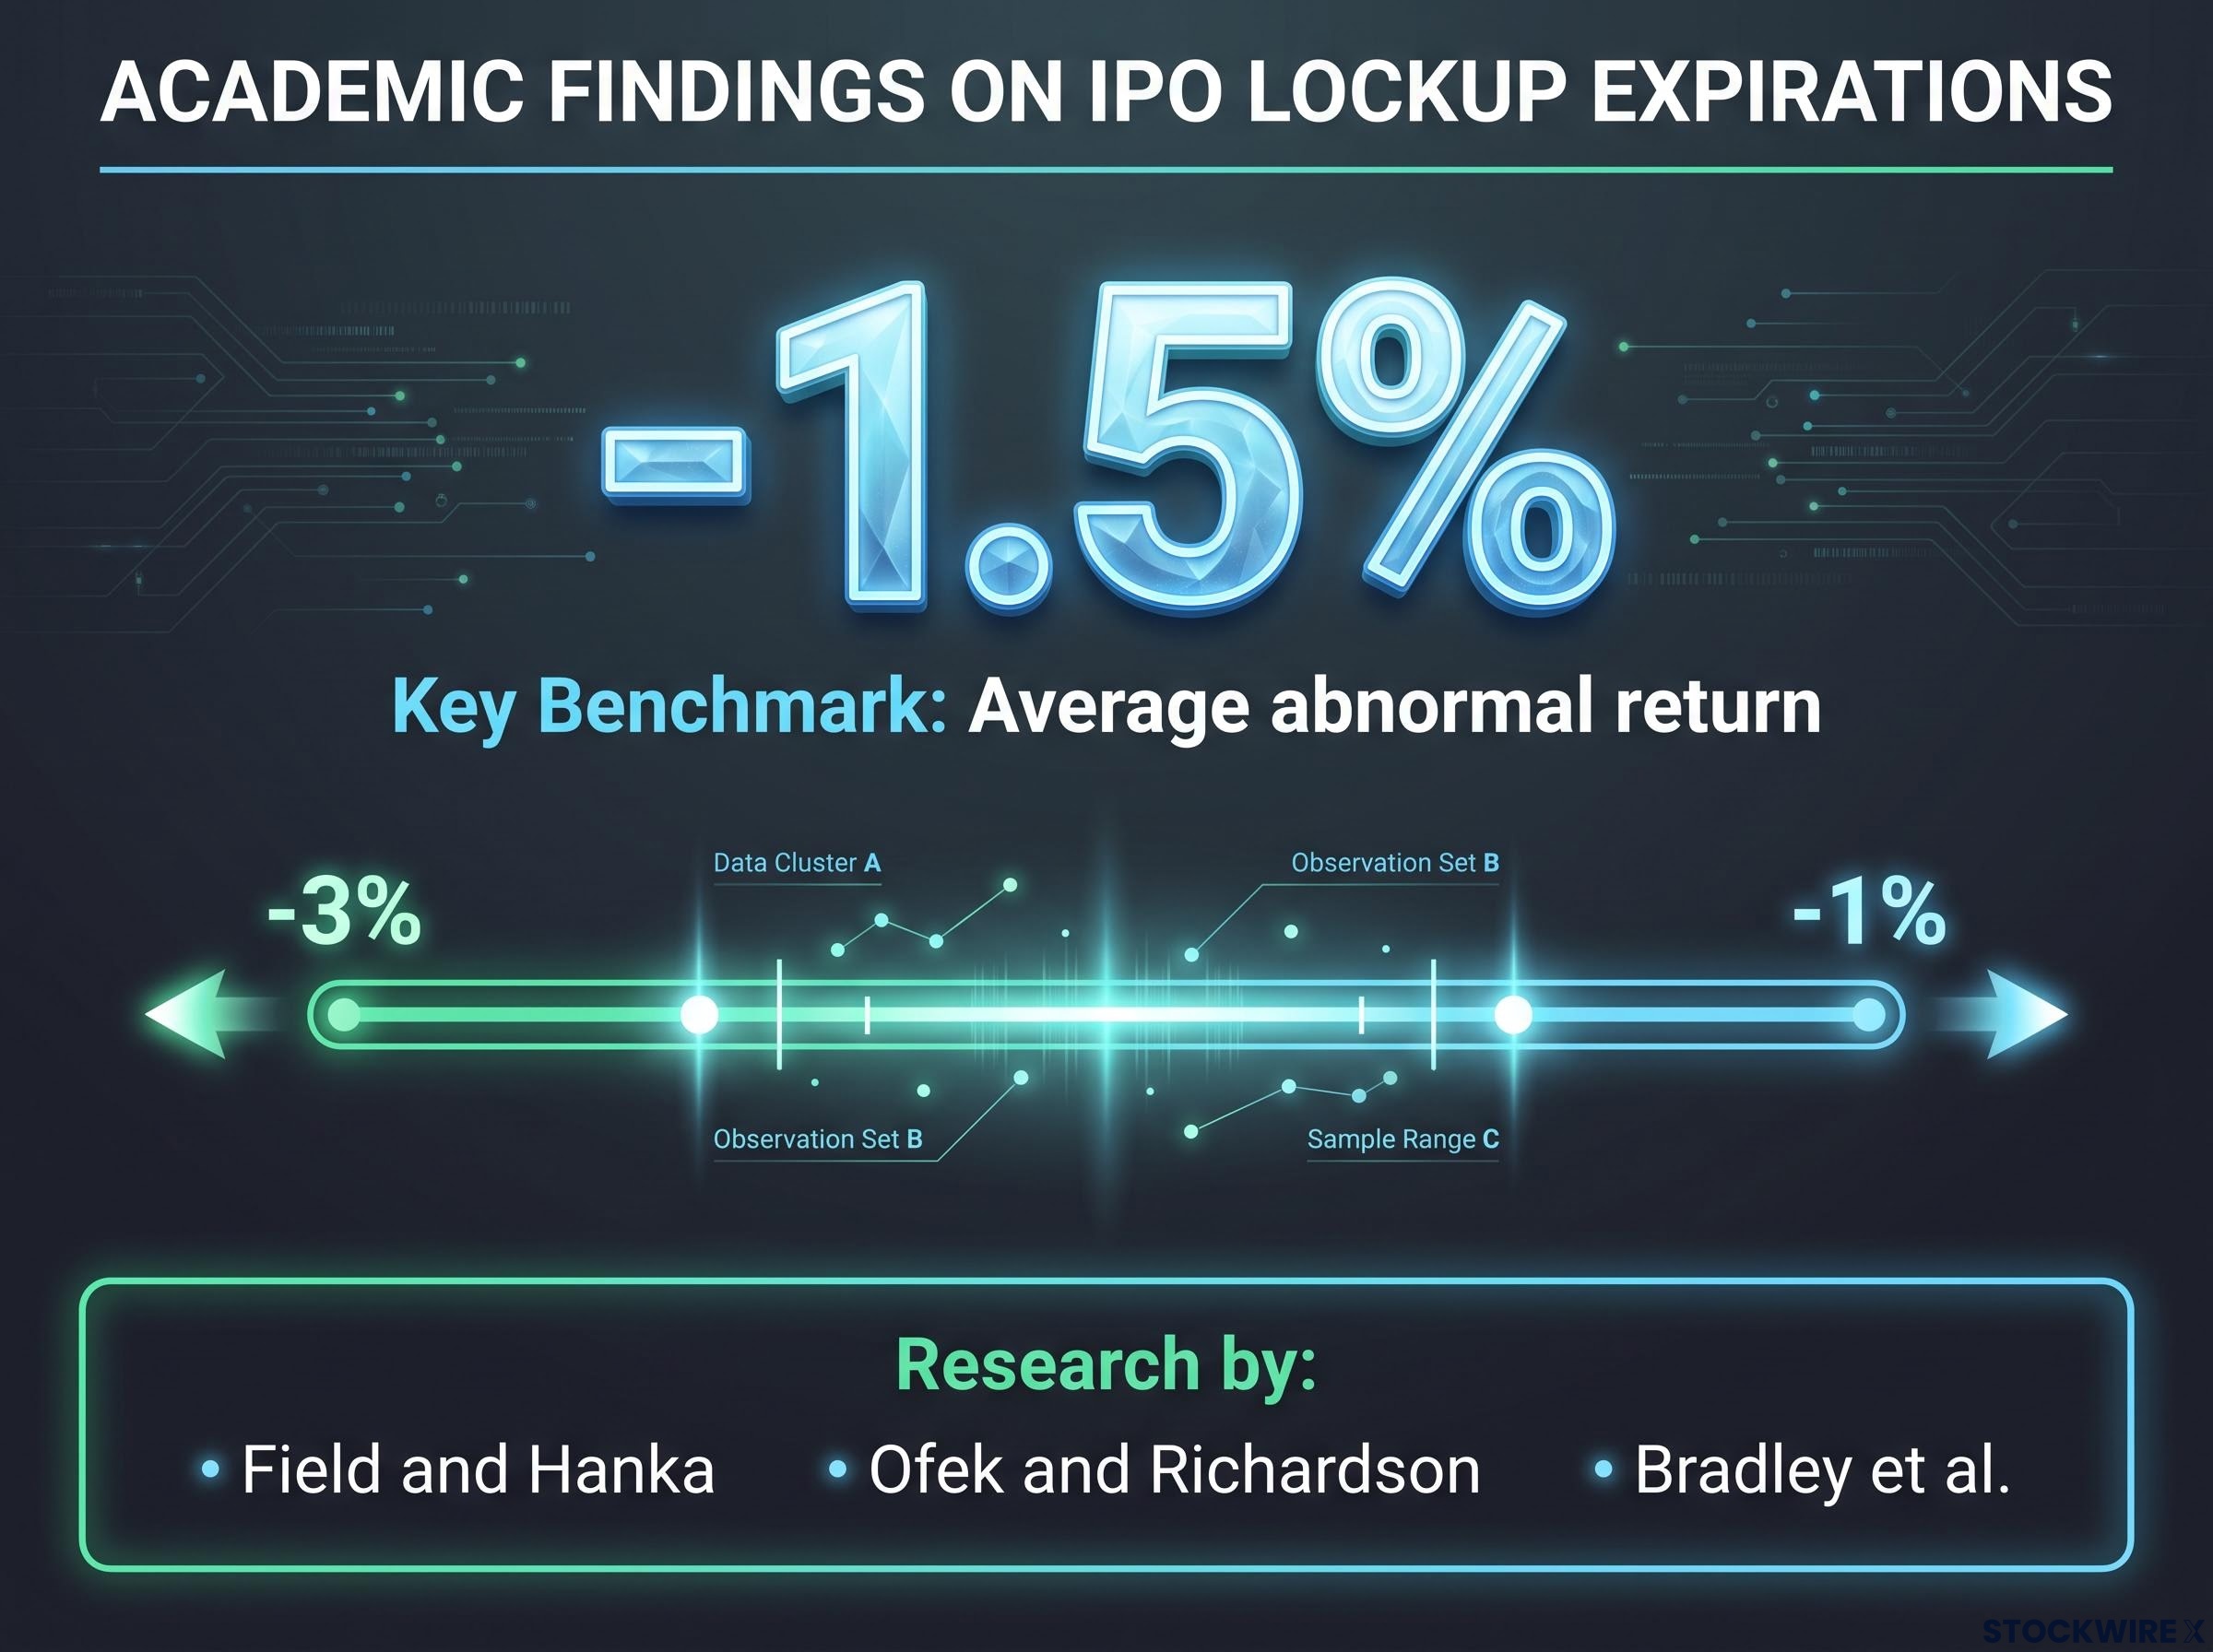
That is a detectable but modest impact: a measured negative signal visible across aggregated samples, not the collapse that “billions flooding the market” implies. And the timing matters as much as the magnitude.
Lockup expiration dates are published in listing documents well before they arrive, giving every institution with a position ample time to prepare. Because the event is known in advance, anticipated supply pressure gets absorbed gradually in the weeks leading up to the date rather than arriving as a surprise, which means the market has typically completed much of its adjustment before expiration day itself. Research documents short-selling spikes in the days and weeks before expiration, followed by normalisation after the event, consistent with a “sell the rumour, buy the news” pattern. Some studies detect no significant drop on the expiration date itself, finding instead a cumulative negative drift concentrated in the five days before.
Price discovery in equity markets operates continuously, meaning anticipated supply events like lockup expirations get absorbed gradually as informed participants adjust bids and offers in the days before the calendar date, rather than arriving as a single shock at the moment eligibility changes.
The average also masks wide variation across individual cases. Three conditions tend to produce larger-than-average negative impacts:
- A high unlock ratio (a large percentage of total shares becoming eligible at once)
- A small or speculative company with limited trading liquidity
- Deteriorating broader market liquidity over the same period
Conversely, larger firms and cases where liquidity improves after expiration can see neutral or even positive abnormal returns.
A -1.5% average anticipated move, concentrated before the date rather than on it, is a fundamentally different risk profile from the crash implied by “billions flooding the market.” That distinction changes how you should price the actual uncertainty in any specific case.
Why “billions hitting the market” is a mathematically unstable figure
The dollar figures that dominate lockup coverage are produced by a simple multiplication: a fixed share count multiplied by a current share price. The share count is locked; the price moves every session. That means the dollar valuation changes every time the stock trades, while the underlying quantity of shares becoming eligible stays identical.
This arithmetic produces a theoretical ceiling: what the entire block would be worth if every holder sold everything simultaneously at today’s price. That is not how rational large holders behave. It is not how markets function. And it is not a forecast of actual selling pressure.
SpaceX‘s first post-IPO lockup expiration, which took effect this month, demonstrated the instability concretely. The same block of approximately 911.5 million shares was reported by different outlets as worth approximately $123 billion, $100 billion, and $101 billion, depending on which date’s closing price each outlet used for the calculation.
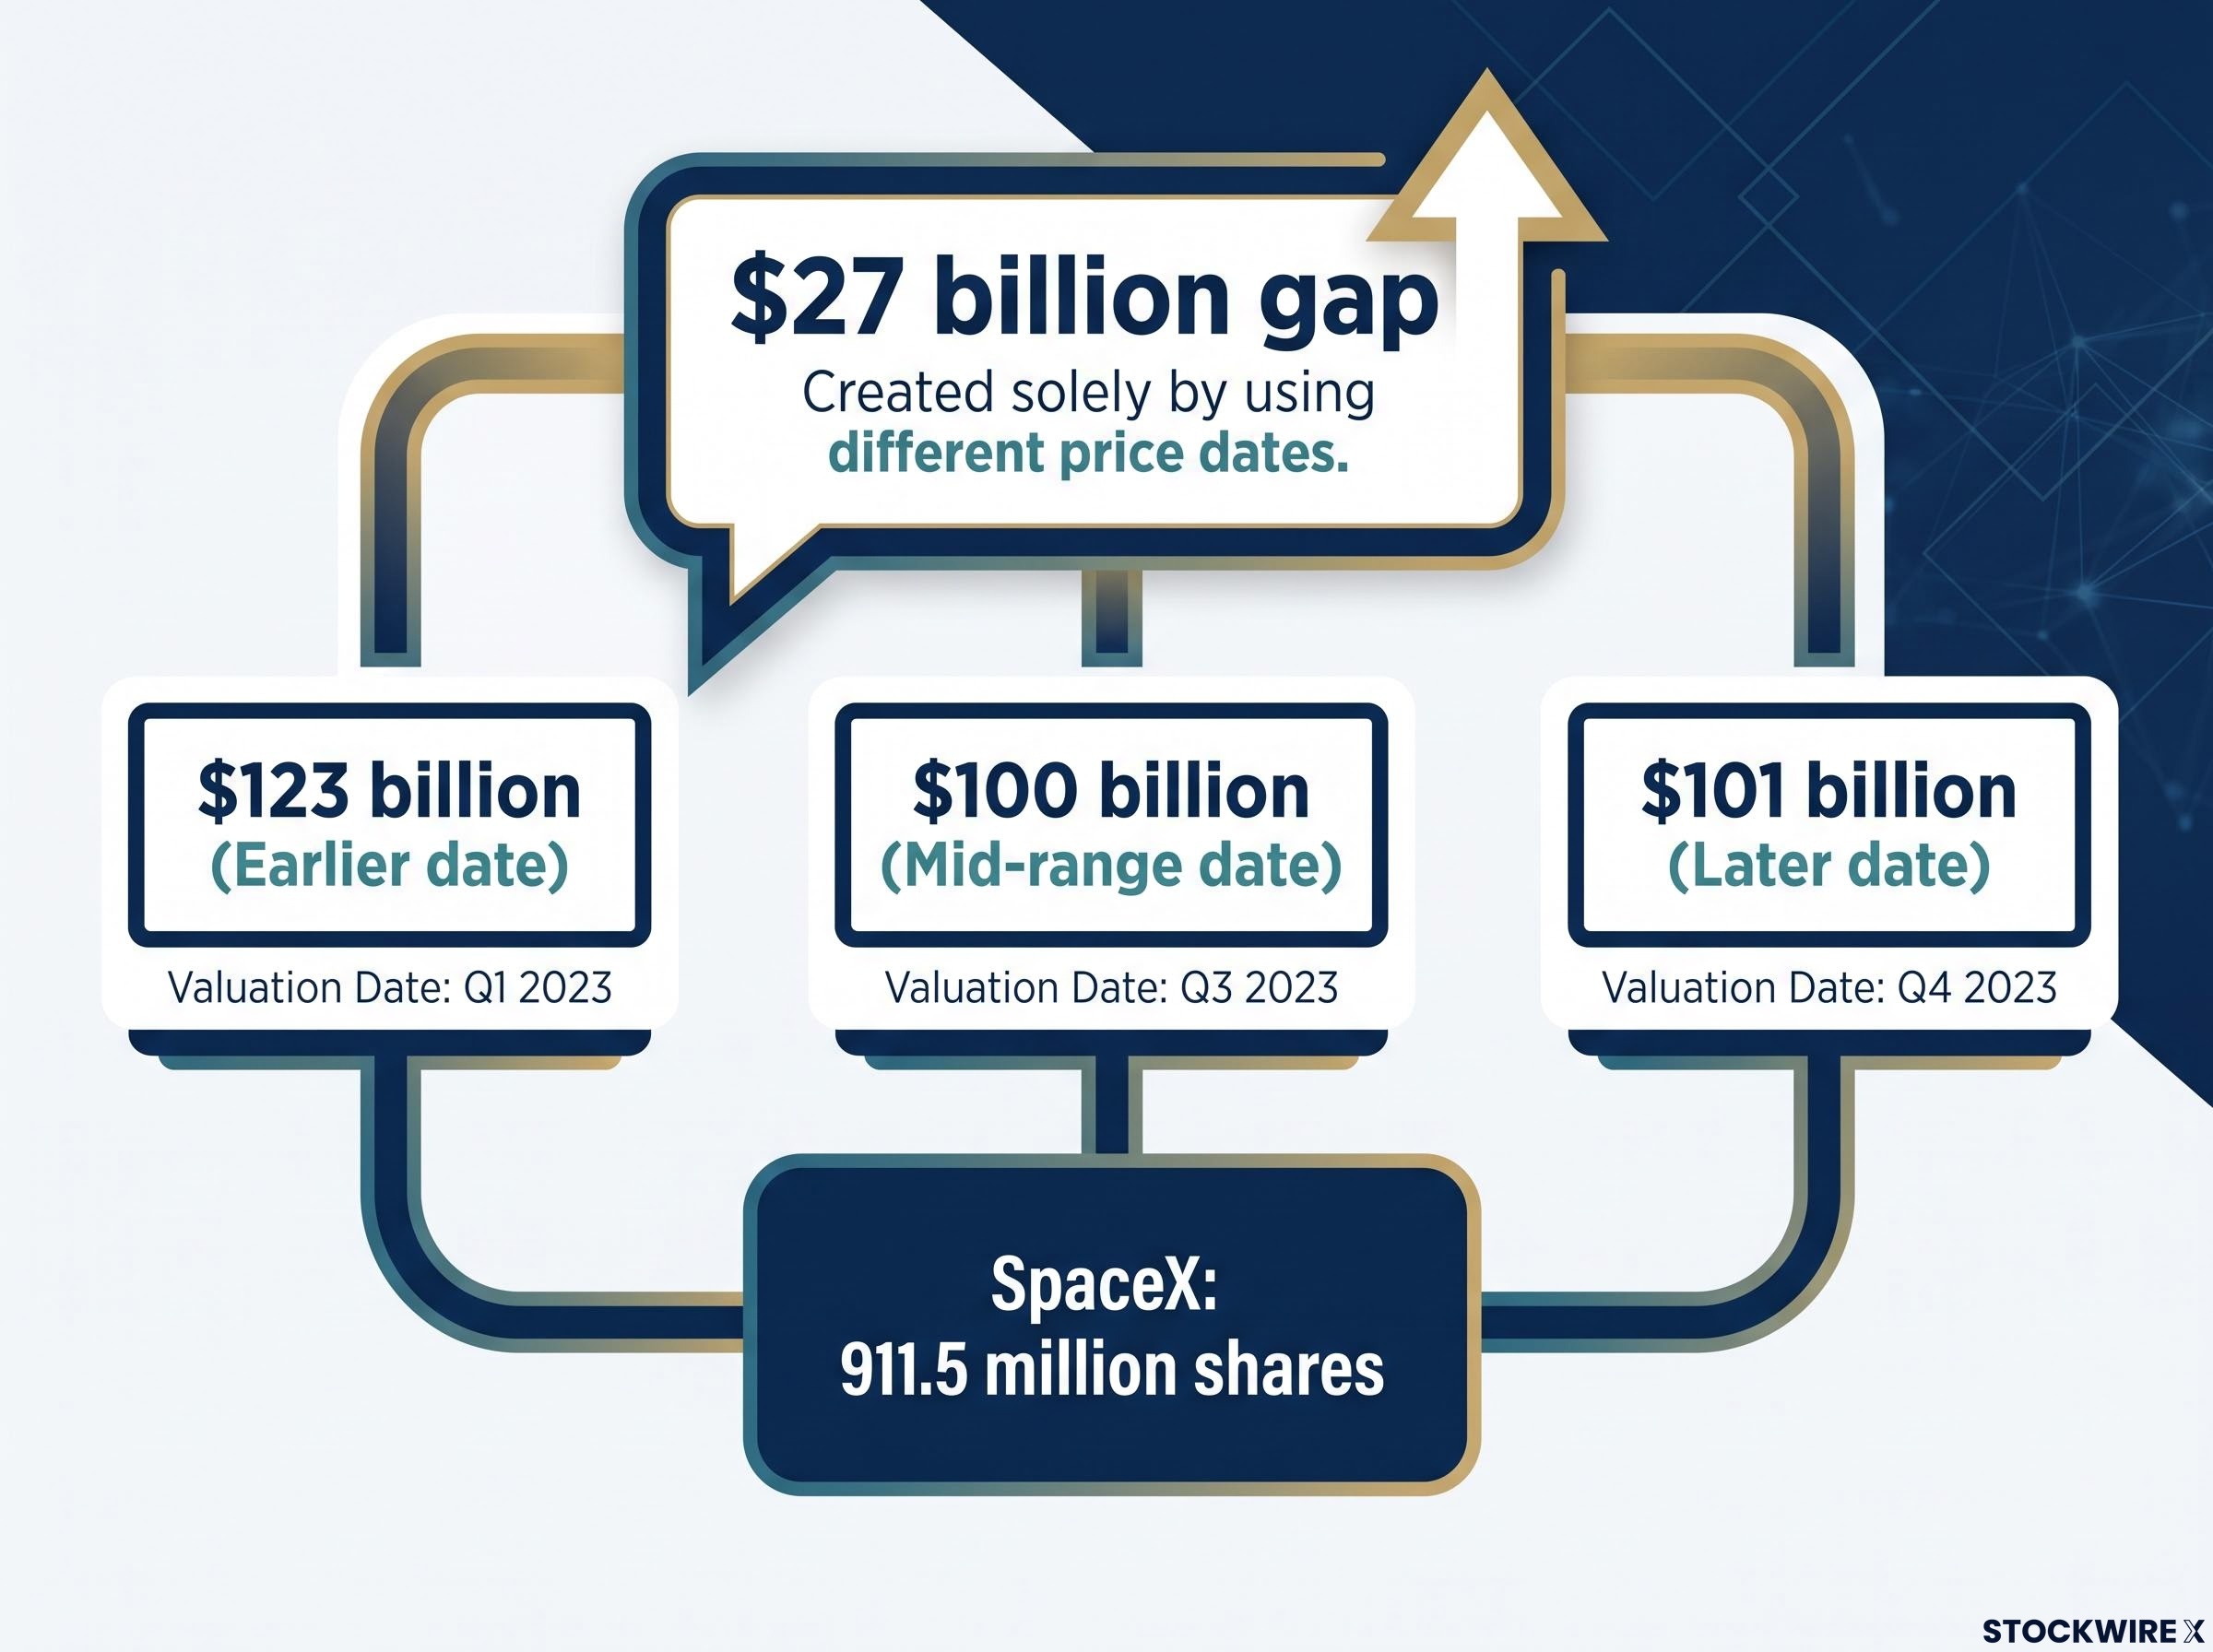
| Outlet reference | Share count | Price date used | Reported valuation |
|---|---|---|---|
| Outlet A | ~911.5 million | Earlier date (higher price) | ~$123 billion |
| Outlet B | ~911.5 million | Mid-range date | ~$100 billion |
| Outlet C | ~911.5 million | Later date | ~$101 billion |
That $27 billion gap across the reported figures arose solely because each outlet performed its multiplication on a different date’s closing price. The number of shares involved was the same in every instance.
When you encounter a lockup headline denominated in dollars, the correct reading is not “this is how much selling pressure the market faces.” It is “this is how much the shares would be worth if every locked holder sold everything today at today’s price, which will not happen.” Share counts are the stable, analytically meaningful figure, because they do not move with the market. Dollar valuations are price-dependent snapshots that shift with every trading session.
Why large holders almost never sell all at once
The “flood” framing assumes that holders who become legally eligible to sell will immediately do so, in size, all at once. The incentive structure of each major holder category argues against this independently.
Institutional pre-IPO investors
Institutional investors who acquired shares at pre-listing prices, typically a fraction of the IPO price, sit on large unrealised gains and therefore large potential tax liabilities. Selling massive blocks quickly would push the price down against their own interests, reducing proceeds on every share sold. Their rational strategy is planned, staged exits: secondary offerings, block trades, or algorithmic execution designed to minimise market impact. Research consistently finds that post-lockup price reaction is strongly linked to changes in liquidity, and firms that see improved liquidity after expiration sometimes see positive abnormal returns.
Founders and senior executives
Wholesale liquidation by founders carries reputational risk and is economically unattractive if they believe in the company’s long-term value. These holders also face ongoing constraints beyond the lockup itself: insider-trading windows, Rule 10b5-1 plans (pre-disclosed trading schedules that specify timing and volume in advance), board or investor holding requirements, and access to material non-public information. When founders and executives do sell, it is typically via pre-disclosed plans rather than surprise market orders on the expiration date.
Insider selling patterns in 2026 provide useful context for reading lockup behaviour: US corporate insiders sold approximately $77.6 billion in shares in H1 2026, a 20% year-on-year increase, but the vast majority of that activity ran through pre-disclosed Rule 10b5-1 plans and staged secondary transactions rather than open-market surprise sales.
Early employees
Early employees are the most heterogeneous group. Some need liquidity immediately for taxes, housing, or diversification. Others hold for years based on conviction. Their decisions depend on personal circumstances that are entirely invisible in any aggregate lockup figure, producing gradual and varied selling rather than coordinated liquidation on day one.
The result across all three categories:
- Institutional investors stage exits over months to protect their own proceeds
- Founders and executives are constrained by ongoing rules and reputational incentives
- Employees sell based on individual circumstances, not a collective signal
Actual post-lockup selling volume is almost always a fraction of the theoretical maximum, spread over time and intermediated by execution strategies specifically designed to reduce market impact. Any coverage that treats the theoretical maximum as the expected behaviour is making an assumption that is wrong about every major holder type simultaneously.
A practical framework for evaluating any lockup story
Three questions give you more analytical traction than any dollar-denominated headline. They work in sequence: each one narrows the uncertainty left by the previous answer.
- What fraction of total outstanding shares is unlocking, across what timeline? Percentages of outstanding shares and the full staggered schedule are the analytically meaningful inputs, not a single date or a dollar figure. In the SpaceX case, the first tranche was described as “more than doubling” the tradable supply, but the post-unlock float still represented approximately 11.8% of total shares outstanding. The founder’s stake remains locked until mid-2027, and much larger blocks become available over the next 12 months. The first unlock was the smallest release in the full schedule.
After the first unlock, SpaceX‘s tradable float represented approximately 11.8% of total shares outstanding. The remaining restricted shares, including the founder’s stake, are scheduled across tranches extending through mid-2027.
The SpaceX lockup schedule illustrates how far modern IPO structures have moved from the simple 180-day cliff model, with roughly a dozen distinct unlock tranches, a performance trigger, and a founder lockup extending to mid-2027 that operates entirely separately from the insider tranche sequence.
- Who are the major locked holders, and what are their incentives? Prospectuses, 13D and 13F filings, and insider ownership tables provide enough information to infer broad behavioural patterns. Are the large holders late-life venture capital funds under pressure to return capital to their own investors, or long-horizon institutions with no redemption pressure? Are founders constrained by governance agreements? Have Rule 10b5-1 plans already been disclosed that signal intended selling behaviour?
- What demand and liquidity factors operate over the same horizon? Supply is only half the equation. Whether incoming supply finds willing buyers depends on the company’s earnings trajectory, potential index inclusion decisions (which trigger mandatory buying by passive funds), prevailing interest rates, and broader sector sentiment. Research shows that positive liquidity effects can offset or even reverse the supply increase from unlocking.
If you ask these three questions before responding to a lockup headline, you are working with the same analytical framework that informs how institutional investors actually evaluate unlock risk, rather than the simplified crash narrative that shapes retail sentiment.
Reading the next lockup story with the evidence in hand
Standard lockup coverage uses a consistent vocabulary. Once you recognise what each phrase actually describes, and what it does not imply, the emotional weight of the headlines diminishes considerably.
| Common phrase | What it literally describes | What it does not imply |
|---|---|---|
| “Flood of shares hitting the market” | Shares becoming legally eligible for sale | That holders will sell, or sell immediately, or sell all at once |
| “$X billion in shares” | A volatile price-times-share-count calculation that changes daily | The actual dollar volume of expected selling |
| “Test of investor appetite” | One trading session in a multi-tranche, multi-month supply story | That the full lockup risk is resolved or confirmed in a single day |
The timing error deserves particular attention. SpaceX stock posted a 6.1% gain on 6 August, yet that session opened at a price that had been driven down by a 14% fall the previous day, itself an all-time closing low. Treating a single session’s recovery from that depressed starting point as evidence of smooth lockup absorption is analytically unreliable. It is equally plausible that the pre-expiration decline already reflected the market adjusting to anticipated supply, meaning a portion of the “lockup impact” had been absorbed in the sessions before the unlock date rather than on it.
The earnings and unlock sequencing in the SpaceX case added a layer of complexity that a simple supply-count analysis misses entirely: Q2 results landed 48 hours before the first tranche became eligible, creating a structural feedback loop between new financial information and insider incentives that is unusual even by post-IPO standards.
Three principles to carry forward:
- Fixed share counts are the analytically meaningful input; dollar valuations fluctuate with every price move and should not be treated as predictions
- The full unlock schedule matters more than any single date
- Demand context, including earnings, index flows, and liquidity, shapes the outcome alongside the supply count
Research across many IPO lockup events finds average abnormal returns in the range of -1% to -3%, a modest drag that the market largely prices in before the expiration date rather than on it. That empirical baseline is the correct starting point for evaluating any specific case, not the headline dollar figure and not a single session’s price action.
Lockup expirations as legal milestones, not market verdicts
Three corrections change how you read every lockup story from this point forward:
- Lockup expirations are legal eligibility changes, not behavioural guarantees. Nothing in the lockup agreement compels selling.
- The academic average impact is modest (approximately -1.5%), largely anticipated by the market before the date arrives, and highly dispersed across individual cases.
- The headline dollar figure is the least useful number in any lockup story, because it is a volatile snapshot that conflates a theoretical ceiling with an expected outcome.
The three-question framework (what fraction is unlocking and when, who are the holders and what are their incentives, what does the demand picture look like over the same horizon) does not predict whether a specific stock will rise or fall. It structures the inquiry correctly, which is the difference between reacting to a headline and evaluating a situation.
Lockup milestones are genuinely meaningful events in a company’s post-IPO life, and they deserve your attention. What they do not deserve is the reflexive alarm that large headline figures tend to generate. The goal here is calibration, not dismissal. And the supply-demand reasoning that makes lockup analysis work is the same reasoning that underpins rigorous market analysis generally, making this a skill that extends well beyond the next unlock date you encounter.
This article is for informational purposes only and should not be considered financial advice. Investors should conduct their own research and consult with financial professionals before making investment decisions.