China’s economy grew in July 2025. That is precisely the problem.
The headline number held, but what it masked was a simultaneous deceleration across every major activity measure: industrial production, retail sales, fixed-asset investment, and employment all slowed in the same month. Headline inflation was flat. Producer prices fell 3.6%. This was not a single sector wobbling; it was a system-wide loss of momentum.
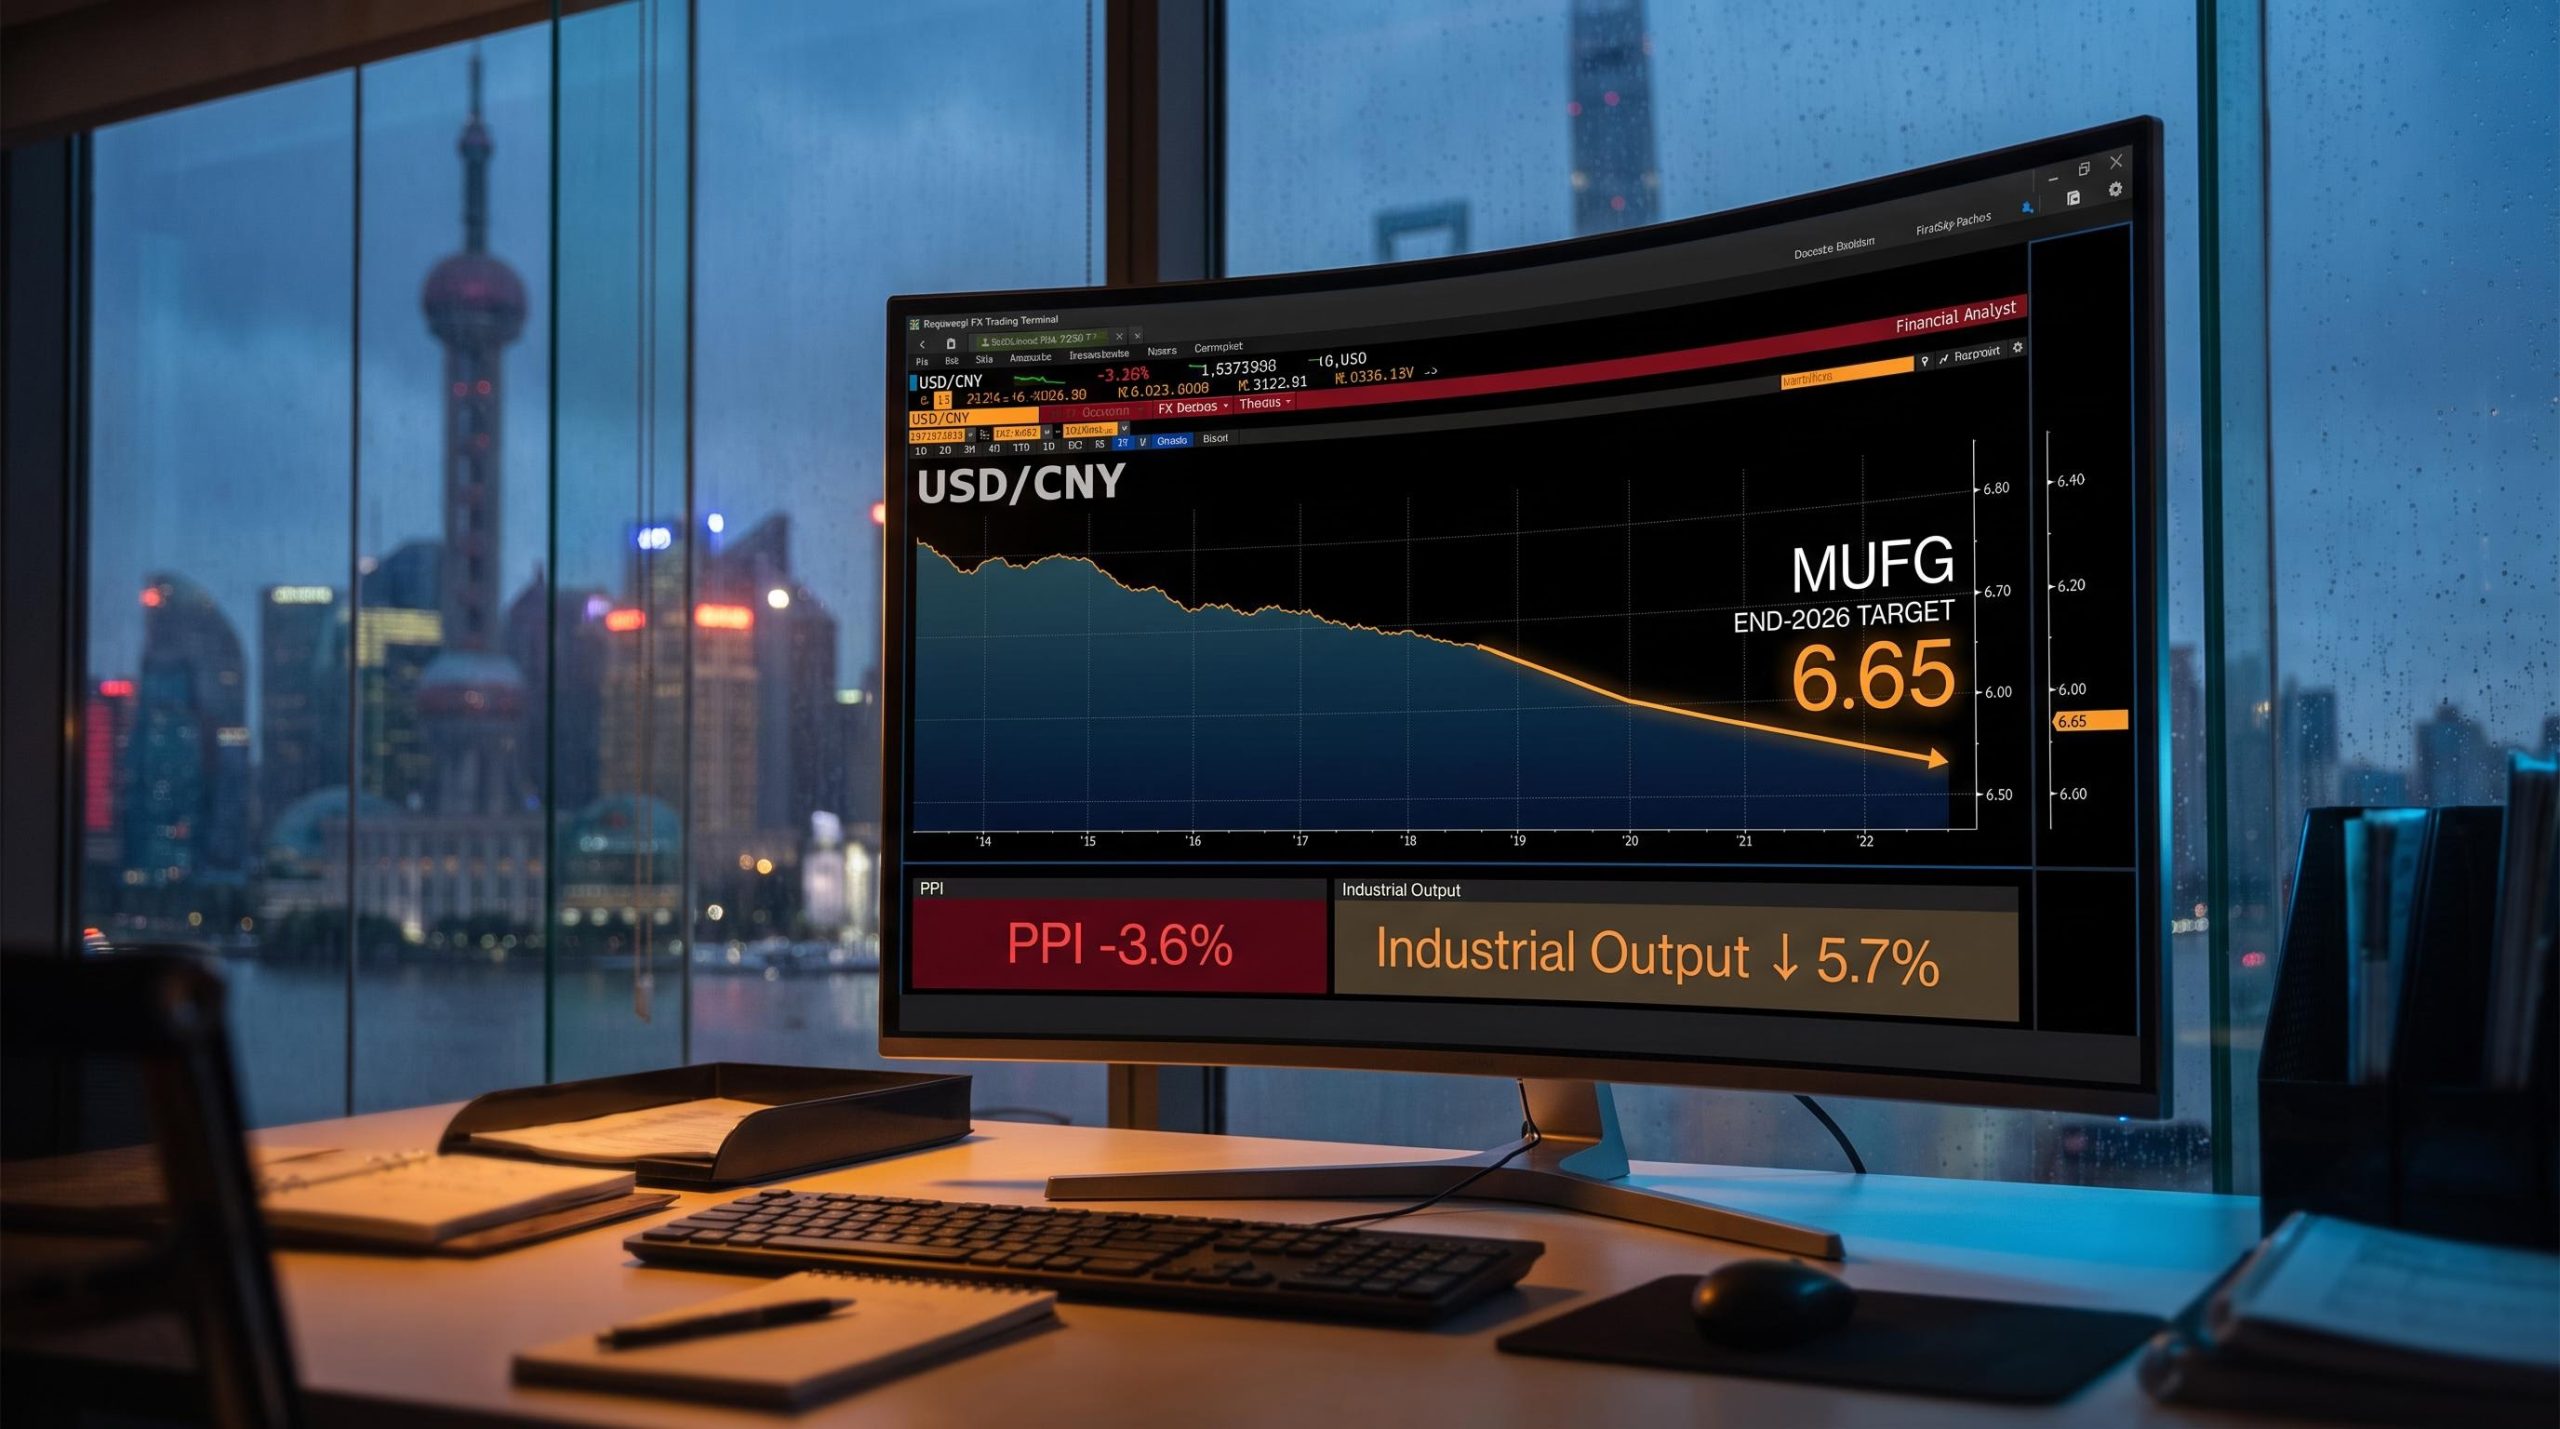
And yet MUFG, one of the world’s largest foreign exchange desks, maintained its forecast for USD/CNY 6.65 by the end of 2026, a call for gradual yuan appreciation through the very softness the data describes. That raises an obvious question: what does their currency team see that the activity numbers do not?
Here is what the gap between weak near-term data and medium-term currency confidence actually means for portfolio positioning across Chinese equities, fixed income, and FX, and a structured framework for tracking whether the thesis holds through the rest of the year.
A slowdown that is broader than it looks
Start with the July numbers in sequence, because the pattern matters more than any single print.
Industrial production grew 5.7% year-on-year, down from 6.8% in June. Retail sales rose 3.7%, down from 4.8%. Fixed-asset investment grew just 1.6% across January to July, well below the roughly 2.7% economists expected. Property investment fell approximately 12% over the same period. Surveyed urban unemployment edged up to 5.2% from 5.0% in the prior two months.
| Indicator | July 2025 | Prior reading | Direction |
|---|---|---|---|
| Industrial production (YoY) | 5.7% | 6.8% (June) | Down |
| Retail sales (YoY) | 3.7% | 4.8% (June) | Down |
| Fixed-asset investment (Jan-Jul) | 1.6% | ~2.7% (expected) | Below expectations |
| Surveyed urban unemployment | 5.2% | 5.0% (May-Jun) | Up |
| PPI (YoY) | -3.6% | Contraction deepening | Down |
Every measure moved in the same direction simultaneously. That closes off the “this is temporary” interpretation: a supply disruption would hit production but not retail sales. A seasonal drag would show in one sector, not five.
The common constraint here is demand.
Household wealth concentration in property, with an estimated 60-70% of Chinese household assets tied to residential real estate, creates a transmission mechanism through which ongoing price declines suppress consumer confidence and private investment well beyond what fixed-asset investment figures alone capture, and it is this dynamic that makes weak retail sales structurally stickier than a simple fiscal stimulus package can reverse.
What the price data adds to the picture
The price readings sharpen the diagnosis without simplifying it. Headline CPI was flat year-on-year. PPI fell 3.6%, deepening factory-gate deflation. That combination, weak consumer prices alongside accelerating producer deflation, is consistent with demand too soft to absorb output.
Core CPI (which strips out food and energy) rose 0.8% year-on-year, its highest reading in approximately 17 months. That slightly complicates the clean deflation narrative and deserves honest acknowledgment. It suggests some underlying price pressure is building in services, even as goods prices compress. The picture is not a deflationary spiral; it is a demand shortfall broad enough to show up in production, consumption, investment, employment, and prices all at once. A single policy fix is unlikely to reverse that quickly.
AMRO’s analysis of China’s low inflation challenge draws explicit parallels with Japan’s deflationary episode, identifying weak domestic demand and persistent factory-gate price contraction as the structural forces compressing China’s price level, a diagnosis that aligns with the July PPI reading of negative 3.6%.
When big ASX news breaks, our subscribers know first
New economy versus old economy: the split that changes what the data means
The aggregate numbers tell you China is slowing. The sector-level data tell you something more useful: China is rebalancing unevenly, and the deceleration is concentrated in the economy that Beijing is deliberately letting shrink.
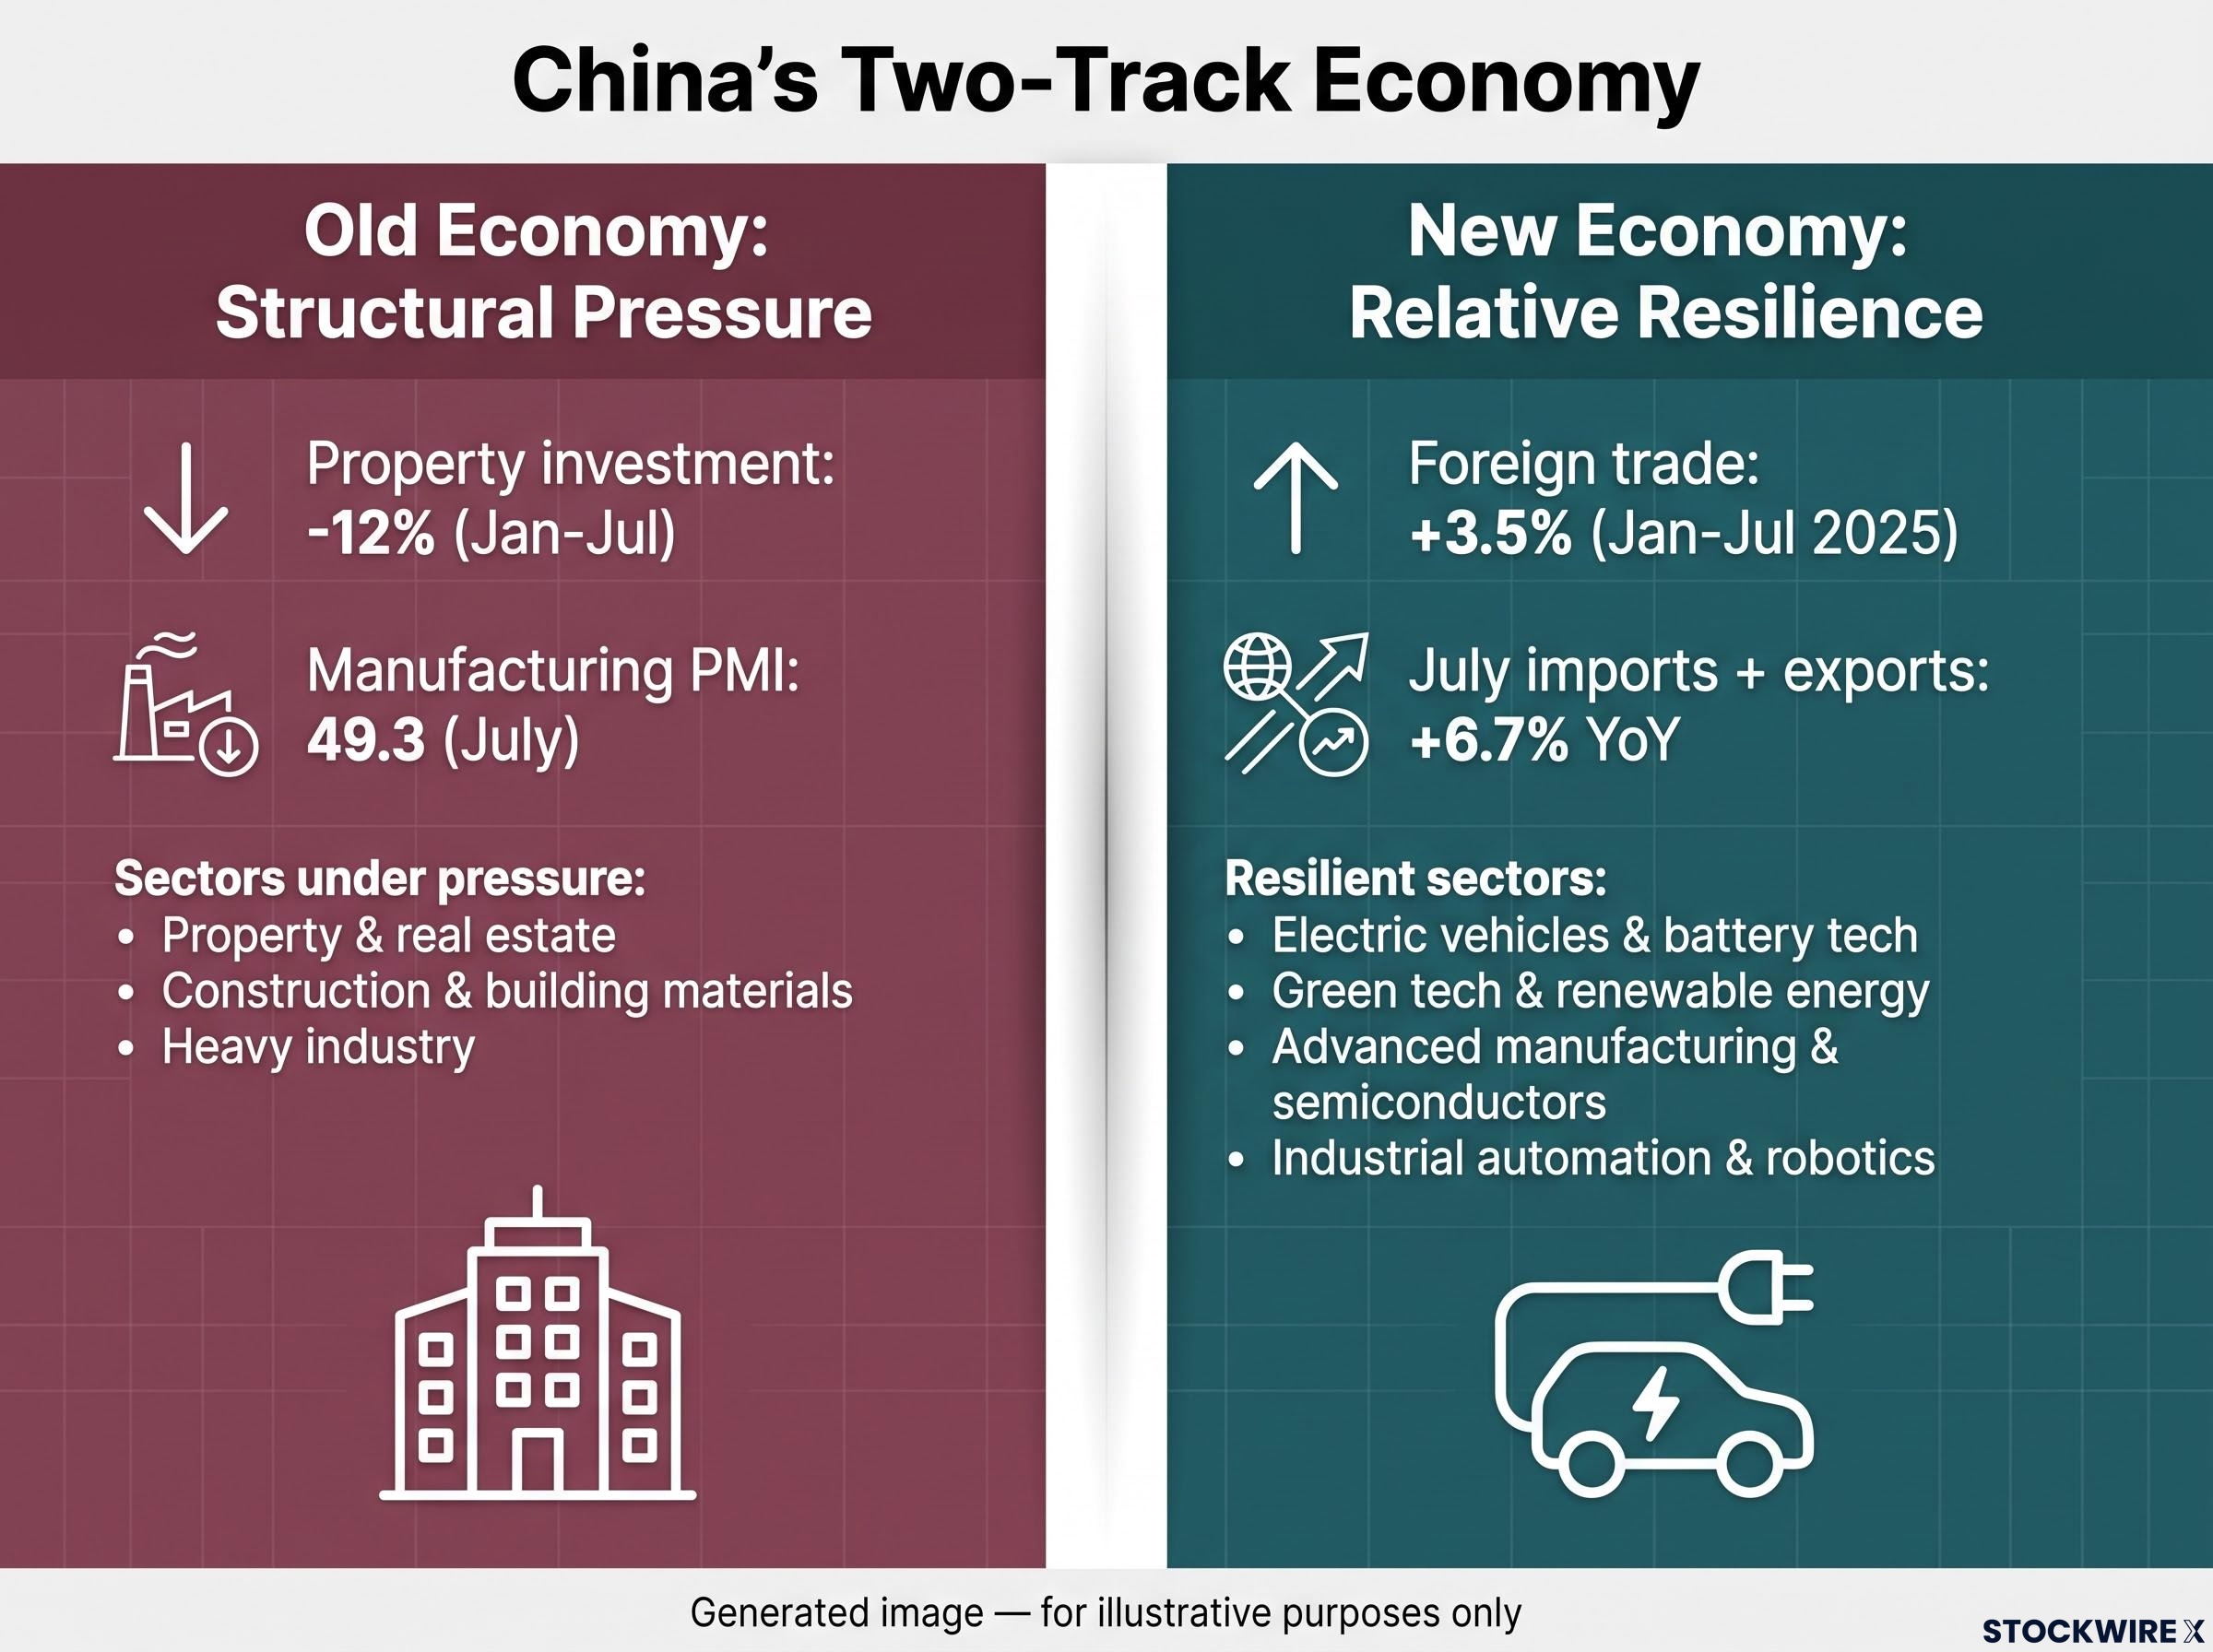
Property investment, down approximately 12% year-on-year across January to July, continues to drag. The official manufacturing PMI (purchasing managers’ index, a survey-based gauge of factory activity where readings below 50 signal contraction) remained below that threshold at approximately 49.3 in July, marking a fourth consecutive month of contraction. These are the old-economy indicators, and they are tracking the structural pressure on construction, low-margin heavy industry, and property-linked activity.
The new economy tells a different story. Foreign trade grew 3.5% in the first seven months of 2025, and July imports plus exports rose 6.7% year-on-year (both figures per official data, independently unconfirmed). Higher-value manufacturing and export categories showed relative resilience.
China high-tech manufacturing posted 16.9% year-on-year growth in July 2026 even as the headline industrial output figure came in at just 4.5%, with industrial robots up 30.2%, new energy vehicles up 29.9%, and semiconductors up 20.7% — a compounding pattern across unrelated sectors that confirms the structural break is systemic rather than sector-specific.
The sectors under structural pressure:
- Property and real estate development
- Construction and building materials
- Low-margin, energy-intensive heavy industry
The sectors showing relative resilience:
- Electric vehicles and battery technology
- Green technology and renewable energy equipment
- Advanced manufacturing and semiconductors
- Industrial automation and robotics
These two groups are not on the same cycle. The new economy is not bouncing back from old-economy weakness; they are on separate trajectories. For investors, that means aggregate China exposure is increasingly an imprecise instrument. A broad index bet conflates two very different economic stories. Sector selection within China matters far more than it did a decade ago.
What Beijing is likely to do, and what that will not fix
Beijing’s preferred lever is fiscal acceleration, not a dramatic new stimulus package. The toolkit is already assembled:
- Infrastructure project rollout: Bringing forward construction activity already sitting in approved pipelines, with spending volumes anticipated to rise through the final quarter of 2025.
- Local government bond issuance: Accelerating the release and deployment of already-approved funds to support construction and public works.
- Piecemeal property support: Targeted measures to stabilise the housing market, including purchase incentives and developer financing, rather than a blanket bailout.
Official briefings have emphasised that fixed-asset investment is being “scaled up” and foreign trade remains a resilient pillar. The message is continuity and implementation, not a pivot.
The July data have fuelled calls from economists and market participants for more robust structural reforms, particularly to address property stress and weak household demand. The gap between what authorities are willing to deploy and what economists say is needed remains the defining tension in China’s policy response.
That gap matters for portfolio construction. Fiscal acceleration is designed to cushion growth, not resolve the underlying demand shortfall. Weak retail sales, subdued private investment, and property stress are problems that infrastructure spending alone cannot fix. What investors get from this policy stance is a cyclical floor, not a cyclical lift. Positioning that mistakes one for the other will misread the risk-reward in cyclical China exposures.
Why MUFG sees the yuan strengthening despite the weakness
A major bank maintaining a currency appreciation call through a broad-based economic softening is counterintuitive on its face. The logic, once unpacked, is more coherent than the headline number suggests.
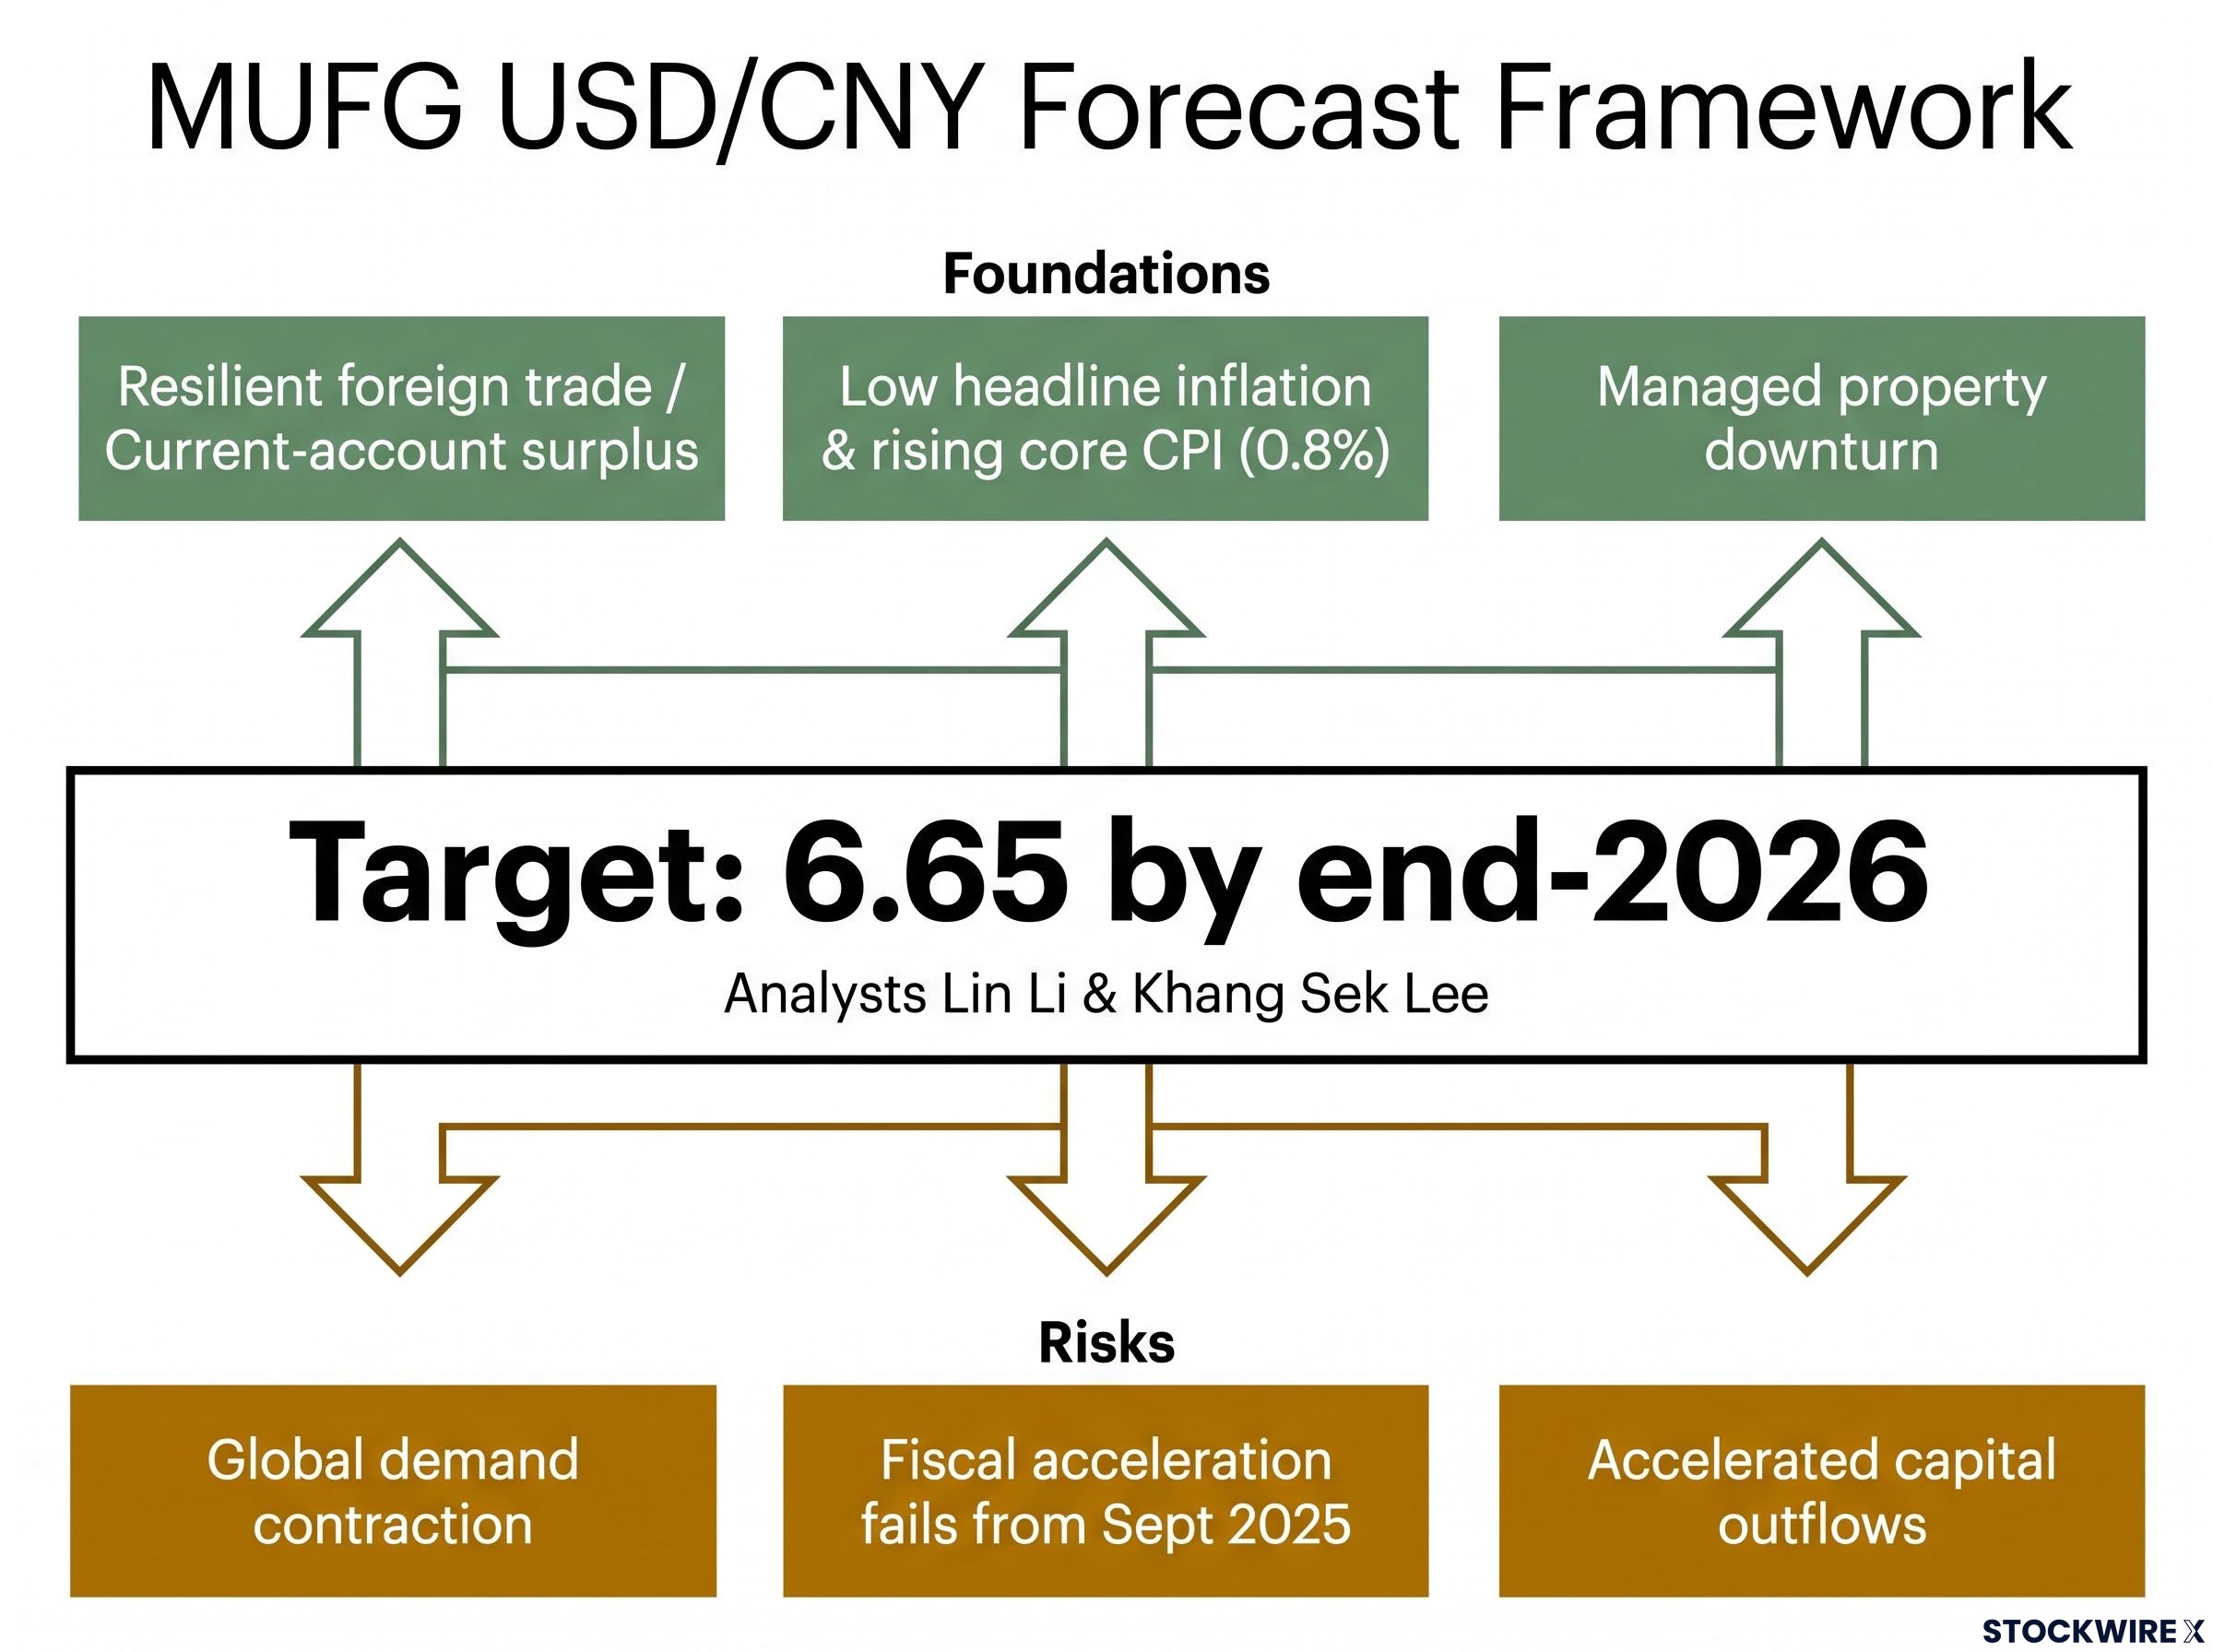
MUFG analysts Lin Li and Khang Sek Lee hold their USD/CNY target at 6.65 by end-2026, a gradual appreciation view that was not revised following the soft July data. That non-revision is itself the signal: the forecast is anchored in medium-term structural factors, not short-term activity readings.
MUFG’s stance: Analysts Lin Li and Khang Sek Lee reiterate a “gradual appreciation view” for the renminbi, maintaining their 6.65 target despite July’s broad-based economic softening. The call implies confidence in China’s external position and policy management capacity over the medium term.
Three foundations support the call. First, China’s current-account surplus remains supported by resilient foreign trade; July trade data showed continued growth in exports and imports. Second, low headline inflation alongside rising core CPI suggests the economy is not in a deflationary spiral that would compel authorities toward competitive devaluation. Third, authorities have demonstrated willingness to manage the property downturn through targeted measures without resorting to destabilising capital controls or large currency adjustments.
The PBOC’s daily yuan fix, published at 9:15 a.m. Beijing time and capping onshore USD/CNY moves within a strict 2% band, is the mechanism through which institutional confidence in the 6.65 target either gets validated or quietly abandoned; the gap between the published fix and model-implied values is the closest real-time readout of whether Beijing’s policy stance is holding.
What this tells you is that a professional FX desk is weighting China’s structural position, its external earnings, its inflation profile, and its policy credibility, more heavily than its cyclical weakness. That is itself a medium-term signal worth incorporating into how you think about China asset risk appetite.
Where the forecast could break down
Three risks could invalidate or delay the 6.65 target: a sharper global demand contraction that erodes China’s export earnings; policy disappointment if fiscal acceleration fails to materialise at the pace anticipated from September 2025; and accelerated capital outflows driven by deteriorating investor confidence in the property sector or broader financial stability. The forecast is a probability-weighted view, not a certainty.
How to position across Chinese assets given this picture
The investment framework that follows from this analysis is not “buy China” or “avoid China.” It is: which China, at what currency exposure, and with what view of the policy delivery timeline.
The K-shaped divergence between China’s technology-export economy and its property-consumption economy is now entering its sixth consecutive year and has been classified as a structural condition rather than a transitional phase by institutional research teams at Citi and Bloomberg Economics, which explains why investors holding broad index exposure without sector decomposition are effectively running concentrated property risk without naming it.
FX exposure comes first. In a gradual yuan appreciation scenario toward 6.65, unhedged renminbi-denominated asset exposure can add FX return on top of local-currency performance. For USD-based investors, the hedging decision is explicit and consequential: full hedging in this scenario may forgo a meaningful source of return.
Equity tilts follow the sector split. The new-economy sectors with policy and trade tailwinds:
- EVs and battery supply chains
- Green technology and renewable energy
- Advanced manufacturing
- Industrial automation
The sectors to underweight, given structural drag:
- Property developers and related services
- Construction and building materials
- Traditional heavy industry
Infrastructure-linked equities sit between the two: treat them as cyclical buffers supported by fiscal acceleration from September 2025, not as growth engines.
| Asset category | Opportunity | Risk consideration |
|---|---|---|
| New-economy equities | Policy-favoured sectors with export resilience | Valuation compression if global demand weakens |
| Infrastructure-linked equities | Cyclical cushion from fiscal acceleration | Temporary support, not structural growth |
| Onshore fixed income | Carry plus potential FX gain on sovereign and policy-bank bonds | Avoid property-related credit and LGFV-linked debt |
| CNY FX exposure | Gradual appreciation toward 6.65 adds return for unhedged positions | Global slowdown or capital outflow risk could stall or reverse the path |
Fixed income in this environment is a carry-plus-FX opportunity. High-quality onshore sovereign and policy-bank bonds offer carry with potential currency gain. Property-related credit and local government financing vehicle (LGFV) debt warrant caution, given the 12% contraction in property investment and persistent producer deflation.
This article is for informational purposes only and should not be considered financial advice. Investors should conduct their own research and consult with financial professionals before making investment decisions. Past performance does not guarantee future results. Financial projections are subject to market conditions and various risk factors.
The signals that will tell you whether the thesis is holding
A thesis built on multiple variables needs a monitoring framework with explicit triggers for reassessment. Four dimensions, ranked by near-term importance:
- Policy delivery signals: The critical test is whether the government’s commitment to ramping up infrastructure spending translates into actual project activity in the months ahead. If disbursement lags or project commencements disappoint, the cyclical floor beneath the positioning framework weakens immediately.
- Monthly activity data: NBS releases covering industrial production, retail sales, fixed-asset investment, and unemployment. Watch for stabilisation or further deterioration in the August and September prints.
- Price dynamics: Core CPI at 0.8% is the demand stabilisation signal. If it continues to firm, underlying demand may be finding a base. If it reverts, the deflationary pressure is deeper than the July reading suggested.
- FX behaviour: The path of USD/CNY relative to the 6.65 target functions as a real-time confidence barometer. Sustained movement toward that level validates the institutional thesis; stagnation or reversal would prompt reassessment of the entire framework.
Near-term test: The pace at which government-backed construction activity gets off the ground in the coming months is the most concrete near-term indicator of whether fiscal support is genuine. Tangible progress would confirm the cyclical cushion; a failure to deliver would require each subsequent layer of the investment thesis to be re-examined.
A deteriorating reading in any one of these dimensions does not invalidate the thesis alone, but it changes the probability weighting on the others. That is what makes the framework useful: it gives you specific data points to watch rather than a static conclusion to hold.
What the yuan call tells you that the activity data cannot
The core tension running through this analysis, broad-based economic deceleration alongside an unchanged yuan appreciation forecast, is not a contradiction. It reflects two different time horizons and two different analytical inputs.
The July activity data measure what is happening now: demand is weak, production is slowing, unemployment is edging up. The MUFG currency call measures something else entirely: institutional confidence that China’s policy framework, its external surplus, and its inflation profile are strong enough to support a gradually strengthening currency over the medium term. Both can be true simultaneously.
The forward-looking posture this analysis supports is selective sector exposure within China, deliberately constructed FX hedging decisions anchored to the 6.65 thesis, and a monitoring discipline that distinguishes monthly cyclical noise from structural trend shifts. The question facing investors is not whether China’s economy is weak. It is. The question is whether the institutional and policy framework around it is strong enough to support medium-term asset appreciation.
The yuan call is, at its core, a confidence signal about institutional capacity. Investors who read it only as a currency trade are missing the broader implication: it reflects a professional judgment that Beijing can manage this cycle without destabilising the financial system. That judgment, whether it proves correct, is currently the most credible single-indicator framework for sizing medium-term China exposure.
These forward-looking statements are speculative and subject to change based on market developments, policy decisions, and global economic conditions.