You can correctly identify the next big investment theme, buy the highest-returning ETF in that space, and still end up worse off than if you had parked the money in a plain index fund. It happens more often than most investors realise, and it has nothing to do with being wrong about the trend.
Right now, AI infrastructure ETFs have returned 40-65% over the past year. The theme is real. Enterprise spending on data centres, semiconductors, and power equipment is accelerating. Many investors are either already holding positions or evaluating whether to enter. The question worth asking is not whether AI is a legitimate structural shift. It is whether today’s price already assumes everything goes right.
Here is a framework for translating any thematic ETF’s valuation multiple into a growth assumption you can stress-test, compare against the broad market, and use to make a disciplined entry decision tonight, not just an informed opinion you forget by morning.
Why the right theme at the wrong price still loses
Cisco is the case that should sit in the back of every thematic investor’s mind. In 1999-2000, the internet thesis was correct. Cisco’s strategic position at the centre of networking infrastructure was real. The company went on to grow revenue and earnings for years after its peak. None of that mattered to investors who bought at the top.
Those who paid 1999-2000 prices for Cisco were still waiting to recover their losses as of mid-2026, a period of roughly 25 years in which the entry price alone erased any benefit from being correct on the theme and the company.
Growth stock valuations carry a layered risk structure that goes beyond the multiple itself: company-specific earnings disappointment, valuation stretch even when the business keeps growing, and interest-rate sensitivity that compresses distant cash flows independently of any operational result.
Billy Loong, ETF and growth investing specialist at Global X, frames the risk directly: entry valuation is the variable that determines whether a correct thematic call translates into actual investor returns. Even a perfectly identified trend can produce poor outcomes if the price paid assumes more growth than the theme ultimately delivers.
The core insight is precise: the risk in thematic investing is not identifying the wrong theme. It is paying a price that already assumes near-perfect execution across a timeline that even the best companies rarely deliver on. A price-to-earnings ratio (P/E), the share price divided by per-share earnings, must be read relative to the growth expectation embedded in it, not treated as a standalone number that is “high” or “low” in isolation.
That shift in framing is what separates thematic conviction from investment discipline. You need both.
When big ASX news breaks, our subscribers know first
From P/E ratio to implied growth: the translation every investor needs
When you look up a thematic ETF and see a P/E ratio of 30, your instinct might be that it looks expensive. When you see a P/E of 15, it might feel cheap. Both reactions are incomplete without the second variable: how fast the underlying companies are growing their earnings.
The translation works in three steps. Start with today’s P/E. Form a view on how fast the portfolio’s earnings can grow. Then ask whether the current price looks reasonable against three benchmarks: the broad market (the S&P 500 is expected to grow earnings in the mid-teens to low-twenties percent range for 2026), the risk profile of the theme, and the durability of its demand drivers.
The implied growth rate embedded in any price is the number that standard brokerage platforms never surface: it converts today’s market cap into a specific annual revenue demand the company must meet for an investor buying at today’s price to earn a target return.
A higher multiple can be entirely justified if earnings growth is proportionally higher. The discipline is to stop asking whether the multiple is high and start asking whether the implied growth rate is realistic.
What the PEG ratio tells you (and where it falls short)
The PEG ratio, P/E divided by the earnings growth rate, gives you a quick way to compare growth-adjusted valuations across funds.
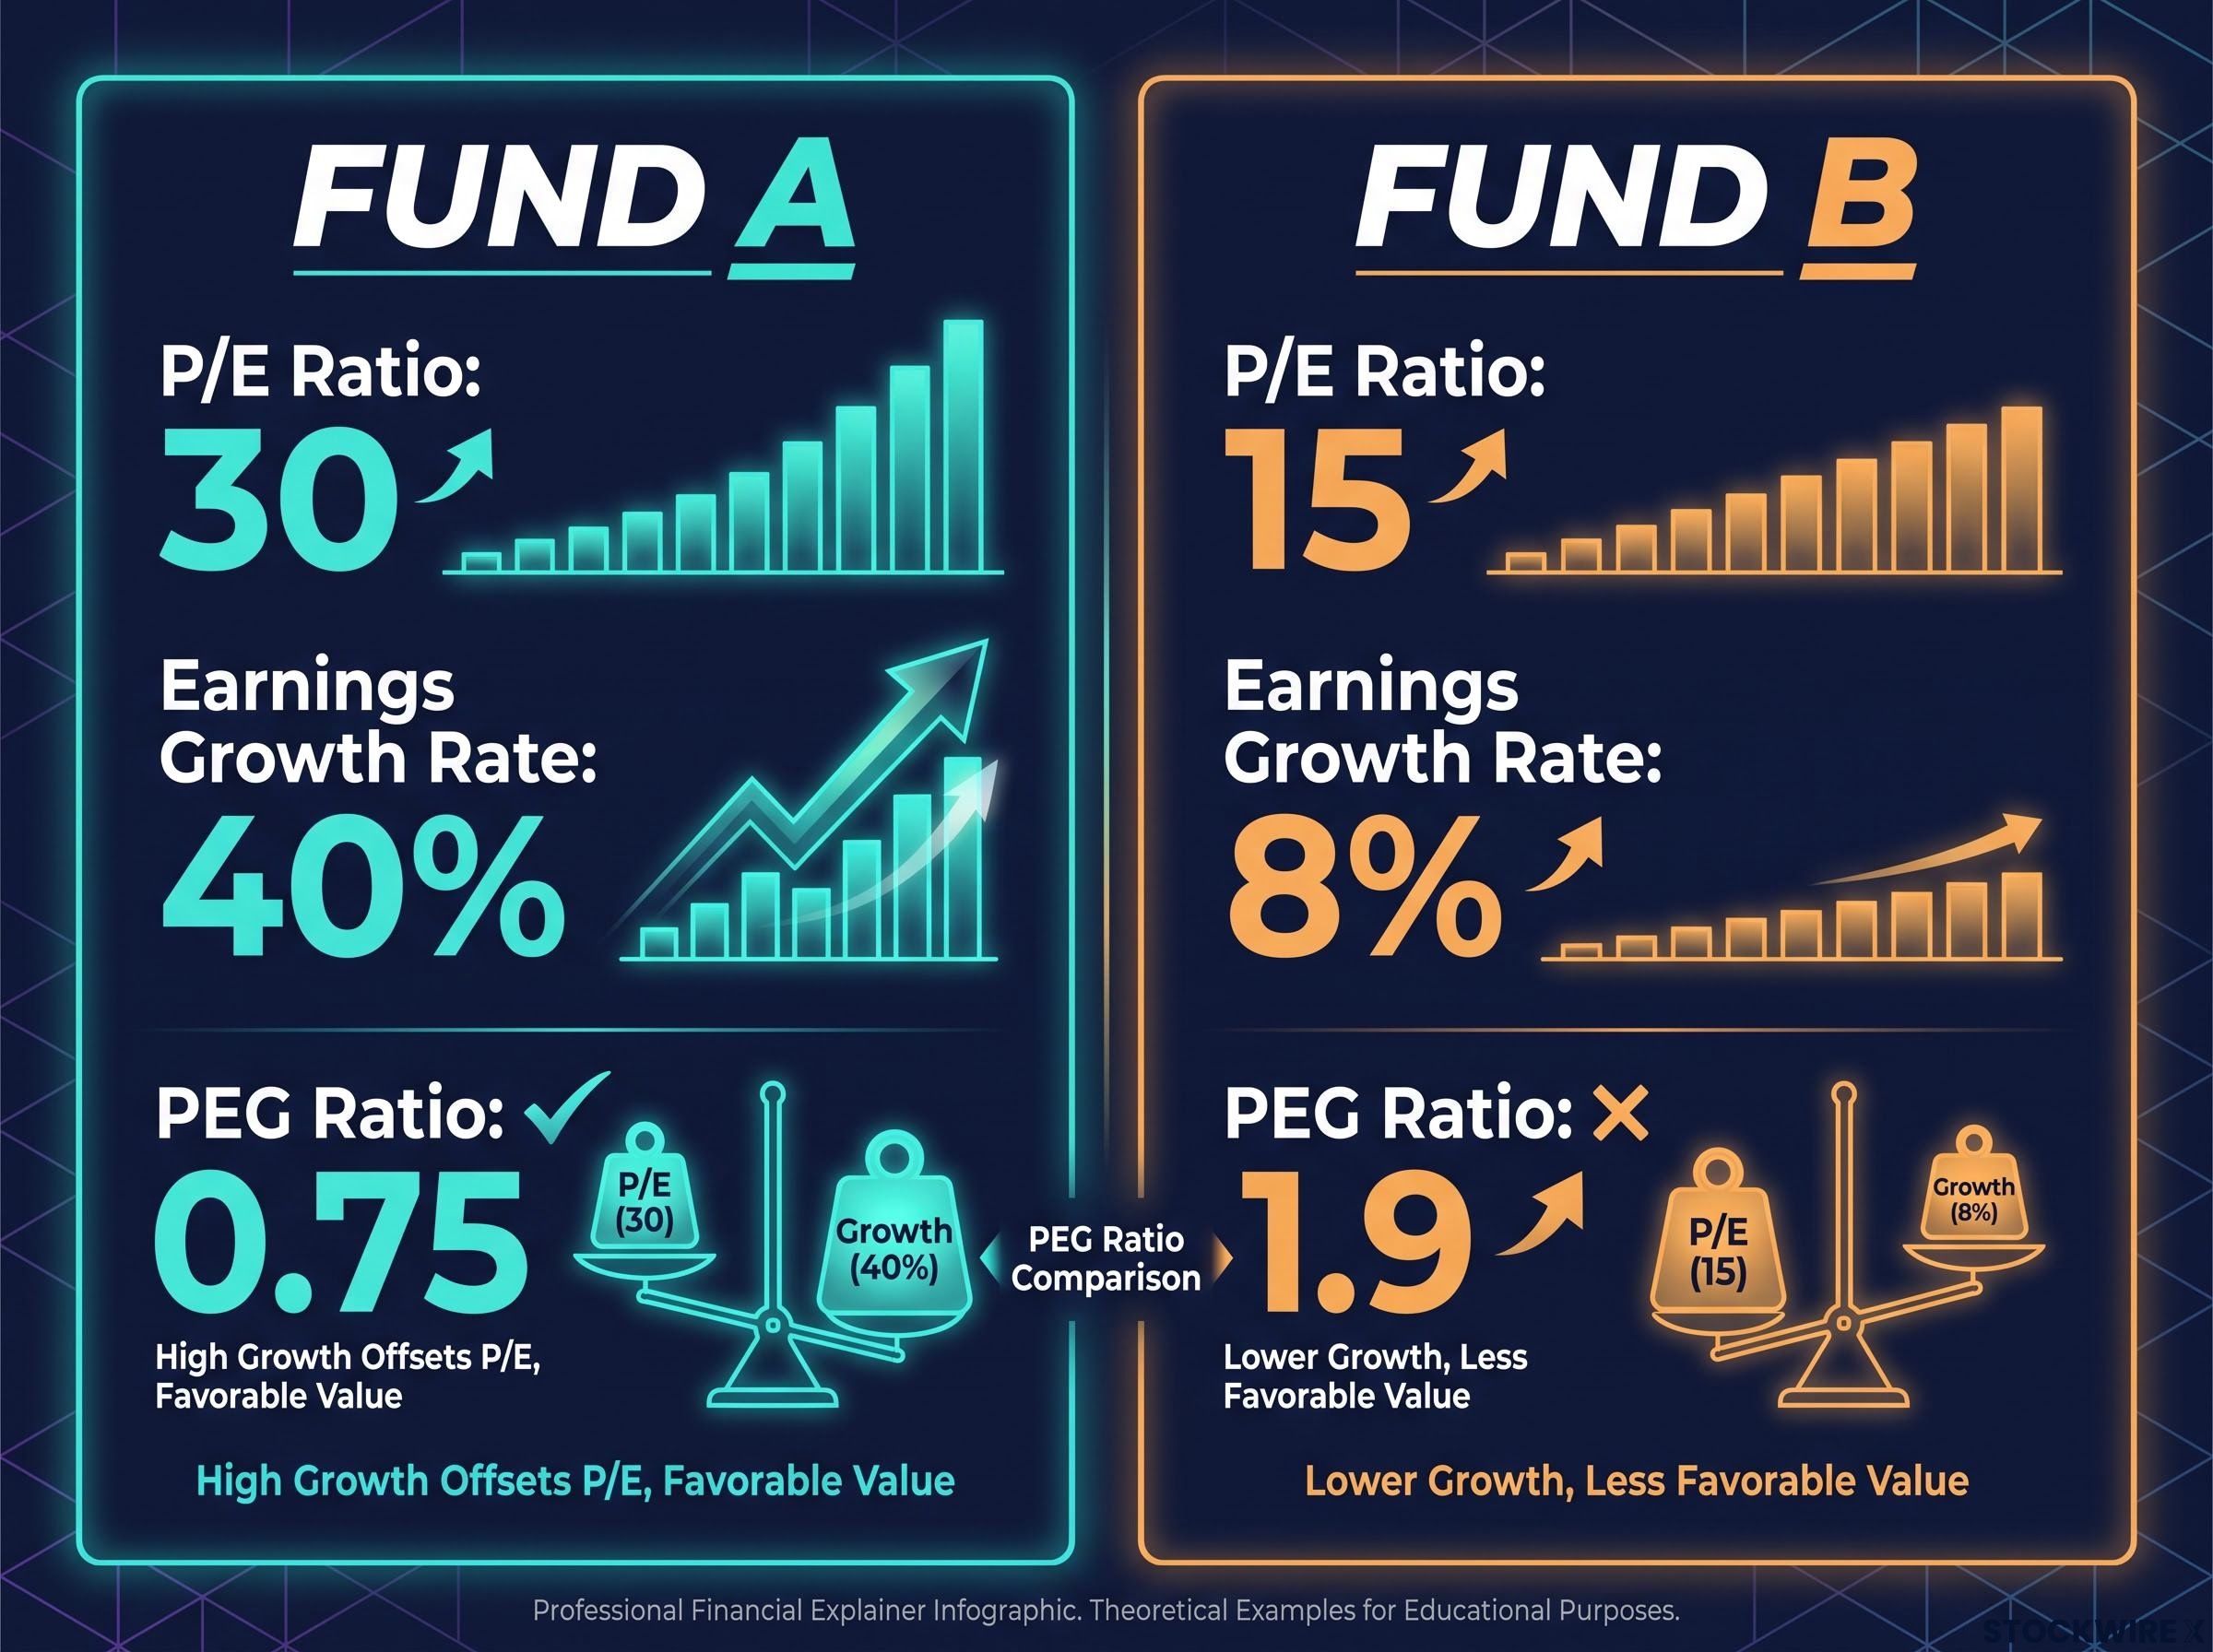
| Metric | Fund A | Fund B |
|---|---|---|
| P/E Ratio | 30 | 15 |
| Earnings Growth Rate | 40% | 8% |
| PEG Ratio | 0.75 | 1.9 |
Fund A “looks expensive” at 30 times earnings, but its PEG of 0.75 tells you the price is actually modest relative to its growth rate. Fund B “looks cheap” at 15 times earnings, but its PEG of 1.9 reveals you are paying nearly twice as much per unit of growth. The apparently cheaper fund is the less attractive one on a growth-adjusted basis.
This is a tool you can apply to any fund you look up tonight. But it has a limitation: PEG works on a single growth-rate assumption. If that assumption is wrong, the ratio misleads. The deeper discipline is stress-testing the growth assumption itself, questioning whether consensus estimates are realistic, not just accepting them and dividing.
AI infrastructure ETFs in 2026: what the numbers actually say
The Global X AI Infrastructure ETF (AINF) offers a live case study. Its one-year total return sits at approximately 40%. Its Canadian peer, the Global X Artificial Intelligence Infrastructure Index ETF (MTRX), launched on 19 February 2025, has returned above 65% over one year.
The valuation picture requires a note of intellectual honesty. Sources conflict on AINF’s current P/E: approximately 25x from one data set, approximately 36x from another. Both figures sit materially above broad-equity benchmarks. If you are evaluating a position, verify the current figure directly with the fund provider or a live data source. That verification step is itself a demonstration of the discipline this framework teaches.
The underlying companies in AINF are projected to grow earnings at approximately 40-70% annually over coming years, a range that makes the elevated multiple potentially justifiable, but only if that growth actually arrives.
Regardless of which P/E figure you use, the evaluation comes down to three lenses:
- Growth versus multiple: If portfolio earnings grow at 40-70% annually for several years, a multiple in the 25-36x range can be reasonable against an S&P 500 priced for mid-teens growth. If growth settles toward mid-teens, that same multiple starts to look stretched.
- Structural versus cyclical demand: AI infrastructure demand is tied to a competitive imperative for enterprises, not short-term consumer sentiment, which supports more durable growth assumptions.
- Industry economics: If data centre, semiconductor, and power equipment providers maintain pricing power and scale-driven margin expansion, the gains flow to shareholders. If commoditisation strips that pricing power, headline growth does not translate into investor returns.
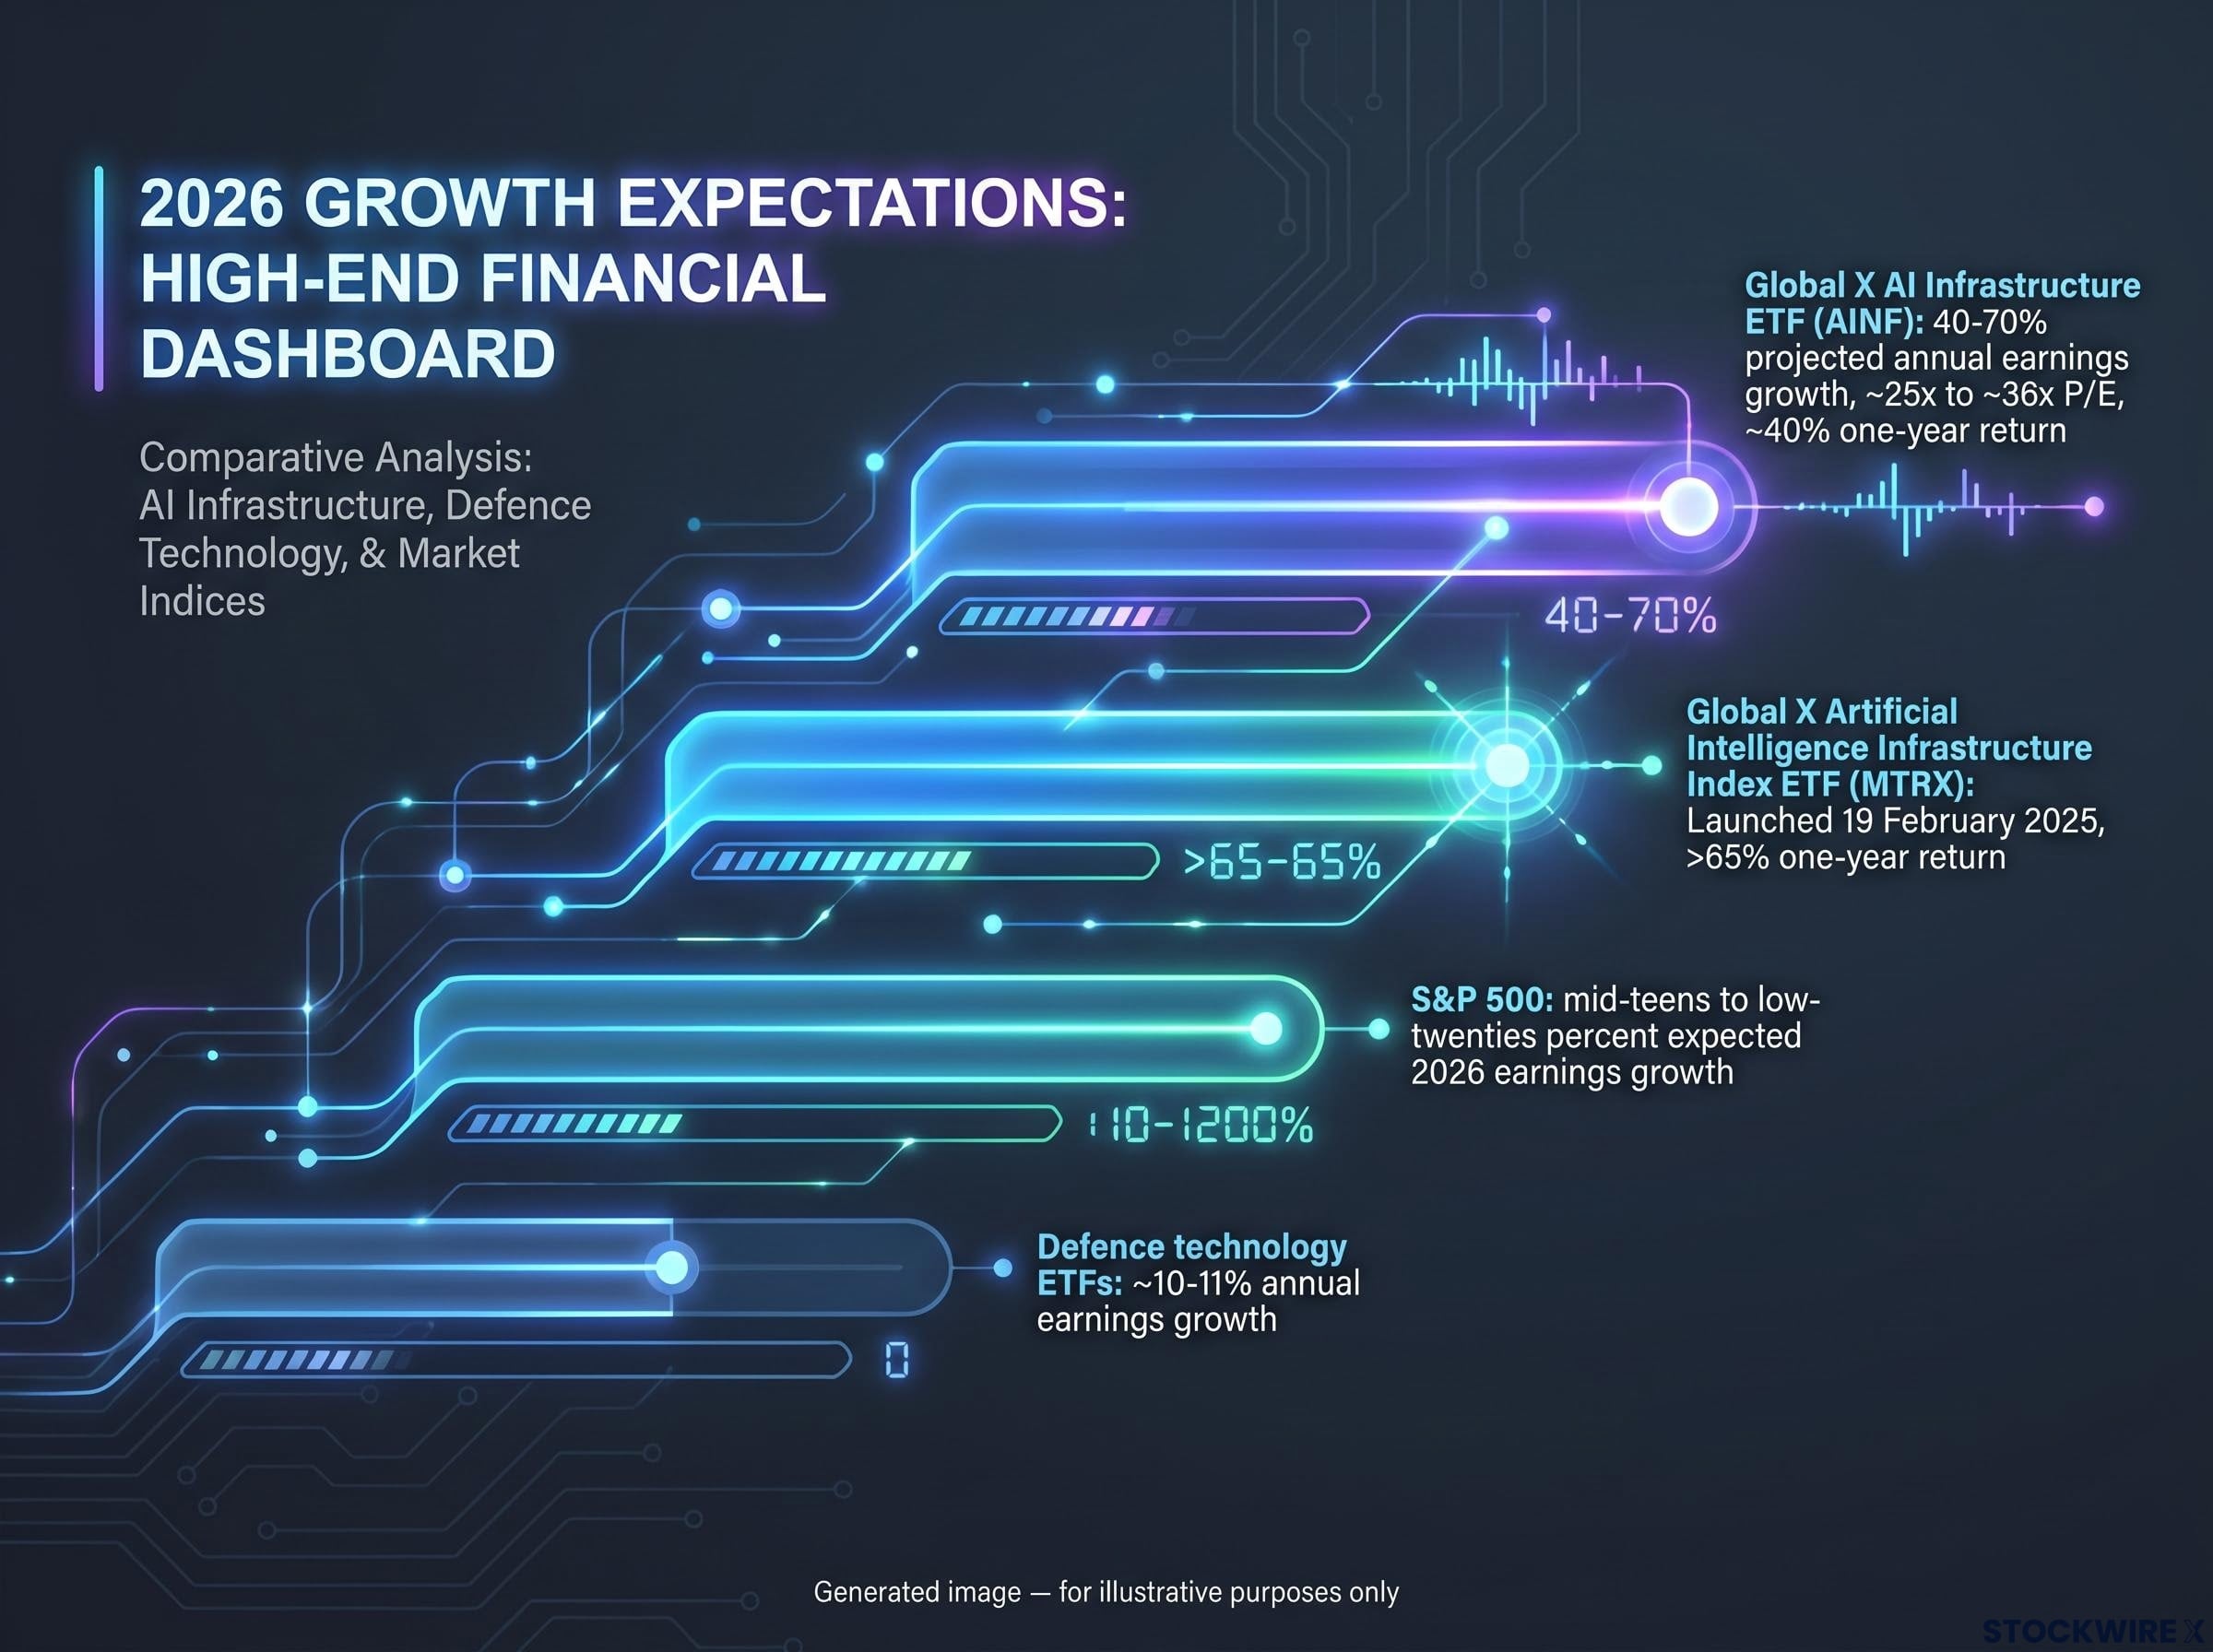
The premium in AINF’s valuation is not automatically a red flag. It is a bet that structural AI demand will translate into sustained earnings growth, and that suppliers will retain enough of that value to justify today’s prices. What matters is whether you are evaluating your return from today’s price, not last year’s.
Structural versus cyclical: the question that changes your time horizon
Not all themes behave the same way through economic cycles, and confusing the two types leads to the wrong holding period, the wrong entry discipline, and often the wrong outcome.
Structural themes represent one-off paradigm shifts driven by disruptive technology, demographics, regulation, or climate policy. They unfold over many years and tend to persist through recessions because the demand driver is embedded in how businesses operate, not in how consumers feel. Cloud computing is the clearest example: over roughly 15 years of widespread adoption, the sector experienced multiple economic cycles, yet enterprise migration to cloud infrastructure continued because the underlying need was deeply embedded in business operations, not tied to short-term sentiment. That kind of embedded necessity is what supports elevated growth assumptions and justifies patient capital.
Cyclical themes follow business-cycle swings and tend to mean-revert. When commodity and hydrogen ETFs produced gains exceeding 100% within 12-month periods, those surges reflected temporary demand conditions rather than durable structural shifts, which meant future returns could not simply repeat the pattern as prior gains had already absorbed much of the available upside.
The classification is not permanent. For most of their history, semiconductors behaved as a cyclical industry, moving in step with PC, smartphone, and laptop refresh cycles. Over roughly 15-18 years of closer analysis, however, a clear break in that pattern emerged: AI-related demand from data centres introduced a layer of incremental consumption that decoupled semiconductor growth from consumer electronics cycles, repositioning the sector as a structural rather than cyclical theme. You need to revisit the classification, not set it once and forget it.
| Attribute | Structural Theme | Cyclical Theme |
|---|---|---|
| Demand Driver | Technology adoption, demographics, regulation | Business-cycle swings, commodity prices |
| Typical Duration | Multi-year to multi-decade | Months to a few years |
| Mean-Reversion Risk | Low (demand embeds structurally) | High (gains pull forward) |
| Entry Discipline Required | Growth-adjusted valuation; longer horizon | Tight timing; shorter holding period |
To classify any theme you are evaluating, apply a two-step test:
- Identify the demand driver. Is it a structural shift in how businesses operate or compete, or is it a cyclical swing tied to rates, commodity prices, or sentiment?
- Assess whether that driver is competitively embedded (once adopted, rarely reversed) or economically cyclical (reverses when the cycle turns).
Your answer directly changes the holding period and entry discipline you should apply. Structural themes justify more tolerance for short-term multiple compression. Cyclical themes demand tighter entry timing.
Evaluating industry economics: where does the value go?
A theme can be correct, structurally durable, and growing rapidly, and still route all of its economic value away from shareholders. This is the filter most thematic investors skip, and it is the one that separates disciplined analysis from narrative enthusiasm.
The central question in evaluating industry economics is this: within a given theme, does economic value accumulate with the companies and flow through to shareholders, or does competition erode it and redirect the benefit toward end users instead?
Look at aviation as the cautionary example. Air travel reshaped how people and goods move around the world, and the industry sustained decades of volume growth, yet it proved persistently destructive to shareholder capital. Price competition among carriers was so relentless that most of the economic surplus ended up with passengers in the form of lower fares rather than with investors in the form of returns.
The EV sector tells a different story. Even as manufacturers reduced vehicle prices, a number of them managed to widen their profit margins, demonstrating that cost efficiencies were accruing to the business rather than being surrendered entirely to buyers. In those cases, value accrues to shareholders rather than being competed away.
Your evaluation of any thematic ETF needs to interrogate four indicators:
- Margin trajectory: Are margins expanding with scale, or compressing under competitive pressure?
- Pricing power durability: Can companies maintain pricing, or are customers gaining leverage?
- Competitive concentration: Is the industry oligopolistic at key points, or fragmented enough for commoditisation?
- Customer-versus-shareholder benefit split: Is the economic value of the theme flowing to shareholders, or to end users through lower prices?
Applying the economics test to AI infrastructure
For AI infrastructure specifically, the current picture is mixed but tilted positive. Leading semiconductor names are expanding margins at scale. Pricing power remains strong, supported by concentrated supply of advanced chips and intense demand from data centre operators. At the leading-edge chip level, the competitive structure is oligopolistic, though power and cooling segments are more fragmented.
The split is currently tilted toward shareholders. But you should watch for the commoditisation inflection point: as compute costs decline and more competitors enter the supply chain, the balance could shift. That is not a reason to avoid the theme. It is a reason to monitor it actively.
A six-point checklist before committing to any high-flying thematic ETF
Every item below is a gate. If you cannot answer it affirmatively with specific evidence, you are speculating on narrative, not investing on analysis.
- Can you translate the multiple into a growth assumption? Estimate the portfolio’s forward earnings growth and compare the P/E to that growth via PEG ratio or scenario analysis. A satisfactory answer is a specific number you can defend, not a vague sense that “growth is strong.”
- How does that growth compare to the broad market? Benchmark against the S&P 500’s expected earnings growth (mid-teens to low-twenties percent for 2026). A higher multiple is only acceptable if growth is proportionally higher and the risk is compensated.
- Is the theme structural or cyclical? Structural themes justify longer horizons. Cyclical themes demand tighter entry discipline. A satisfactory answer names the specific demand driver and explains why it embeds or reverts.
- Do the industry economics favour shareholders? Margins expanding with scale, durable pricing power, and concentrated competition are positive signals. A satisfactory answer addresses margin trajectory and the customer-versus-shareholder value split.
- How much of the story is already in the price? After a 40-65% rally, treat the position as a completely new investment decision at today’s valuation, not a continuation of what past holders experienced. A satisfactory answer quantifies what return is available from here, not what the fund returned last year.
- Have you stress-tested failure scenarios? Slower adoption, regulatory constraints, or technological disruption can all throttle earnings. A satisfactory answer names two or three specific downside scenarios.
Use failure scenarios to calibrate position size, not to abandon a structurally sound theme. The discipline is sizing your exposure to match the range of outcomes you have identified, so that even a downside scenario does not produce a portfolio-level problem.
A disciplined thematic ETF portfolio treats theme-specific holdings as satellite positions, typically 5-10% of total allocation, sitting on top of a diversified core, and uses pre-defined exit rules written before any position is opened to separate analysis from emotional attachment.
This checklist connects back to the Cisco principle. The discipline is not avoiding high multiples. It is knowing precisely what growth the multiple requires and having specific evidence that the theme can deliver it.
What the valuation framework tells you about where AI infrastructure stands now
Applying the full framework to AI infrastructure in mid-2026 produces a considered verdict, not a hedge. The structural demand case is intact: enterprise AI adoption is a competitive imperative, not a discretionary spending category. Industry economics are currently tilted toward shareholders, with margin expansion at leading semiconductor and data centre names. The multiple, whether 25x or 36x, requires the 40-70% earnings growth range to be sustained for the premium to remain justified.
Against the S&P 500’s baseline of mid-teens to low-twenties percent earnings growth for 2026, that premium is legible. You are paying more per unit of earnings because the growth trajectory is meaningfully steeper. For comparison, defence technology ETFs imply earnings growth of approximately 10-11% annually, a moderate assumption that supports a smaller premium. Different structural themes require different calibration.
The conditions that would erode the AI infrastructure thesis are specific: earnings growth settling toward the mid-teens, commoditisation of compute stripping pricing power from suppliers, or regulatory intervention redistributing gains away from shareholders. None of those conditions are present today. All of them are plausible over a multi-year horizon.
Three variables to watch in upcoming reporting cycles
- Earnings growth delivery: Are portfolio companies actually hitting the 40-70% range, or is consensus beginning to drift toward mid-teens?
- Margin trajectory: Are leading semiconductor and data centre names expanding margins at scale, or is pricing pressure beginning to compress them?
- Compute commoditisation signals: Are enterprise customers reporting declining cost-per-unit for AI workloads at a pace that could erode supplier pricing power ahead of consensus expectations?
The Cisco lesson anchors everything. The theme can be correct and the investment can still disappoint. That is precisely why the framework exists: not to tell you whether to buy, but to ensure you know what growth you are betting on, whether the evidence supports it, and what would have to change to alter your conclusion.
For investors wanting to move from valuation analysis to actual allocation decisions, our dedicated guide to building a layered AI ETF portfolio covers the four-tier framework across the full AI value chain, including sizing logic and overlap management across positions.
This article is for informational purposes only and should not be considered financial advice. Investors should conduct their own research and consult with financial professionals before making investment decisions. Past performance does not guarantee future results. Financial projections are subject to market conditions and various risk factors.