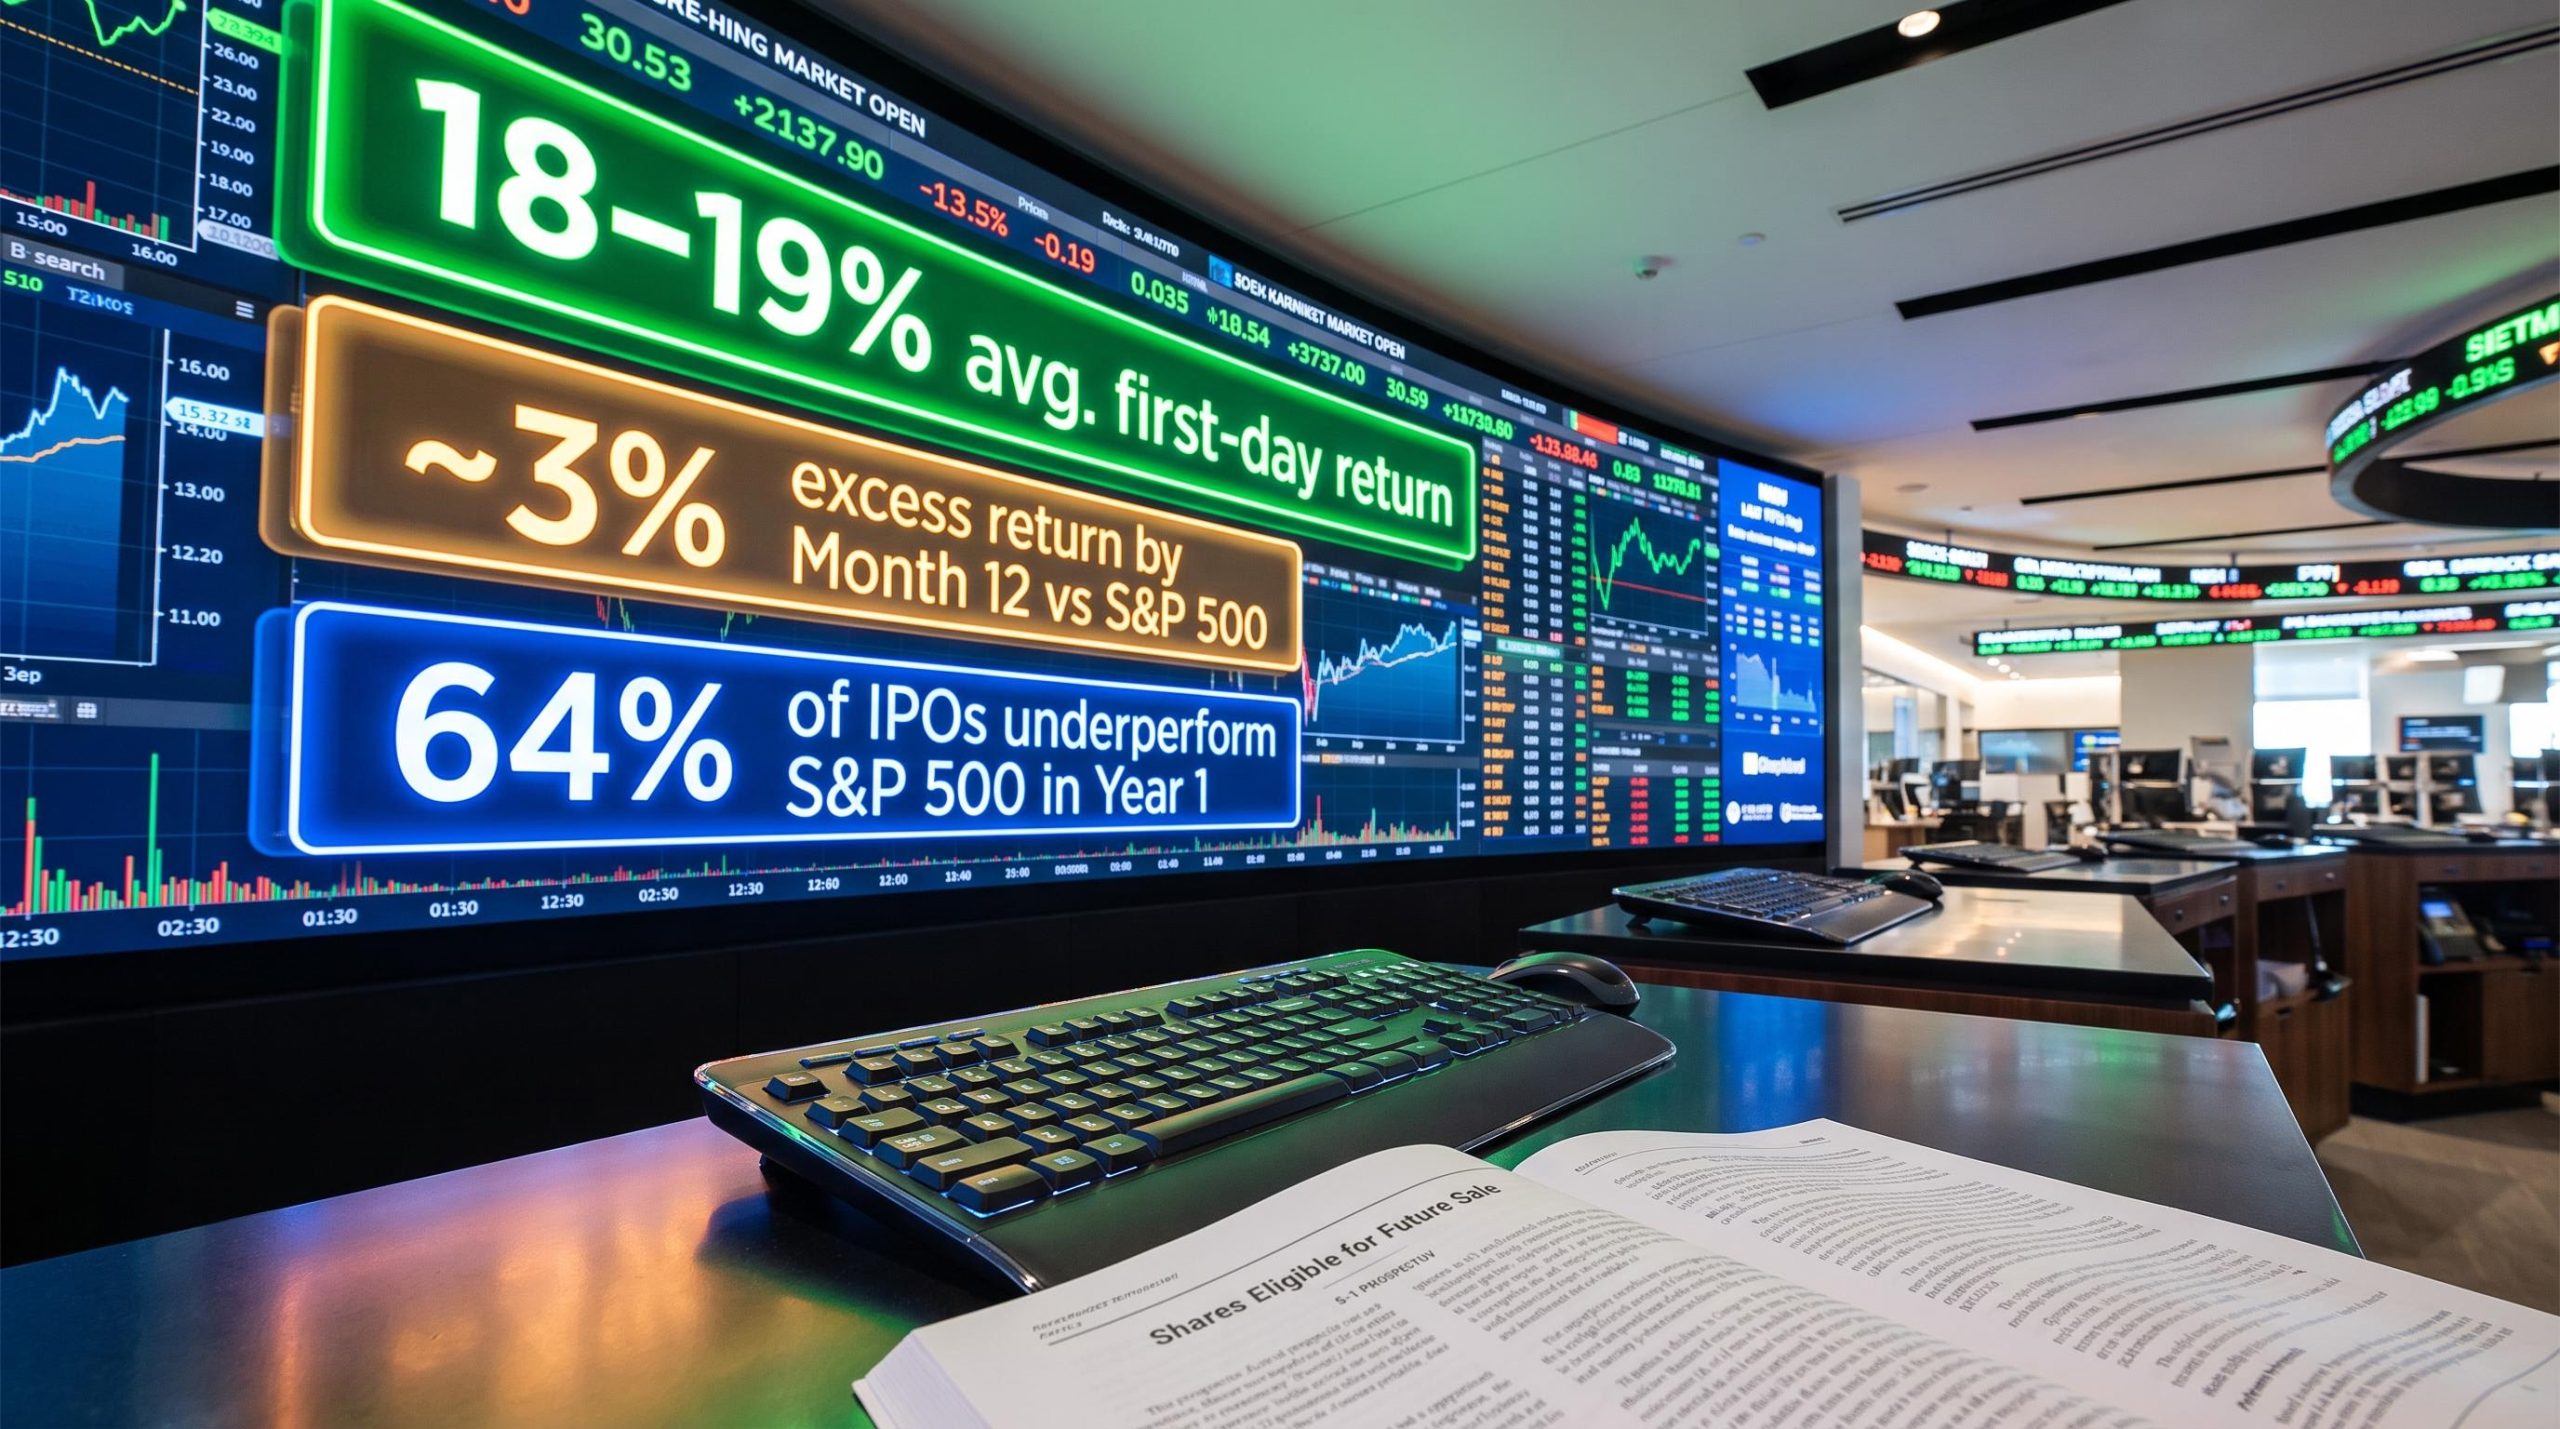
The average first-day return across roughly 9,343 US IPOs since 1980 is approximately 18-19%. That is the number everyone fixates on. Here is the number almost no one talks about: by month twelve, the average excess return over the S&P 500 shrinks to roughly 3%. The celebrated pop does not disappear in a crash. It bleeds out slowly, week by week, as the structural forces that created it reverse.
That tension sits at the centre of every US IPO trade. The early momentum is real, generated by deliberate underpricing, a constrained float, and intense media attention. But the forces that produce it are time-limited, and they systematically unwind on a schedule you can identify before you buy a single share.
Here is the specific playbook, from pre-listing preparation through to exit timing, including the one date every IPO trader needs to find before committing capital.
Why US IPOs pop on day one (and why underwriters want them to)
The first-day pop is not a happy accident. It is a feature of how US IPO deals are built.
Investment banks deliberately price new listings below where they expect the stock to trade once public. Jay Ritter’s long-running IPO database, covering roughly 9,343 US IPOs from 1980 to 2025, puts the average first-day return at approximately 18-19%. For large-cap listings specifically, that figure sits closer to 16%, reflecting more conservative pricing on bigger, lower-risk deals.
The IPO structural mechanics that consistently favour insiders over retail participants begin long before the first trade executes: institutions receive allocations at the offer price while retail buyers typically enter only after the first-day pop has already been captured.
Three structural drivers converge to create the pop:
- Deliberate underpricing. Underwriters set the offer price below expected market value so that institutional clients earn an easy first-day gain. The deal is perceived as a success, the bank’s reputation is reinforced, and clients come back for the next allocation.
- Constrained float. At listing, only 5-15% of total shares are typically freely tradable. The rest is locked up by insiders, employees, and early investors. That scarcity means modest incremental demand pushes prices sharply higher.
- Media-driven retail FOMO. High-profile listings attract intense coverage and social chatter. Retail buyers pile in, layering additional demand on top of an already supply-constrained market.
PwC’s 2026 US Capital Markets Watch reports that 97% of IPOs opened above their offer price, confirming that a first-day pop is the base case, not the exception.
That near-universality is the point. When the initial gain is engineered into the deal structure rather than driven by random enthusiasm, you can anticipate it and trade around it systematically, rather than simply reacting to headlines.
When big ASX news breaks, our subscribers know first
The momentum window: why weeks one to four are the optimal trade
Picture the first day of trading. The stock opens above its offer price. Volume is enormous. Institutional investors who did not receive their full allocation are buying in the open market. Retail traders are chasing the name they have been reading about for weeks. The constrained float amplifies every order.
This is where the upside concentrates.
Through week one and into week four, the same forces that created the first-day pop continue working: the float remains tight, catch-up buying persists, and the IPO narrative has not yet been tested by quarterly earnings. Then, gradually, each of those supports begins to erode.
| Interval | Average IPO Return | Key Structural Driver | What This Means for the Trade |
|---|---|---|---|
| Day 1 | ~18-19% | Underpricing + constrained float + FOMO demand | Peak momentum; all structural supports active |
| Week 4 | Fading; median hyped IPO ~-7.5% from first open | Catch-up buying thinning; narrative untested | Window closing; active exit management required |
| Month 6 | Majority below first-day highs | Lock-up expiration approaching; supply expanding | Structural headwinds now dominant |
| Month 12 | ~3% excess return vs S&P 500 | Valuation compression + insider selling + analyst normalisation | 64% of IPOs underperformed the S&P 500 |
A study of 20 of the most hyped US IPOs since 1995 found the median stock was down approximately -7.5% from its first open price within one month. Even the most celebrated names frequently punish buyers who entered on day one and held passively, which makes active exit management a necessity rather than an option.
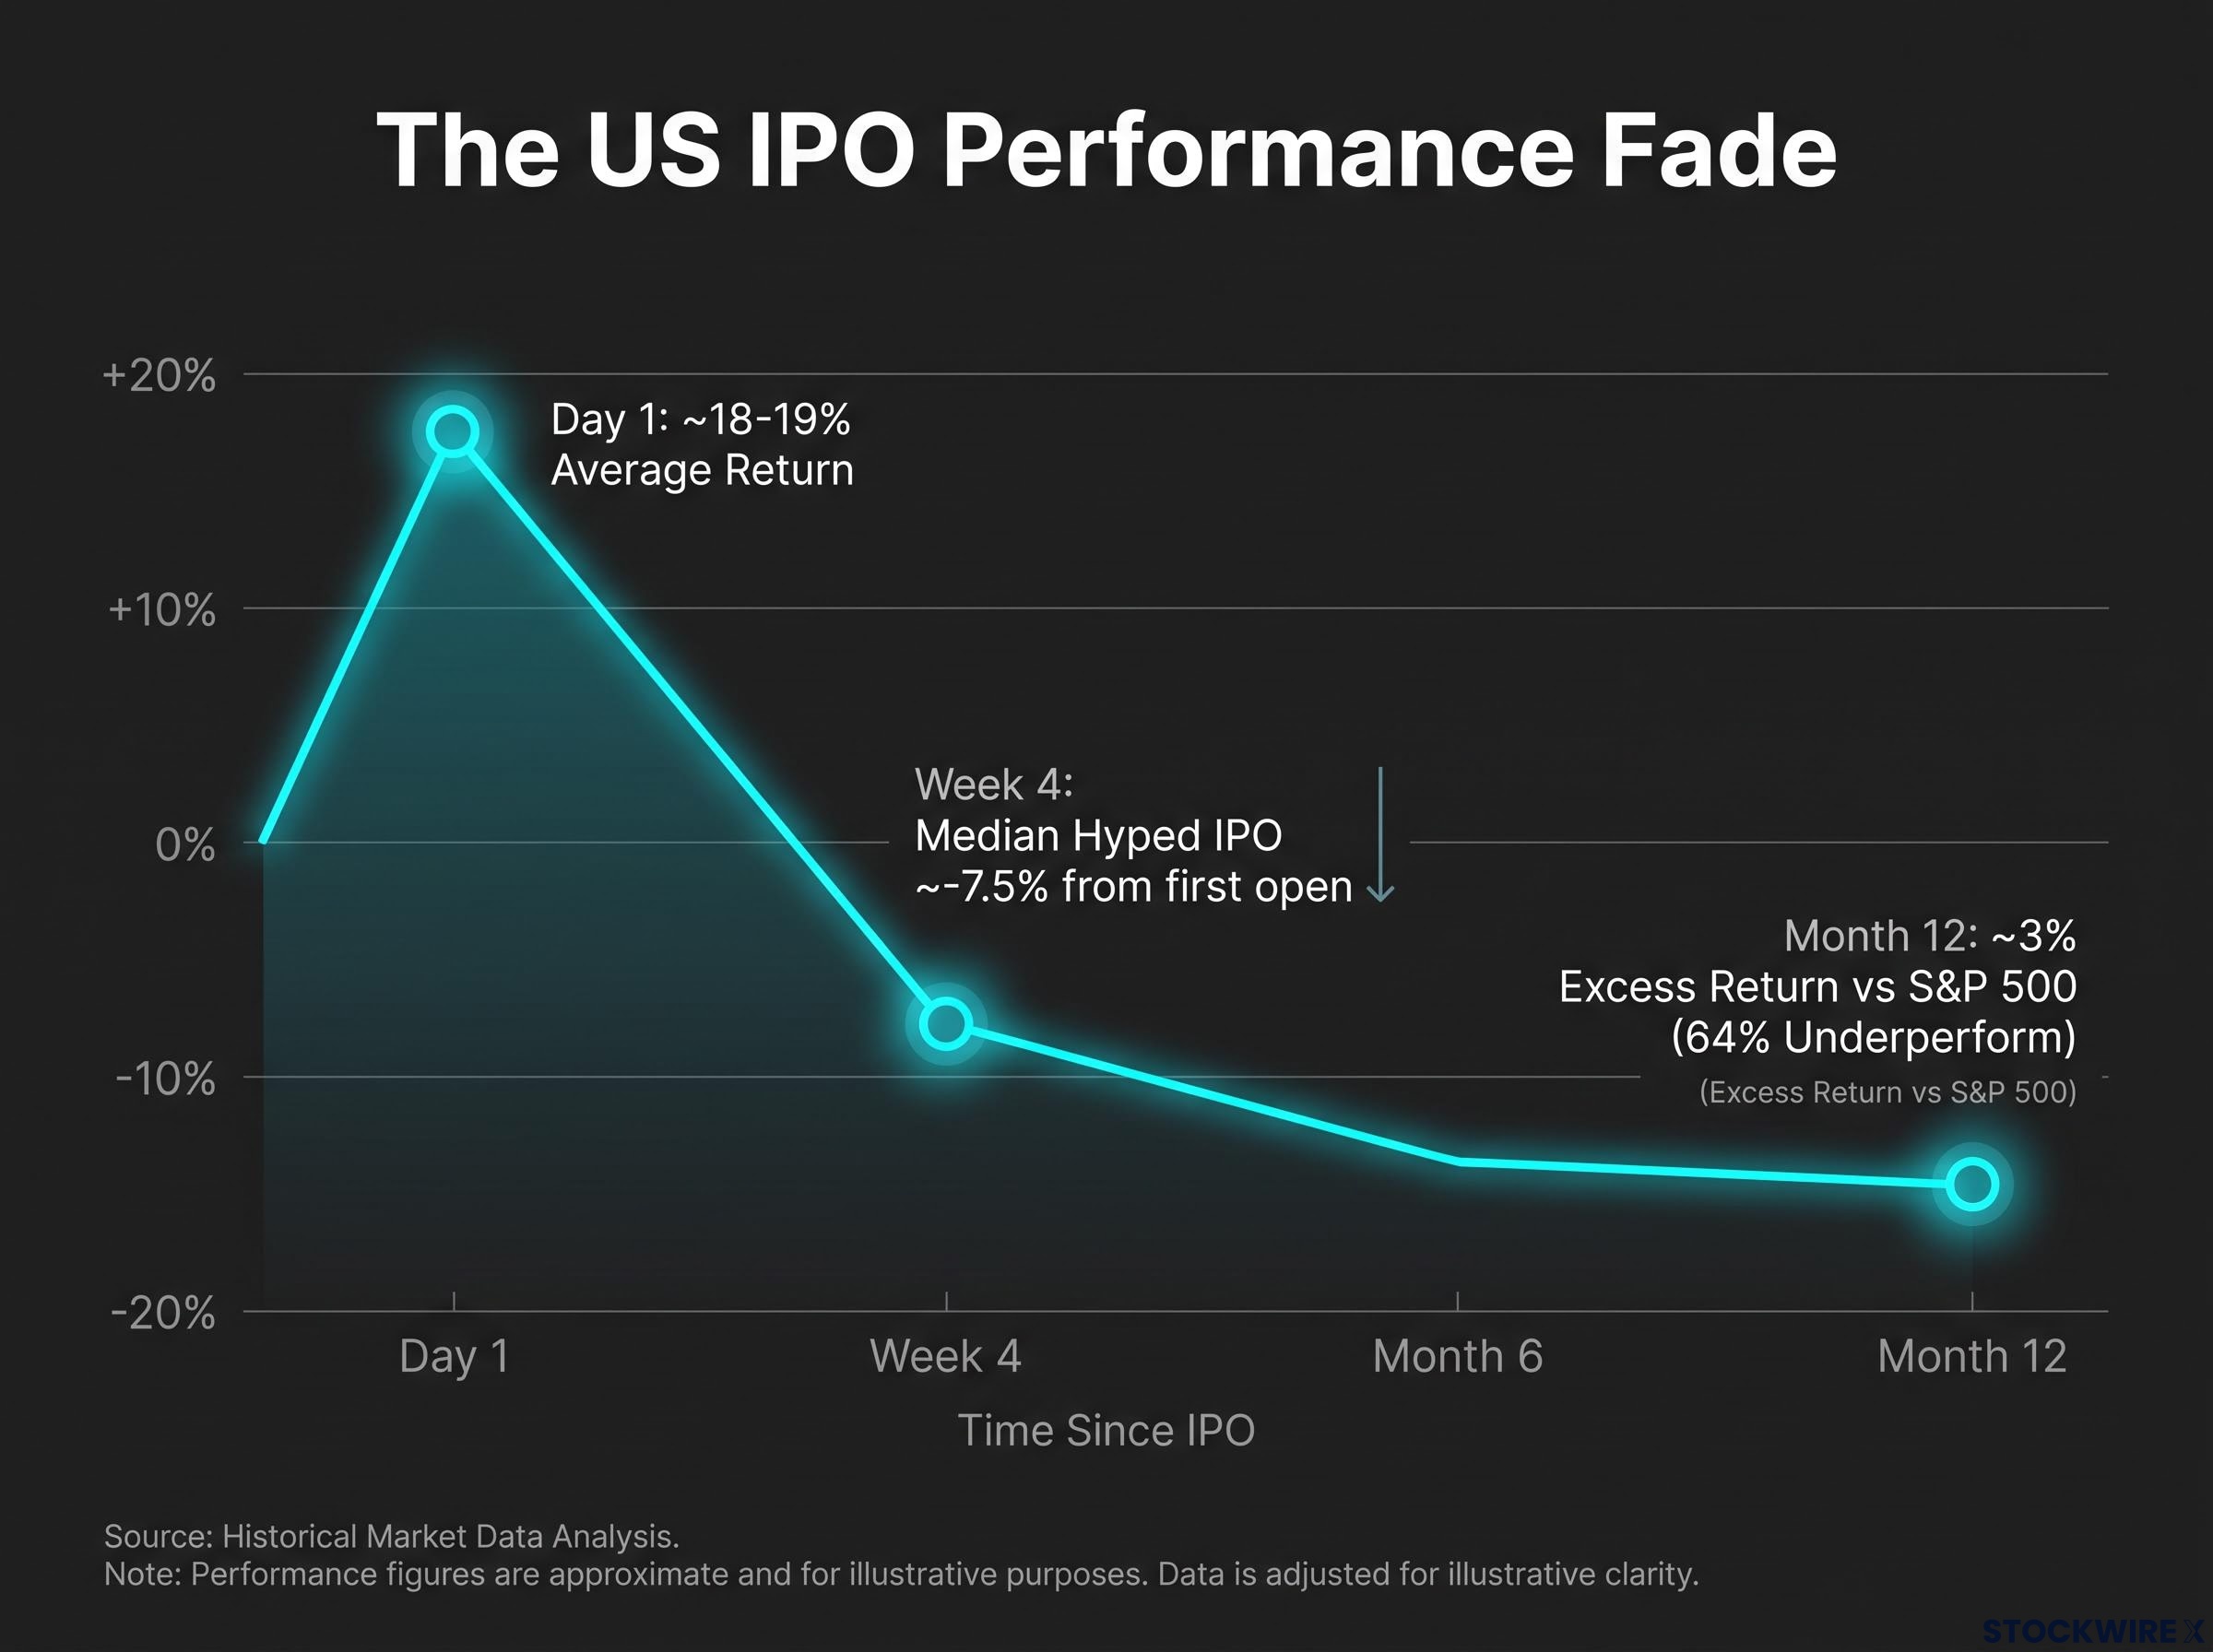
The momentum window is not a theory. It is a pattern confirmed across multiple datasets. Most retail participants do the opposite of what the data suggests: they wait for confirmation of quality and buy after the window has already started closing.
What lock-up expiration is and why it is the most important date in your trade
A lock-up agreement is a contractual restriction that prevents insiders, employees, and pre-IPO investors from selling their shares for a set period after listing. In standard US practice, lock-ups run for 90-180 days, and the specific terms are disclosed in the company’s S-1 or F-1 prospectus filed with the Securities and Exchange Commission (SEC), the US federal agency that oversees public markets.
Here is what matters about that restriction: while it is in place, the freely tradable float sits at just 5-15% of total shares. When it expires, that float can multiply several times over. Founders, venture capital backers, and employees suddenly have both the ability and the financial incentive to sell, particularly if the stock remains above its offer price.
This is a supply shock with a date printed on it.
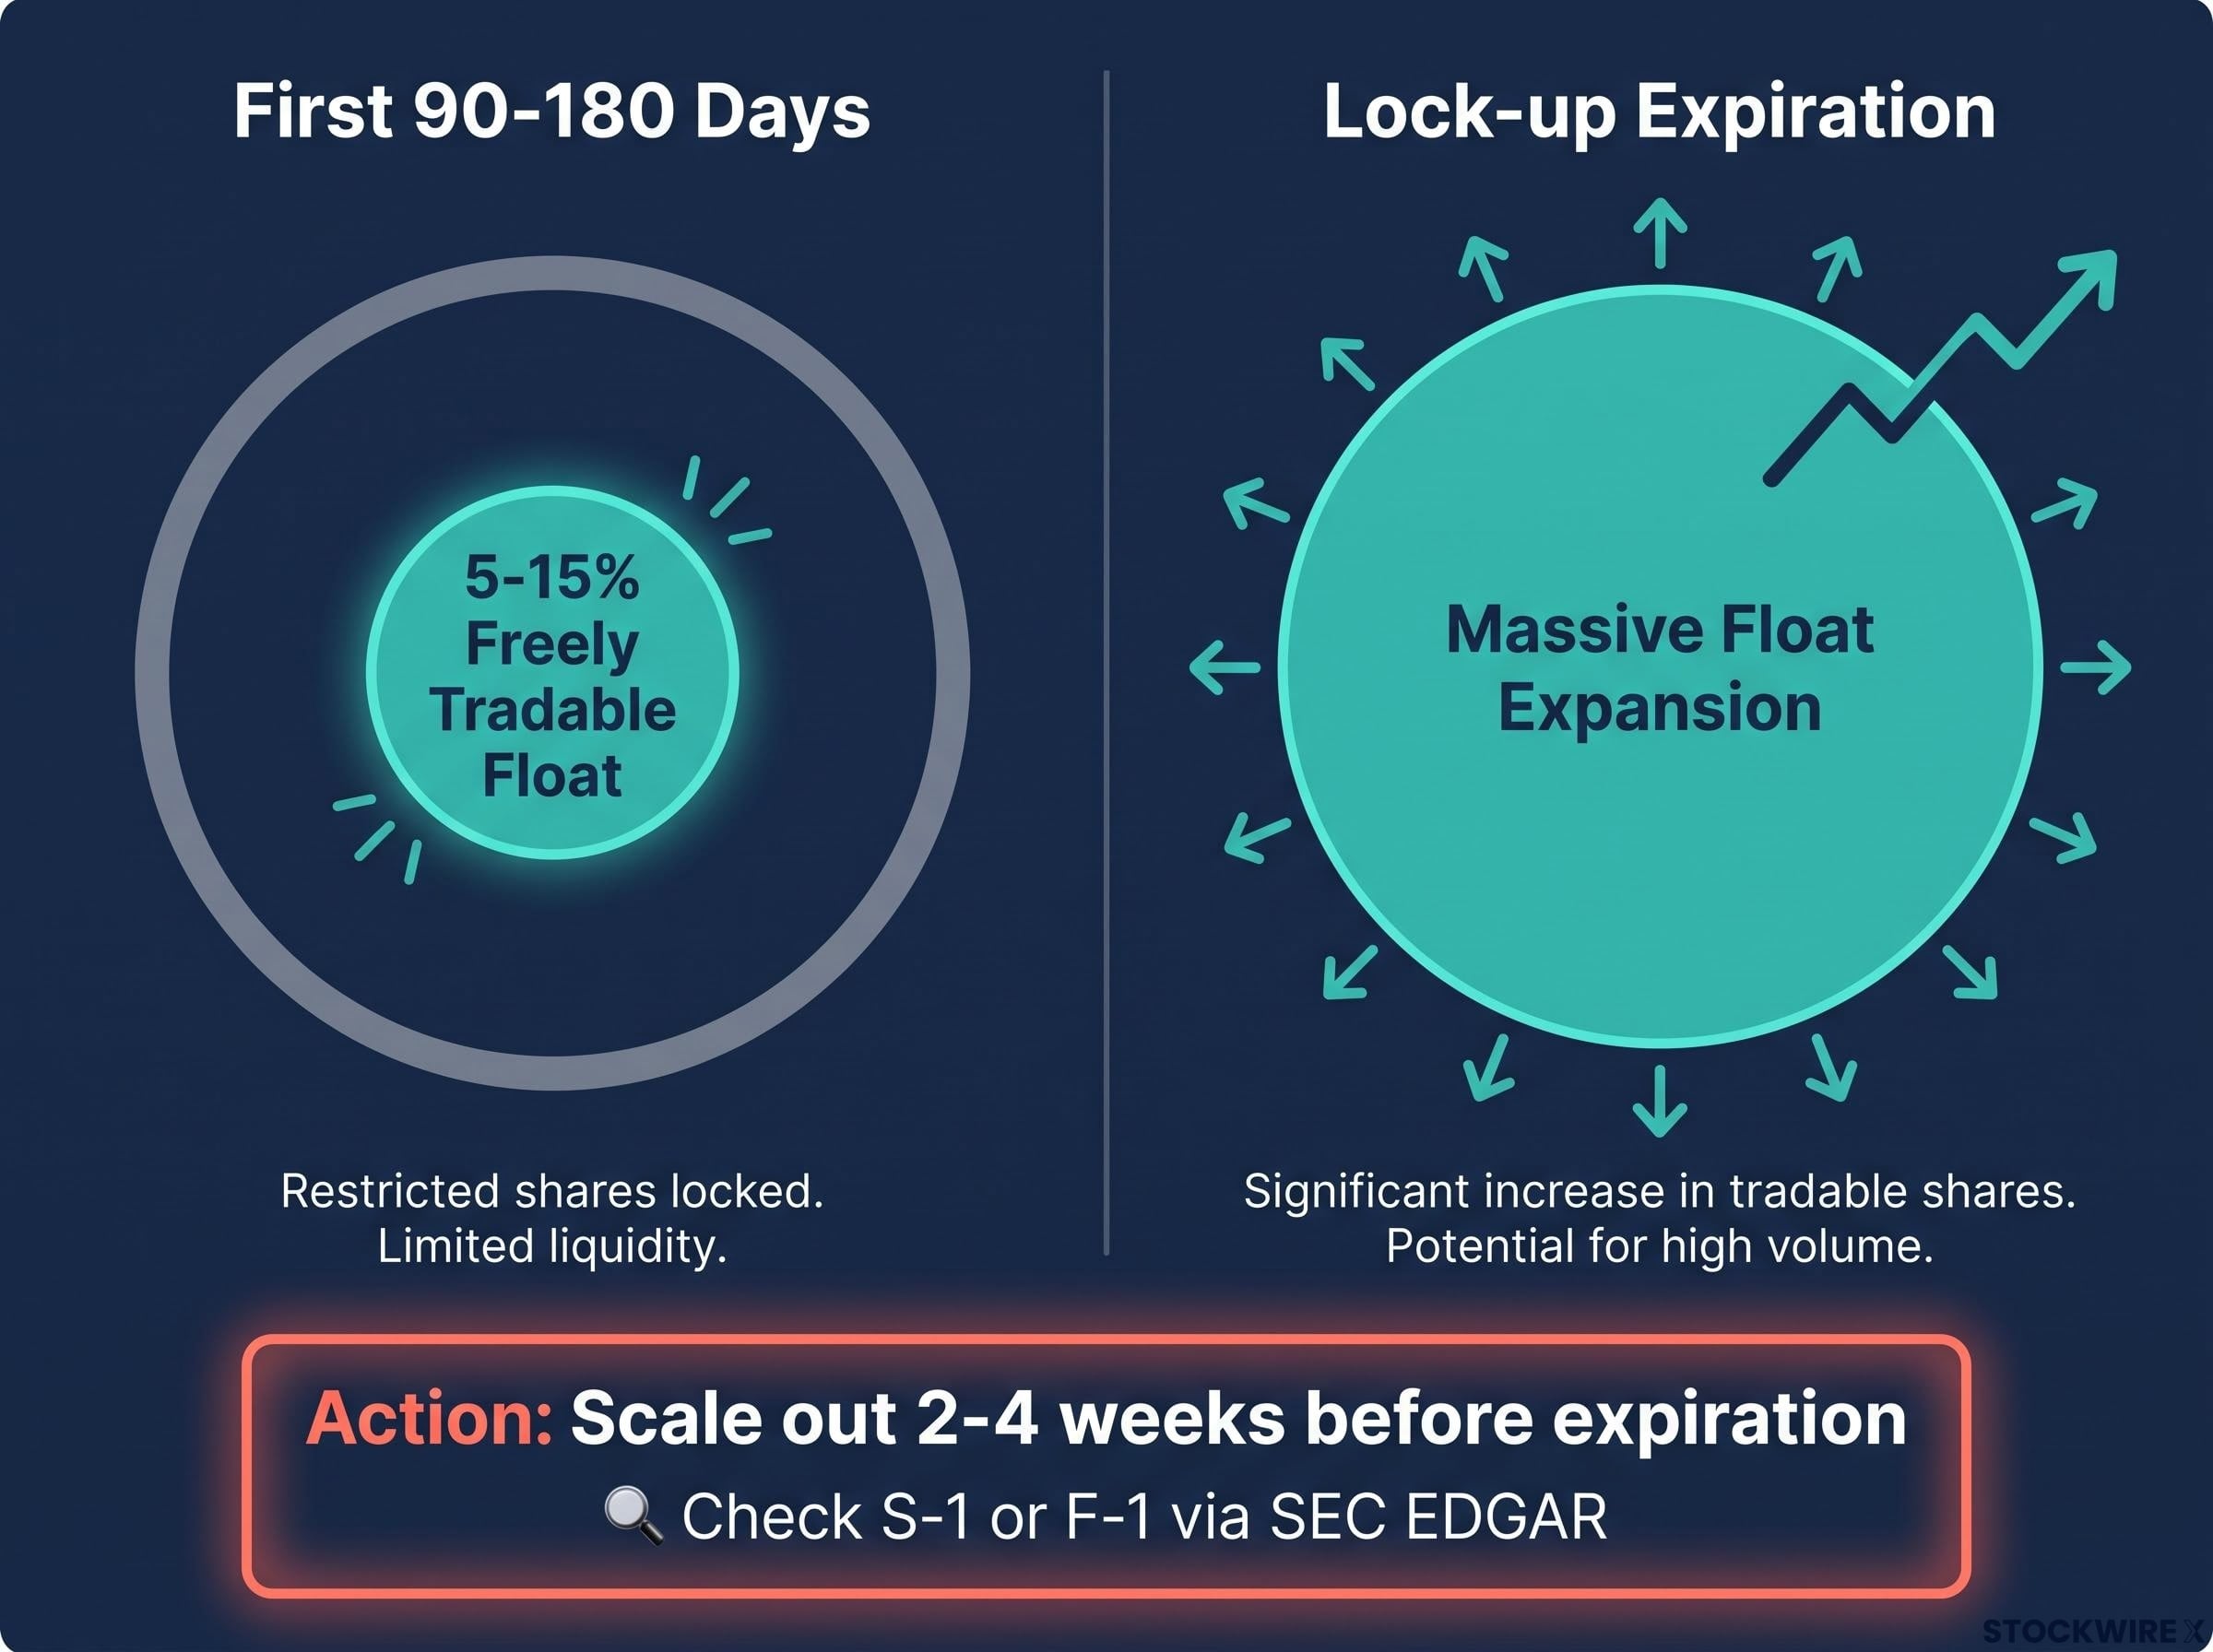
The exit is calendar-driven, not price-action-driven. By the time insider selling is visible in price and volume data, a meaningful portion of the damage is typically already done.
How to find the lock-up date and build your exit backwards from it
The lock-up terms are disclosed in the prospectus, which you can access through SEC EDGAR (the commission’s free electronic filing system). Search for the company’s S-1 or F-1 filing and look for the section titled “Shares Eligible for Future Sale” or similar language.
Once you have the date, building your exit is a three-step process:
- Identify the lock-up expiration date from the prospectus before entering the trade. Some IPOs have staggered or tiered schedules with multiple expiration dates for different insider categories; treat the earliest major expiration as your primary signal.
- Treat that date as a hard deadline for any momentum-style position. This is not a “watch and decide” event. It is the structural endpoint of the scarcity premium you are trading.
- Begin scaling out 2-4 weeks before expiration. Do not wait for price action to confirm what the calendar already tells you.
Staggered lock-up schedules complicate the calendar-driven exit framework: when a single IPO carries roughly a dozen distinct unlock events, each tied to earnings milestones or performance triggers, the earliest major expiration may arrive well before the standard 180-day cliff that most traders monitor.
The maths of float expansion from 5-15% to a full public float tells you exactly why waiting to “see what happens” at lock-up is not a neutral stance. It is a bet against a near-certain increase in selling pressure.
The five-step pre-trade checklist every IPO trader should run
Before the next high-profile listing, run this sequence. Each step corresponds to one of the structural forces that determines whether the momentum window is accessible or already compromised.
- Review the prospectus. The S-1 or F-1 filing contains four things you need before doing anything else:
- Lock-up terms and expiration date
- Insider ownership versus planned public float
- Use of proceeds (is the capital funding growth or paying off early investors?)
- Key disclosed risk factors
- Assess valuation against listed peers. If the IPO prices at a substantial premium to comparable public companies, the risk of later multiple compression is elevated. This single check directly predicts the severity of first-year price erosion: an IPO that prices far above its peers has further to fall when quarterly results arrive and enthusiasm normalises.
- Evaluate narrative quality. Strong, tangible drivers, such as market leadership, clear revenue growth, or secular tailwinds, can support a more aggressive momentum trade. Pure story IPOs with limited near-term earnings visibility call for smaller exposure and stricter exits. Not every compelling company is a compelling trade at its IPO price.
IPO deal construction quality, including valuation relative to peers, investor base composition, and the conservatism of initial guidance, determines aftermarket return profiles largely independently of how well the underlying business actually performs in its first year of public trading.
- Size your position. IPO trades are inherently volatile and path-dependent. Size modestly relative to your total portfolio. Decide upfront that this is a trade, not a long-term core holding, unless subsequent evidence justifies reclassifying it.
- Choose your entry timing. Day one captures the full first-day pop (averaging high-teens for all US IPOs, approximately 16% for large-cap listings) but faces wide bid-ask spreads and intense intraday volatility. Days two to five sacrifice some upside for cleaner price action and tighter execution. Neither approach is universally superior; the choice depends on your risk tolerance and execution capability.
Why the first year is a value trap for most IPO investors
The data accumulates in one direction.
64% of IPOs underperformed the S&P 500 in their first year, according to a 2024-2026 first-year tracker. The average first-day gain of roughly 18-19% fades to approximately 3% excess return by month twelve.
Research on a sample of 136 one-year IPO returns found that only 44% beat the S&P 500, while the losers averaged nearly -30%, according to IPO tracker data. That asymmetry is the quiet part of the IPO narrative: the winners barely outpace the index, and the losers punish you severely. The risk-reward of a first-year hold is skewed against you in a way that patience and conviction cannot fix.
Long-term IPO underperformance compounds the problem further: a 3.3% annual drag over five years turns a $10,000 position into roughly $12,577 rather than $14,693, a gap that accumulates silently while the investor holds and waits for fundamentals to catch up to the debut price.
64% of IPOs underperformed the S&P 500 in their first year, and the average first-day gain of ~18-19% faded to roughly 3% excess return by month twelve.
Four mechanical forces drive this erosion:
- Valuation compression. IPOs often list at premium multiples. As quarterly results arrive, those multiples compress toward peer levels when growth or profitability proves less exceptional than the pre-listing narrative implied.
- Earnings visibility shock. Public reporting surfaces slowing growth, higher costs, or margin pressures that were obscured in the IPO roadshow, the pre-listing presentation used to generate investor demand.
- Ongoing insider and sponsor selling. After the primary lock-up expires, additional tranches unlock. Scheduled selling plans (known as 10b5-1 plans) steadily add supply to the market.
- Analyst estimate normalisation. Initial sell-side coverage is systematically optimistic. Over the first year, estimates and price targets are revised toward realistic levels, removing a structural source of upward price support.
The psychological trap is worth naming directly: a stock down 20-30% from its first-month high is not automatically cheap. It may simply be reverting toward fundamental fair value from an over-enthusiastic debut price. The most common way to lose IPO profits is not missing the entry. It is staying in after the structural supports have disappeared and reclassifying what was a trade into an investment without a new thesis to justify it.
This article is for informational purposes only and should not be considered financial advice. Investors should conduct their own research and consult with financial professionals before making investment decisions. Past performance does not guarantee future results.
Five mistakes that turn IPO gains into losses
Each of these mistakes corresponds to a specific structural force covered earlier in this guide. They are listed in order of the damage they typically cause.
- Confusing a great company with a great IPO trade. Numerous strong businesses have delivered poor returns to investors who held 6-12 months simply because those investors paid peak-sentiment prices and remained invested through lock-up expiration and valuation normalisation. Company quality and trade quality are separate questions.
- Skipping the prospectus. Lock-up terms, insider share concentrations, and material risk factors are disclosed in plain sight in the S-1 or F-1. If you trade without reading those disclosures, you are missing the most structurally important information available to you.
- Anchoring to the first-day or first-week high. If the stock peaks early and drifts lower, the instinct is to hold because selling feels like “locking in a loss from the top.” This anchoring behaviour leads directly into the structurally adverse phases of the IPO lifecycle.
- Waiting for visible insider selling before exiting. By the time insider selling is apparent in price and volume data, the damage is typically already underway. A calendar-driven exit before lock-up is structurally superior to a reactive exit based on observed price pain.
Why averaging down into lock-up is the compounding error
- Averaging down into lock-up expiration. This mistake is not merely bad. It is compounding. You are increasing your position size precisely as the market is about to see a step-change increase in shares available for sale. The float expansion mechanics covered earlier in this guide explain why: an investor adding to a falling IPO immediately before the freely tradable share count multiplies is concentrating risk into the worst phase of the cycle. The losses are amplified at exactly the wrong moment.
The mistake of equating company quality with trade quality is the most expensive one on this list, because it is the only mistake that feels virtuous as it is being made.
What to do after exiting and when (if ever) to re-enter
Once you have exited an IPO position, the most important discipline is the clean break. Resist anchoring to your original entry price or the IPO offer price. That trade is complete.
A stock down 20-30% from its first-month high is not automatically a bargain. It may simply be reverting toward fair value from an over-enthusiastic debut. Treating a former IPO as “cheap” purely because you remember what it traded at on day one is familiarity bias, not analysis.
Re-entry conditions: a three-part test
Before re-engaging with meaningful position size, all three conditions should be met simultaneously:
- Fresh fundamental thesis supported by post-IPO public financials. Quarterly reports now exist. Use them. The roadshow narrative is no longer sufficient.
- Valuation no longer at a premium to comparable peers. Run the same peer comparison from the pre-trade checklist, but with updated numbers.
- Evidence that the major lock-up supply overhang has been absorbed. Look for 10b5-1 plan activity tapering or the float stabilising after the primary and any secondary lock-up expirations.
If you re-enter, treat the stock as any other equity in the market. Apply the same valuation discipline and risk management you would to any comparable public company. The IPO label no longer provides meaningful structural context.
Capturing the window without getting trapped in it
The framework fits in four sentences. The first-day pop is structural and exploitable, created by deliberate underpricing, constrained float, and concentrated demand. The momentum window runs from roughly week one to month one, after which the odds shift against you. The lock-up expiration is a hard exit signal to plan around before entering, not a date to monitor reactively. And the first year is, for the majority of IPOs, a value trap that turns early gains into losses through valuation compression, insider selling, and analyst normalisation.
Your action sequence is defined: run the pre-trade checklist, enter in the first week, manage the trade actively, exit 2-4 weeks before lock-up, and re-engage only on updated fundamentals that meet all three conditions of the re-entry test.
The mindset shift is straightforward. IPO trading is a defined, time-bounded momentum exercise. Treating it as a long-term investment in a company you admire is where most retail participants lose the gains the structure itself created for them.
The average first-day return across US IPOs is approximately 18-19%. By month twelve, the average excess return over the S&P 500 is roughly 3%. That single fade captures the entire argument.