Bearish traders sitting on SpaceX stock have accumulated an estimated $15.5 billion in unrealised paper profits since the company’s mid-June IPO, and as of 22 July 2026, they are still not covering. That is not a typo, and it is not normal behaviour. When a short book this size stays open after gains of that magnitude, something more than profit-taking logic is at work.
SpaceX listed on the Nasdaq under the ticker SPCX in mid-June at $135 per share, raising roughly $75 billion in one of the largest IPOs in history. The stock subsequently traded below that price, and rather than fading, short interest intensified to a level that now ranks SPCX among the most shorted large-cap stocks in the market. This is not a fringe bet. It is a $25 billion notional position held by professional participants who absorbed losses before the payoff arrived.
Here is what the size and behaviour of this short position tells you about where SPCX volatility is likely to come from next, and why extreme short interest is a structural signal about the magnitude of potential moves, not a simple directional verdict.
How $15.5 billion in paper profits built up in six weeks
The short-side profit story did not begin with a clean win. In early July, aggregate short positions in SPCX had flipped to a mark-to-market loss of roughly $760 million, according to Ortex Technologies. The stock was trading around its IPO price, and the bears were underwater.
Then shares resumed their decline. Ortex data placed short-side paper profits at $8.7 billion as of 16 July 2026, a figure that climbed to $15.5 billion by 22 July as the stock continued its slide, with Peter Hillerberg, co-founder of Ortex Technologies, relaying the data to Reuters and noting that bears had kept adding to positions rather than taking profits.
In roughly six trading days, the aggregate short-side paper gain advanced from $8.7 billion to $15.5 billion, as the stock continued to weaken.
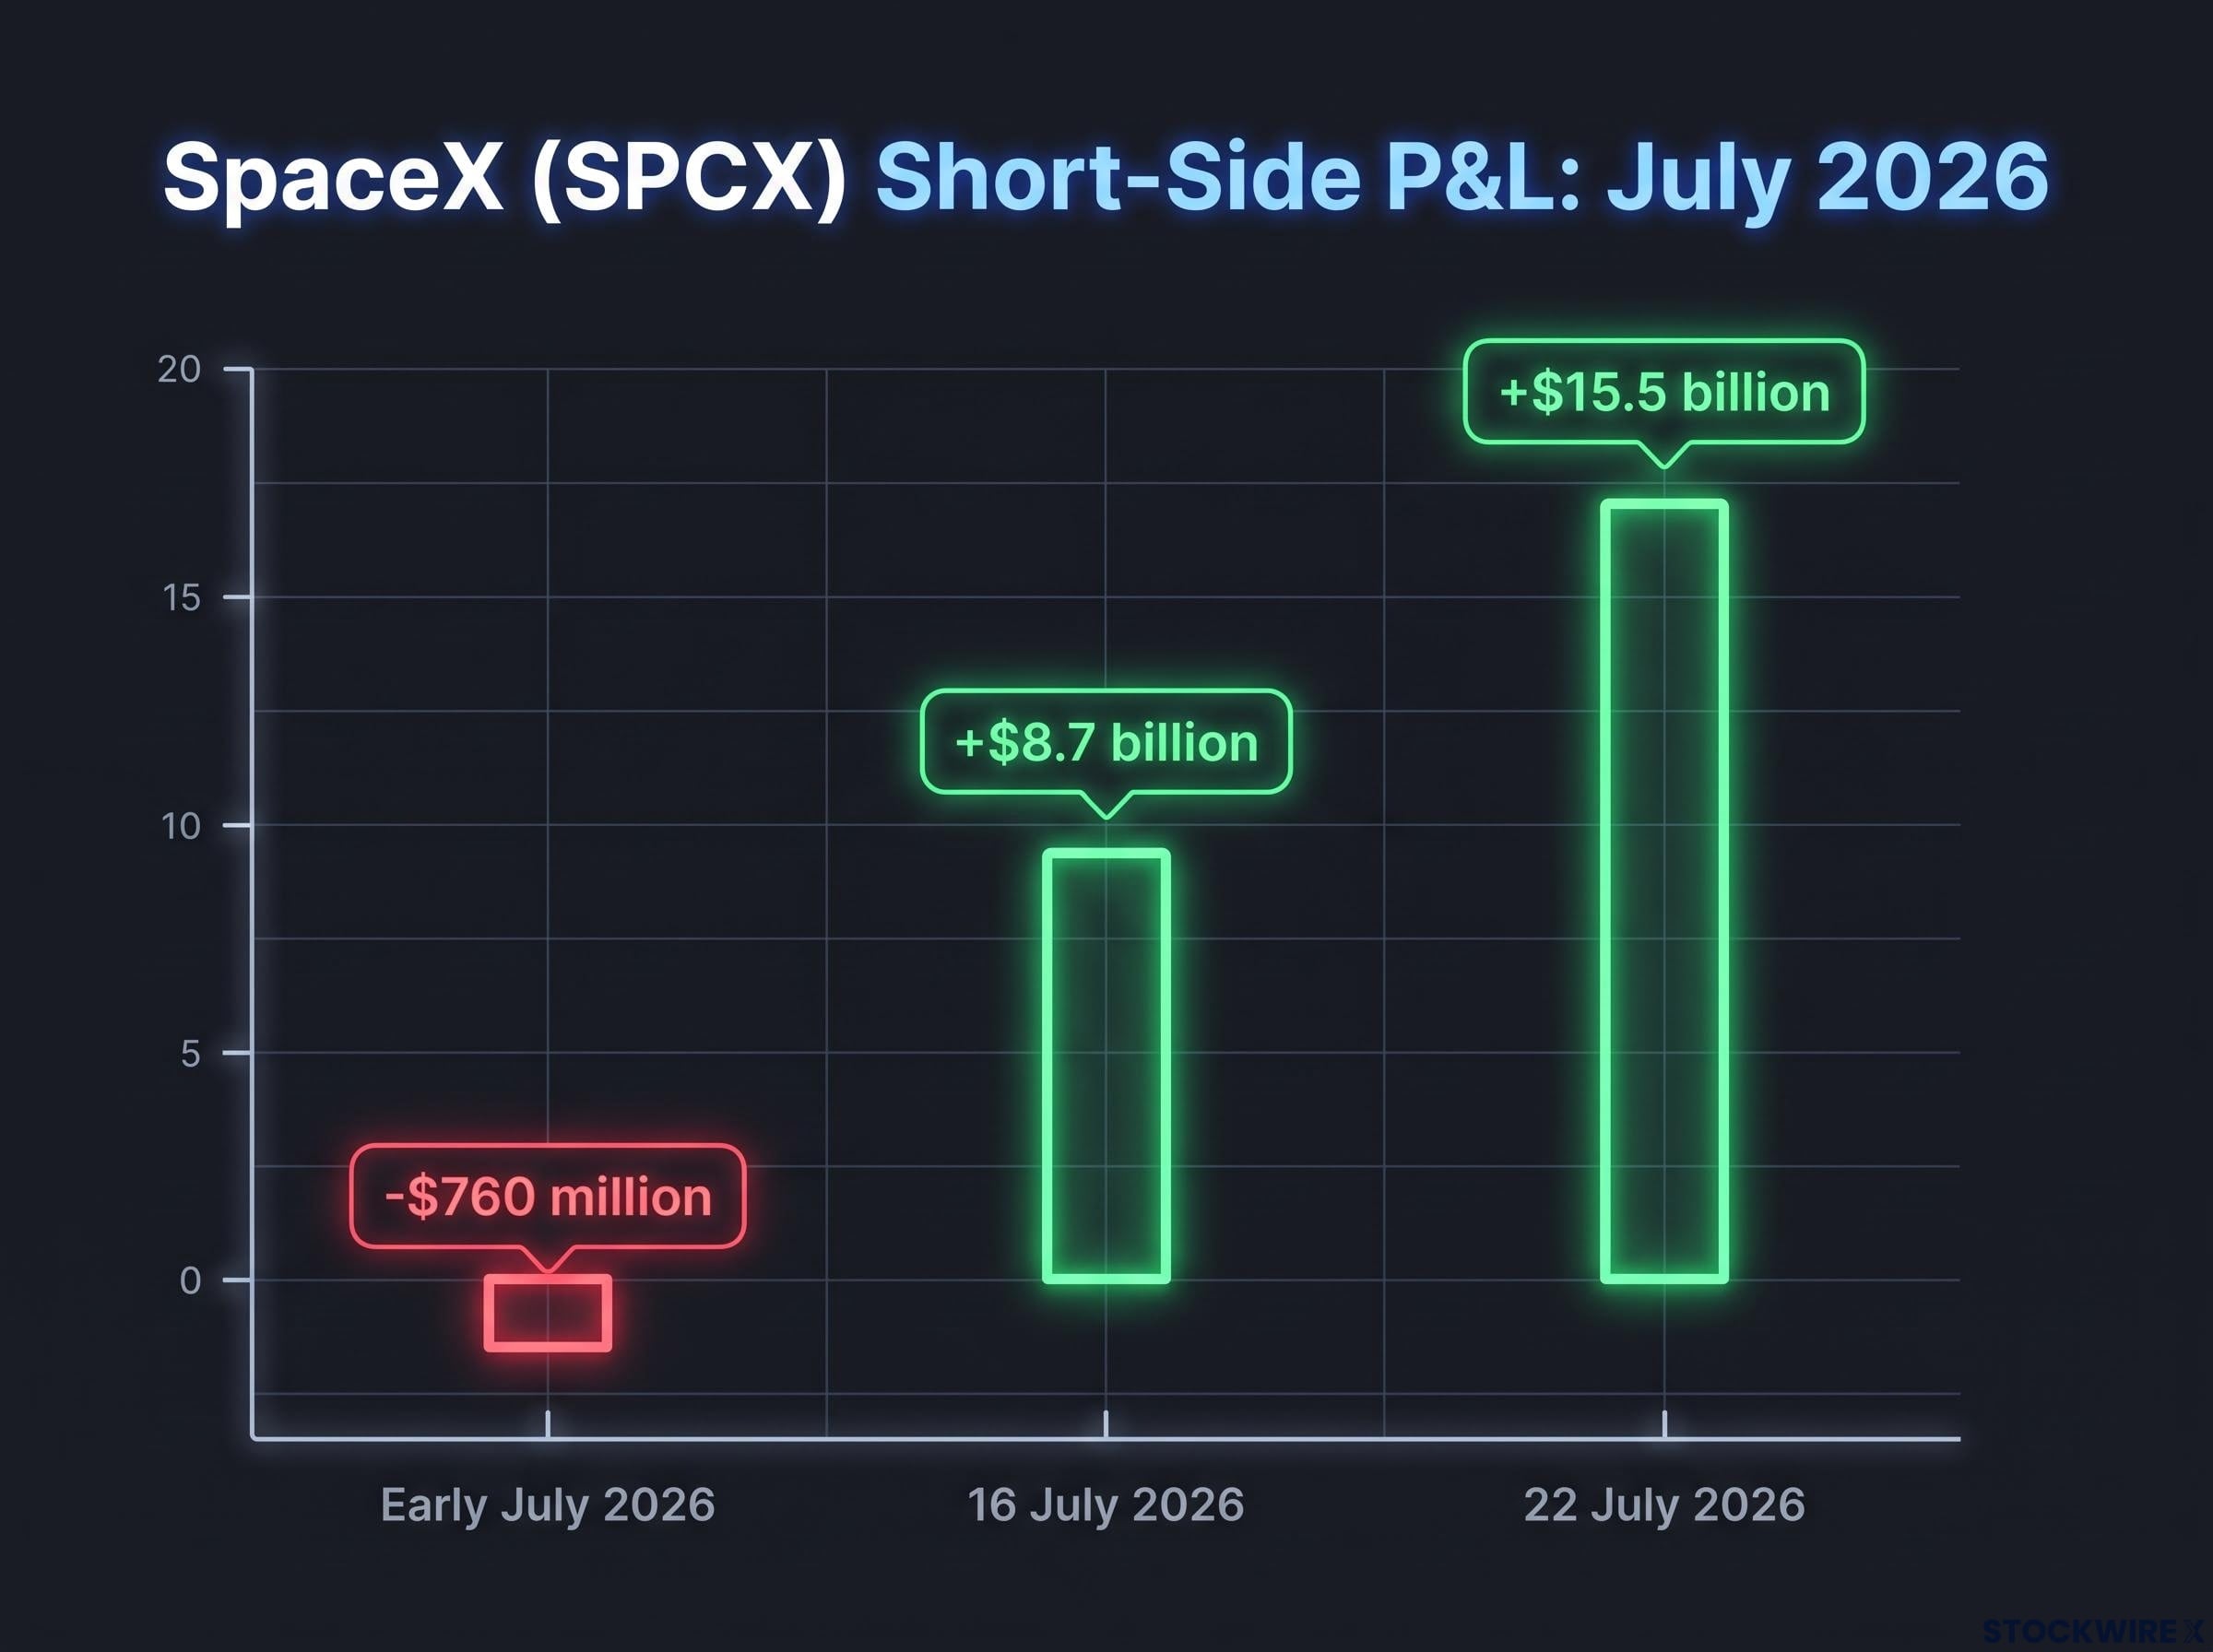
The speed of that move matters. But so does the early July drawdown. The shorts who held through $760 million in aggregate losses did not exit when the trade went against them. They stayed. That tells you these are not momentum traders riding a falling stock; they are participants with conviction, high pain thresholds, and a thesis they believe has not yet fully played out.
| Timeframe | Short-Side P&L |
|---|---|
| Early July 2026 | ~−$760 million (temporary aggregate loss) |
| 16 July 2026 | +$8.7 billion (paper profits) |
| 22 July 2026 | +$15.5 billion (paper profits) |
When big ASX news breaks, our subscribers know first
From 5% to 31% of the float: the anatomy of a short-interest build
The short book did not arrive in a single block. It was constructed over roughly one month, piece by piece, as professional participants scaled into positions with increasing aggression.
In late June, S3 Partners estimated approximately 40 million shares had been sold short, representing roughly 5-7% of the public float, with a notional value of around $4.5 billion. According to CNBC, S3 Partners data as of 16 July showed short interest had climbed to around 185 million shares, equivalent to approximately 29% of the float, a figure that Matthew Unterman, head of research at S3 Partners, discussed publicly. Ortex data, cited by Reuters and 24/7 Wall St, placed the figure slightly higher at approximately 196 million shares sold short, amounting to roughly 31% of the tradable float. The notional value of bearish exposure climbed to roughly $25 billion, per S3 Partners data via Business Insider.
By mid-July, Ortex reported that roughly 49% of SpaceX’s free float had been lent out, with the firm’s analysis suggesting the bulk of that lending activity corresponded to active short selling, according to Reuters.
That is a five-fold growth in shorted shares over one month. Two independent analytics firms confirm the scale:
FINRA Rule 4560 short interest reporting requires member firms to submit bi-monthly position data across all equity securities, which is the regulatory mechanism that produces the aggregated figures cited by analytics firms such as S3 Partners and Ortex Technologies.
- S3 Partners: ~185 million shares, ~29% of float
- Ortex Technologies: ~196 million shares, ~31% of float
CNBC, citing S3, described “continuous demand from short sellers building speculative positions since the IPO.” This was not a single fund making a one-off call. It was a sustained, coordinated build by multiple professional participants betting against one of the most watched IPOs in recent history.
The SpaceX IPO valuation context matters here: the $1.77 trillion implied market cap at the $135 offering price was the central input that professional short sellers stress-tested against Starlink revenue run rates and launch market share figures when building their fundamental thesis.
| Timeframe | Shares Short | % of Float | Notional Value |
|---|---|---|---|
| Late June 2026 | ~40 million | 5-7% | ~$4.5 billion |
| Early July 2026 | ~196 million | ~31% | — |
| 16 July 2026 | ~185 million | ~29% | — |
| Mid-to-late July 2026 | ~185-196 million | 29-31% | ~$25 billion |
Why short sellers are not covering, and what that actually means
The intuitive assumption is straightforward: if you are sitting on $15.5 billion in paper gains, you take profits. That is not how professional short positioning works at this scale.
A short sale is a borrowed-share transaction. A trader borrows shares, sells them at the current price, and profits if the stock falls, because they can buy the shares back cheaper to return them. The difference is the profit. But “buying them back” is the catch. Covering a short position means purchasing shares in the open market. When 185-196 million shares need to be repurchased, the buying pressure from covering alone can push the stock higher, eroding the very gains the trade produced.
So long as the thesis remains intact, meaning the trader believes the stock will continue to fall, the rational move is to hold. Unrealised gains are not the same as realised gains, and closing the position at this size carries its own cost.
The aggregate $25 billion notional position also carries ongoing short selling costs, including daily borrow fees on the roughly 49% of free float on loan, costs that compound against the bears if the stock stabilises or recovers before the thesis resolves.
What would actually trigger covering at this scale
Reuters, citing Ortex, noted that short sellers had “pressed their bearish bets” as shares slipped back toward the IPO price. S3 Partners described “continuous demand from short sellers building speculative positions since the IPO.” These are conviction trades, not hedges.
Short sellers “pressed their bearish bets” as SpaceX shares slipped back toward the IPO price, according to Reuters.
Three conditions would realistically force or incentivise covering: a sharp positive catalyst such as a major launch success or contract win, a sustained price recovery toward or above the $135 IPO price, or a short squeeze triggered by forced margin calls. At $25 billion notional, covering itself becomes a market-moving event, which is precisely why the shorts are not rushing to close. The exit is as consequential as the entry.
Musk’s warning and the squeeze scenario short sellers are betting against
Elon Musk did not leave the short overhang unaddressed. In a post on X during the peak of the short interest discussion, Musk warned directly:
“The survival probability of people maintaining a significant short position on SpaceX over time is very low.”
That is not casual commentary. It is a public signal that SpaceX’s founder is aware of the short book’s size and structure, and it carries an implicit promise: positive catalysts, when they arrive, will be communicated with maximum market impact.
The squeeze mechanics are real. Every short position is a future buy order, because covering requires purchasing shares. With approximately 49% of the free float out on loan and nearly a third of it sold short, a forced covering event would concentrate enormous buying pressure into a single stock. The catalyst types that could trigger it include:
Short squeeze mechanics follow a self-reinforcing loop: forced buybacks from margin-called short sellers push the price higher, which triggers additional margin calls, which forces more buybacks, compressing the very position the original bears constructed over weeks.
- A high-profile launch success or Starlink milestone
- A significant government or commercial contract announcement
- An earnings report that beats expectations
- A regulatory approval for a new business line
The bears have a legitimate case too. SpaceX reached a very high market capitalisation relative to current launch and Starlink revenues, and subsequent debt issuance and acquisition plans have added to valuation concerns. The fundamental skepticism is real. But so is the structural risk that Musk explicitly identified: when this many shares are borrowed and sold, the conditions for a violent reversal are already in place.
Price sensitivity at scale: how position size amplifies every move in SPCX
The abstract billions figure becomes concrete through a single data point from Ortex, reported via Reuters and 24/7 Wall St.
Each $1 move in SPCX’s share price generates approximately $200 million in mark-to-market gains or losses across the aggregate short book, based on Ortex estimates.
The mechanical confirmation is straightforward: approximately 196 million shares short, multiplied by $1, equals approximately $196 million, consistent with the Ortex estimate.
The critical insight is the symmetry. The same sensitivity that generated $15.5 billion in gains on the way down creates equivalent exposure on any upside move. A $10 recovery in the share price would erase roughly $2 billion in paper profits across the short book. A $25 rally back toward the IPO price would cost shorts approximately $5 billion. If you are considering a position in SPCX, this dollar-per-share sensitivity is the number that should inform your sizing. The short overhang does not just amplify downside momentum; it amplifies everything.
What the short book tells retail investors about where the real risk lies
The temptation is to read 29-31% of the float shorted as a directional verdict: smart money says down. That framing is incomplete, and acting on it alone is how retail investors get caught on the wrong side of a squeeze.
Extreme short interest is a volatility indicator, not a one-way signal. It simultaneously reflects genuine fundamental skepticism, the valuation concerns, the debt, the acquisition spending, and creates structural conditions for amplified upside moves if any positive catalyst arrives. The same crowded short book that has generated $15.5 billion in paper gains for professionals means that SPCX can move violently in either direction on news that would produce modest moves in a normally positioned stock.
The right read for retail investors is not “follow the shorts” or “fade the shorts.” It is that SPCX is structurally set up for very large moves on catalysts that would be routine events in a stock with normal short interest. Position sizing should reflect that reality.
This article is for informational purposes only and should not be considered financial advice. Investors should conduct their own research and consult with financial professionals before making investment decisions. Past performance does not guarantee future results.
Short interest at this scale is a structural fact, not a sentiment footnote
The $15.5 billion in paper gains and the 29-31% float shorted are not headline curiosities. They describe a structural feature of SPCX’s market that will shape how the stock responds to every catalyst from this point forward. The fundamental concerns that drove the short thesis are real, and so is the squeeze risk that Musk identified publicly. Retail investors navigating SPCX need both lenses simultaneously.
The question from here is not whether short sellers are right or wrong about SpaceX’s valuation. It is what specific events will resolve the standoff between a $25 billion short book and a company whose founder has explicitly promised it will not survive.
For investors wanting to place the SPCX short interest build in a broader analytical framework, our full explainer on interpreting short interest data examines how corporate event catalysts cause short positions to build or unwind, with worked examples showing how the monthly change figure differs from single-week moves.
—