Zixin Group’s 23% Profit Beat Drives Analyst Upgrade to S$0.06
8 hrs ago

At approximately 8:07 PM ET on June 17, 2026, S&P 500 futures jumped 0.8%, Nasdaq 100 futures surged 1.4%, and Brent crude fell sharply. The moves came within minutes of President Trump confirming a preliminary US-Iran ceasefire from Versailles, where he was midway through a state visit to France. The agreement, signed remotely by Trump and Iranian President Masoud Pezeshkian, ends roughly four months of open conflict that had threatened the Strait of Hormuz, the chokepoint through which about 20% of globally traded oil and gas flows. The signing marks the most significant de-escalation in US-Iran relations in years, but it comes with a 60-day negotiation window still ahead. What follows explains exactly what was agreed, why markets moved the way they did across equities and crude, and what investors should watch over the coming weeks as the preliminary deal either hardens into a settlement or frays.
Trump confirmed the signing directly to reporters in Versailles, and the deal was subsequently reported by Axios, the BBC, and CBS. The agreement covers three core provisions:
Each provision addresses one of the conflict’s most disruptive dimensions. Together they amount to a genuine step toward normalisation after approximately four months of open hostilities.
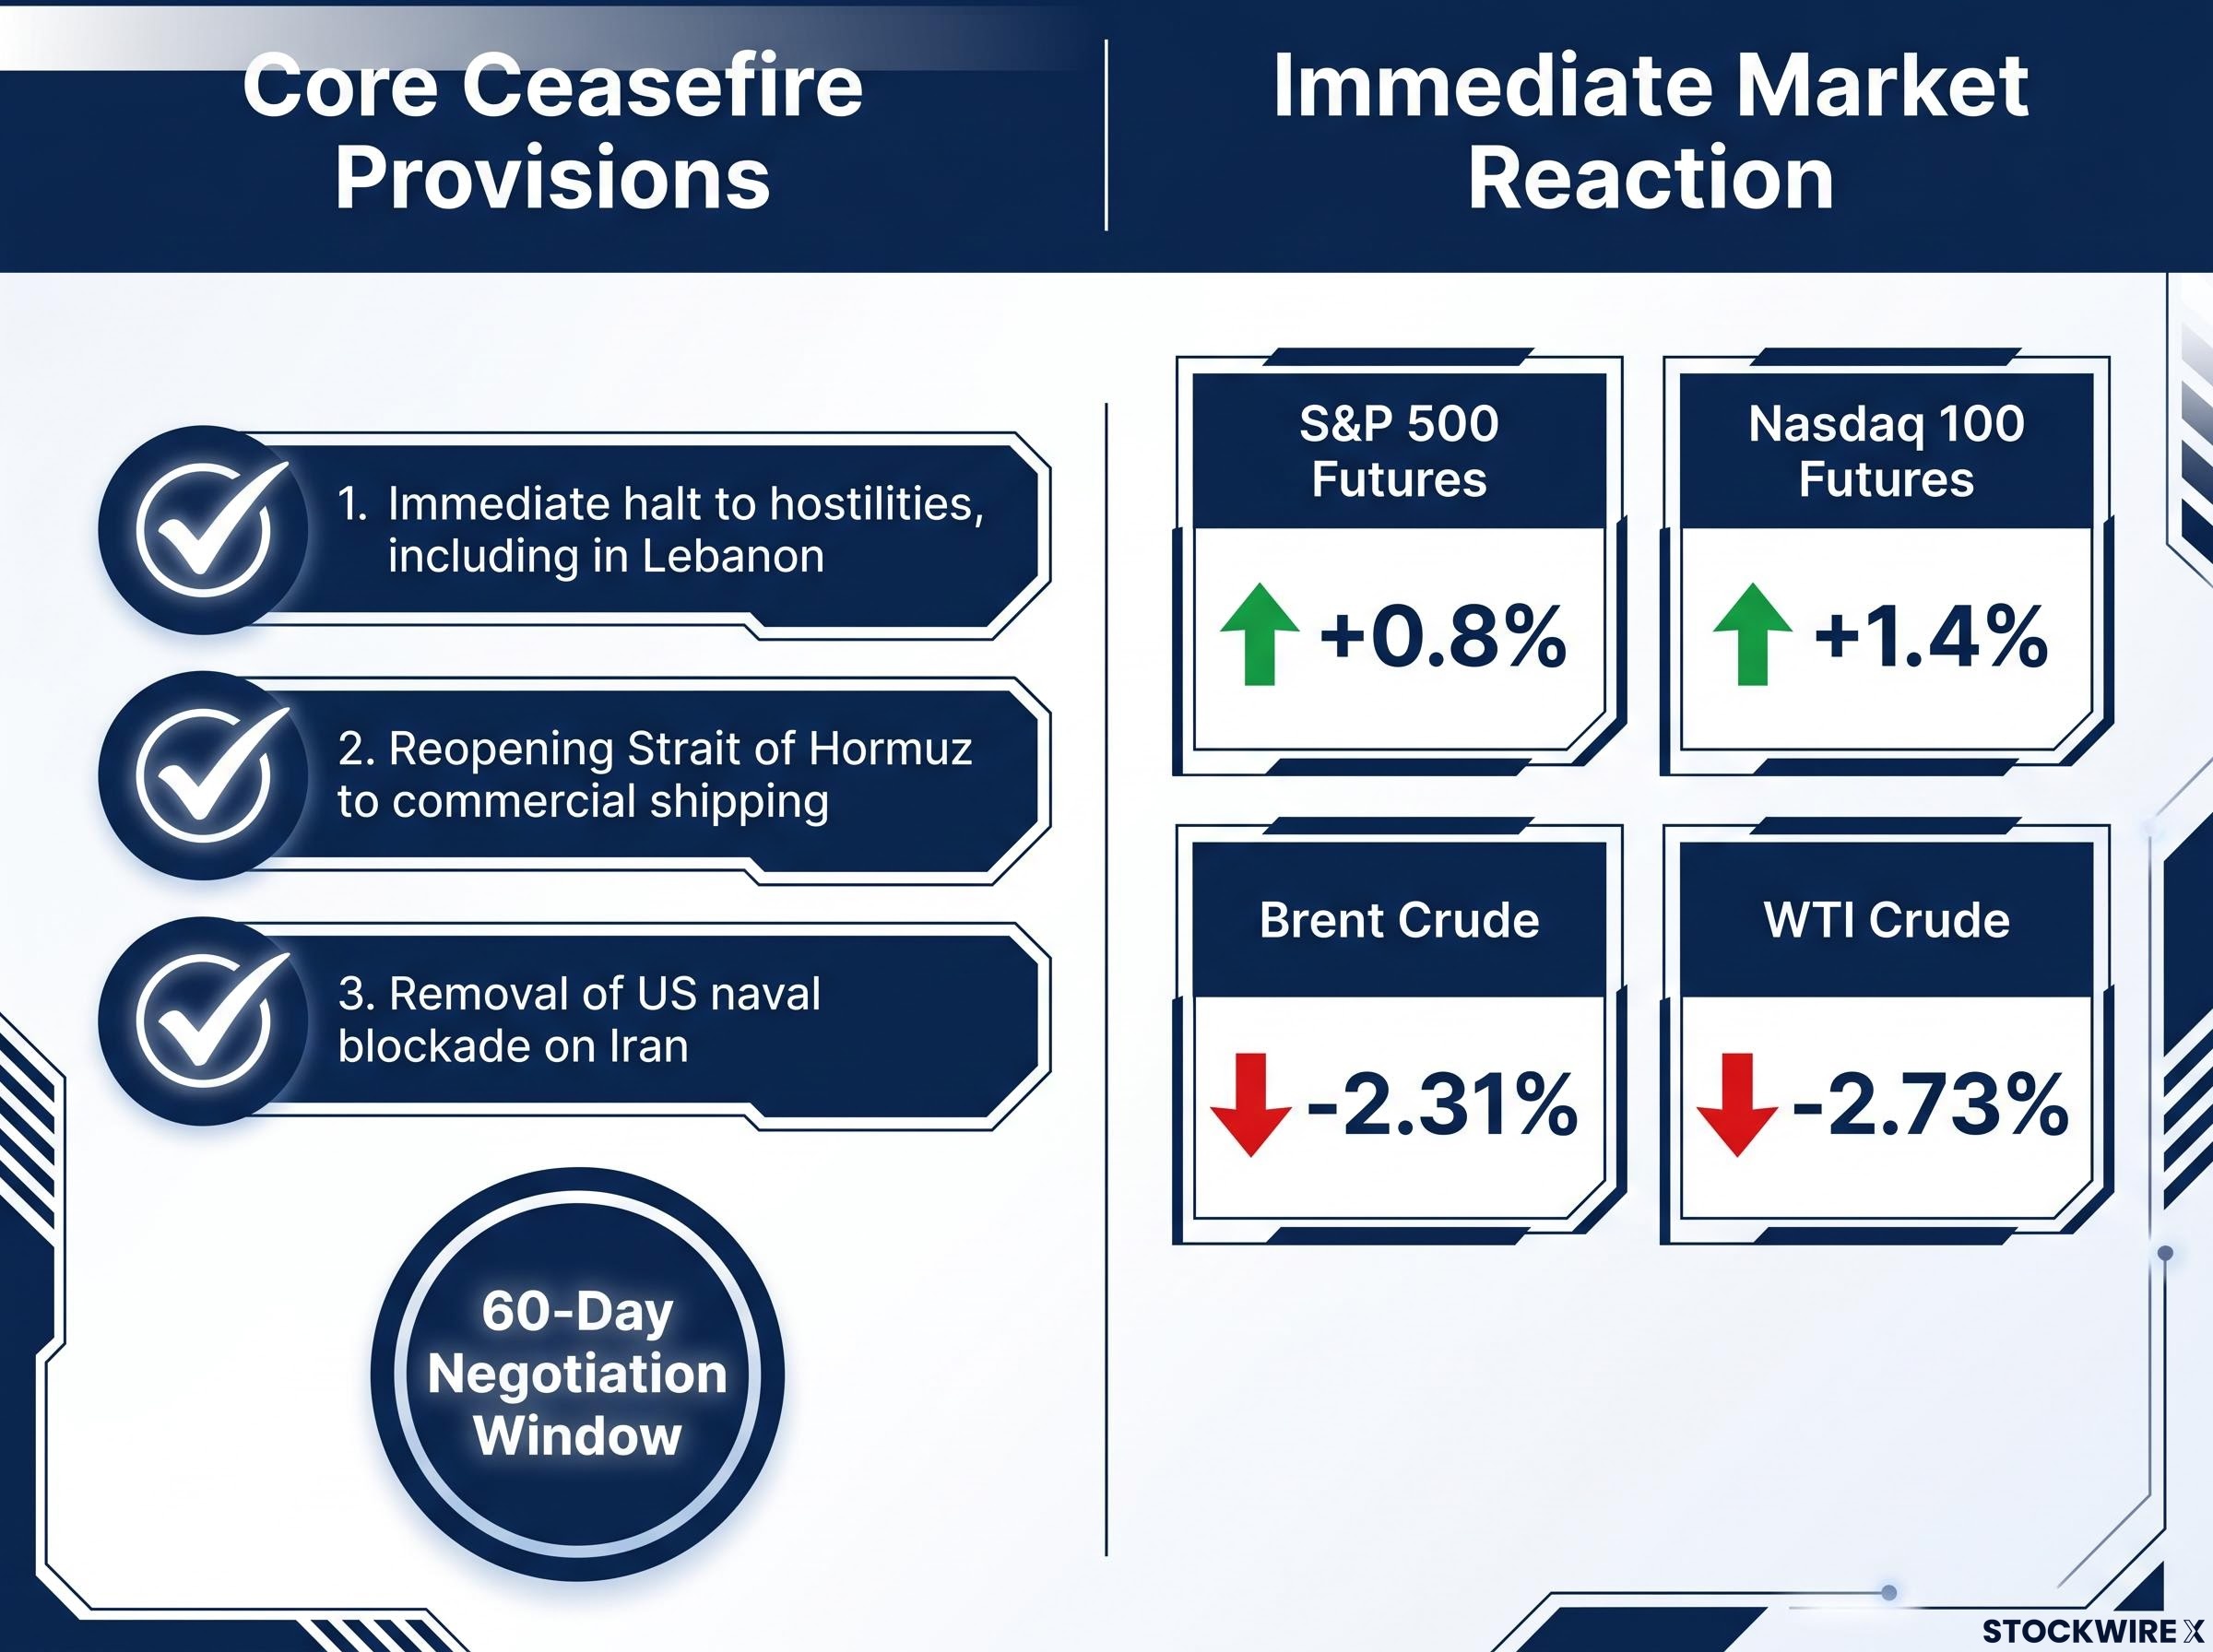
The word that matters most, however, is “preliminary.” The agreement explicitly requires a follow-on 60-day structured negotiation period to resolve the hardest outstanding issues, with Iran’s nuclear programme at the centre. Trump issued a direct warning that military operations could be reinstated if Tehran fails to honour the ceasefire’s terms. Nothing about the nuclear question has been settled; the ceasefire buys time to negotiate it.
The Strait of Hormuz is a narrow waterway between Iran and Oman, barely 33 kilometres wide at its shipping lanes, connecting the Persian Gulf to the open ocean.
Roughly 20% of all globally traded oil and gas passes through the Strait of Hormuz, making it the single most consequential chokepoint in global energy supply.
There is no comparable alternative route for the volume of crude that transits this corridor daily. When the four-month conflict introduced threats of closure, a naval blockade, and active hostilities in the vicinity, the market responded by embedding a substantial geopolitical risk premium into crude prices. Brent and WTI rose well above their prewar levels as traders priced in the possibility, however partial, of a sustained supply disruption affecting one-fifth of the world’s traded hydrocarbons.
EIA data on Hormuz oil flows confirms that in 2024 approximately 20 million barrels per day transited the strait, equivalent to about 20% of global petroleum liquids consumption, a figure that frames the scale of supply risk markets were pricing during the four months of open hostilities.
A ceasefire that credibly reduces the probability of closure is what mechanically triggers the unwinding of that premium. That is precisely what happened on the evening of June 17: as the signing was confirmed, crude futures began repricing the lower tail risk. On June 18, Brent settled at $77.71 (down approximately 2.31%) and WTI at $74.69 (down approximately 2.73%), both at multi-month lows but still above where they traded before the conflict began.
Geopolitical risk premiums in crude futures do not move linearly with diplomatic news; intraday swings of nearly $2 per barrel occurred even during periods when physical Hormuz transit remained technically open, driven by the gap between official statements and actual vessel movements, and by the speed with which war-risk insurance pricing incorporates new information.
The after-hours equity futures surge told one story. The regular-session dynamics told another.
Within minutes of the Versailles confirmation, futures across all three major US indices climbed. The Nasdaq 100’s 1.4% gain was the largest, consistent with long-duration growth stocks’ sensitivity to falling geopolitical risk premia. The S&P 500 added 0.8% and the Dow Jones 0.6%.
Then came the regular session on June 18. The VIX rose 12.37% to 18.44, a move that sits uncomfortably alongside a relief rally in futures.
The VIX’s 12.37% rise during a session shaped by geopolitical relief signals that markets are pricing residual uncertainty, not a resolved situation.
The gap between implied versus realised volatility in 2026 is the clearest lens through which to read the VIX’s 12.37% rise: with implied volatility running roughly 10 percentage points above realised volatility for much of the year, a VIX at 18.44 reflects structural risk perception rather than actual daily price movement severity.
The split is not contradictory. Futures rallied on the ceasefire headline; the VIX reflected the Federal Reserve’s still-hawkish posture and the 60-day negotiation window that leaves the deal’s durability an open question.
| Asset | Price / Level | Move | Direction |
|---|---|---|---|
| S&P 500 Futures | 5,556.75 | +0.8% | Up |
| Nasdaq 100 Futures | 30,400.50 | +1.4% | Up |
| WTI Crude | $74.69 | -2.73% | Down |
| Brent Crude | $77.71 | -2.31% | Down |
| VIX | 18.44 | +12.37% | Up |
| US 10-Year Yield | 4.439% | -0.40% | Down |
| Gold Futures | $4,340.30 | -0.94% | Down |
The dollar index edged up 0.16% to 100.025, while gold and silver both fell modestly, consistent with a partial unwinding of safe-haven positioning.
The Nasdaq 100’s 1.4% after-hours gain, the largest of the three major index futures, points directly to where the ceasefire’s relief is most concentrated.
The cross-asset repricing from the Hormuz blockade extended well beyond crude futures: ECB rate signals, Asian equity market declines, and China’s weakening import demand all contributed to a stagflationary undercurrent that a US-centric analysis of the ceasefire only partially captures.
The distinction matters for portfolio positioning. The ceasefire is not uniformly bullish; it redistributes the risk premium across sectors rather than simply removing it.
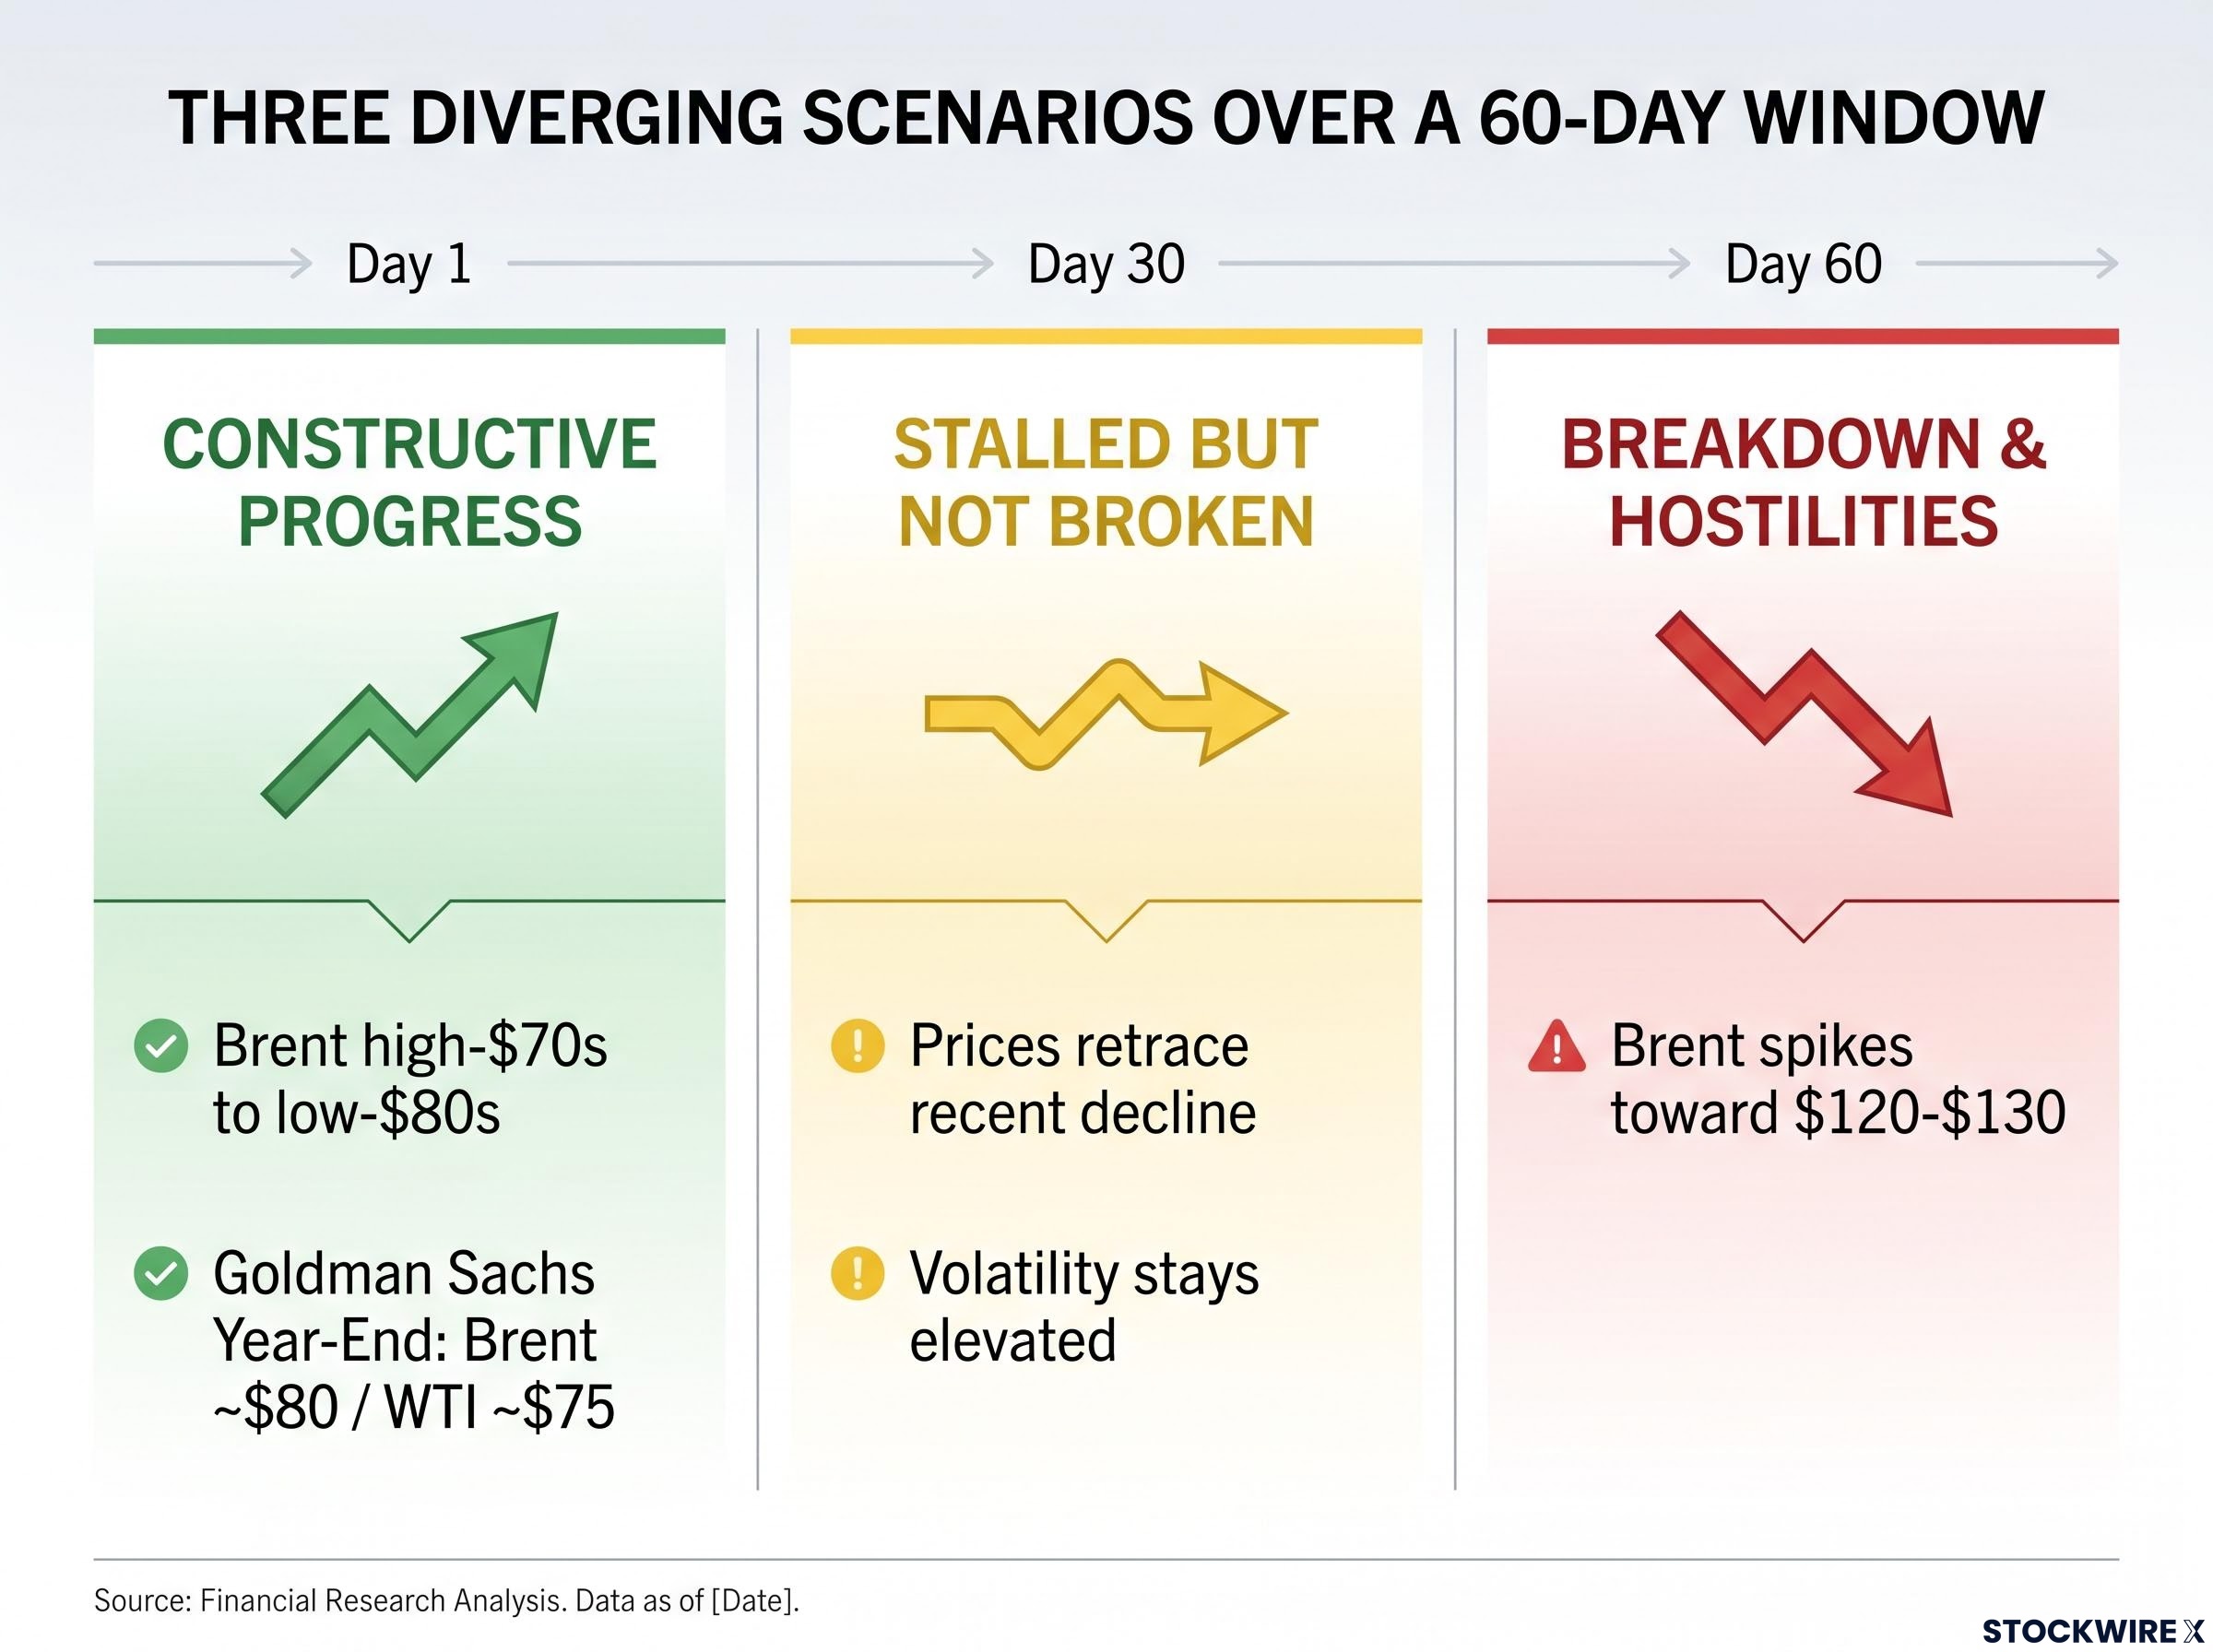
A ceasefire is a direction signal, not an overnight price reset. Brent at $77.71 sits roughly $10 above prewar levels according to Morningstar’s analysis, despite having fallen sharply from mid-crisis highs. The gap reflects logistical friction that diplomacy alone cannot resolve.
Physical normalisation of Strait of Hormuz traffic faces concrete obstacles independent of diplomatic progress. Mine clearance or verification of the strait’s safety, restoration of shipping insurance coverage, and the working through of a vessel backlog built over four months of disruption all take time. Capital Economics and other analysts estimate that oil production and exports may take 2-3 months to reach approximately 80% of prewar levels, with full normalisation stretching further still.
Past performance does not guarantee future results. These projections are subject to market conditions and various risk factors.
The next 60 days will move markets from trading a ceasefire headline to either pricing a durable settlement or repricing renewed risk. Three categories of leading indicators will signal which direction is forming:
Federal Reserve policy constraints from energy inflation shaped the backdrop for this ceasefire in ways that go beyond monetary mechanics: with US headline inflation already running above 3% driven by gasoline costs and the Fed in a static holding pattern, the geopolitical relief in crude directly affects how much room policymakers have to respond to the next growth shock.
The Fed’s stance remains a parallel constraint independent of geopolitical progress. The 10-Year Treasury yield at 4.439% and the 10-2 Year spread at 31.32 basis points on June 18 reflect ongoing monetary policy pressure that limits how far the geopolitical relief rally can extend. That is the clearest explanation for why the VIX rose 12.37% even as futures climbed: the ceasefire removed one source of uncertainty, but left the other intact.
The Versailles signing has removed a major tail risk from global markets, but the split between the futures rally and the VIX’s rise captures exactly where positioning stands: relieved, not convinced. Oil remains above prewar levels. The 60-day negotiation window, with Iran’s nuclear programme at its centre, is where the remaining risk concentrates.
Investors tracking this story should watch three things: tanker traffic and Hormuz logistics for physical confirmation, nuclear negotiation progress for diplomatic confirmation, and inflation-sensitive macro data for the feed-through into monetary policy. The next two months will determine whether this ceasefire trade becomes a durable peace dividend, and both oil and equity positioning should reflect that conditionality.
This article is for informational purposes only and should not be considered financial advice. Investors should conduct their own research and consult with financial professionals before making investment decisions.
The US-Iran peace deal is a preliminary ceasefire agreement signed remotely by President Trump and Iranian President Masoud Pezeshkian on June 17, 2026, covering an immediate halt to hostilities, the reopening of the Strait of Hormuz to commercial shipping, and the removal of the US naval blockade on Iran, with a 60-day structured negotiation period still required to resolve the nuclear programme question.
Oil prices fell because the ceasefire credibly reduced the probability of a sustained closure of the Strait of Hormuz, through which roughly 20% of globally traded oil and gas flows, unwinding the geopolitical risk premium that had been embedded in crude futures during four months of open hostilities; Brent settled at $77.71 and WTI at $74.69 on June 18.
The 60-day window means the ceasefire is preliminary rather than a resolved settlement, with Iran's nuclear programme still at the centre of outstanding talks; investors should treat current market moves as a ceasefire trade rather than a durable peace dividend, as a breakdown could send Brent spiking back toward $120-$130 according to analyst projections.
The VIX rose 12.37% to 18.44 on June 18 because while the ceasefire removed one source of uncertainty, the Federal Reserve's still-hawkish posture and the unresolved 60-day negotiation window left structural risk perception elevated; implied volatility was running roughly 10 percentage points above realised volatility for much of 2026.
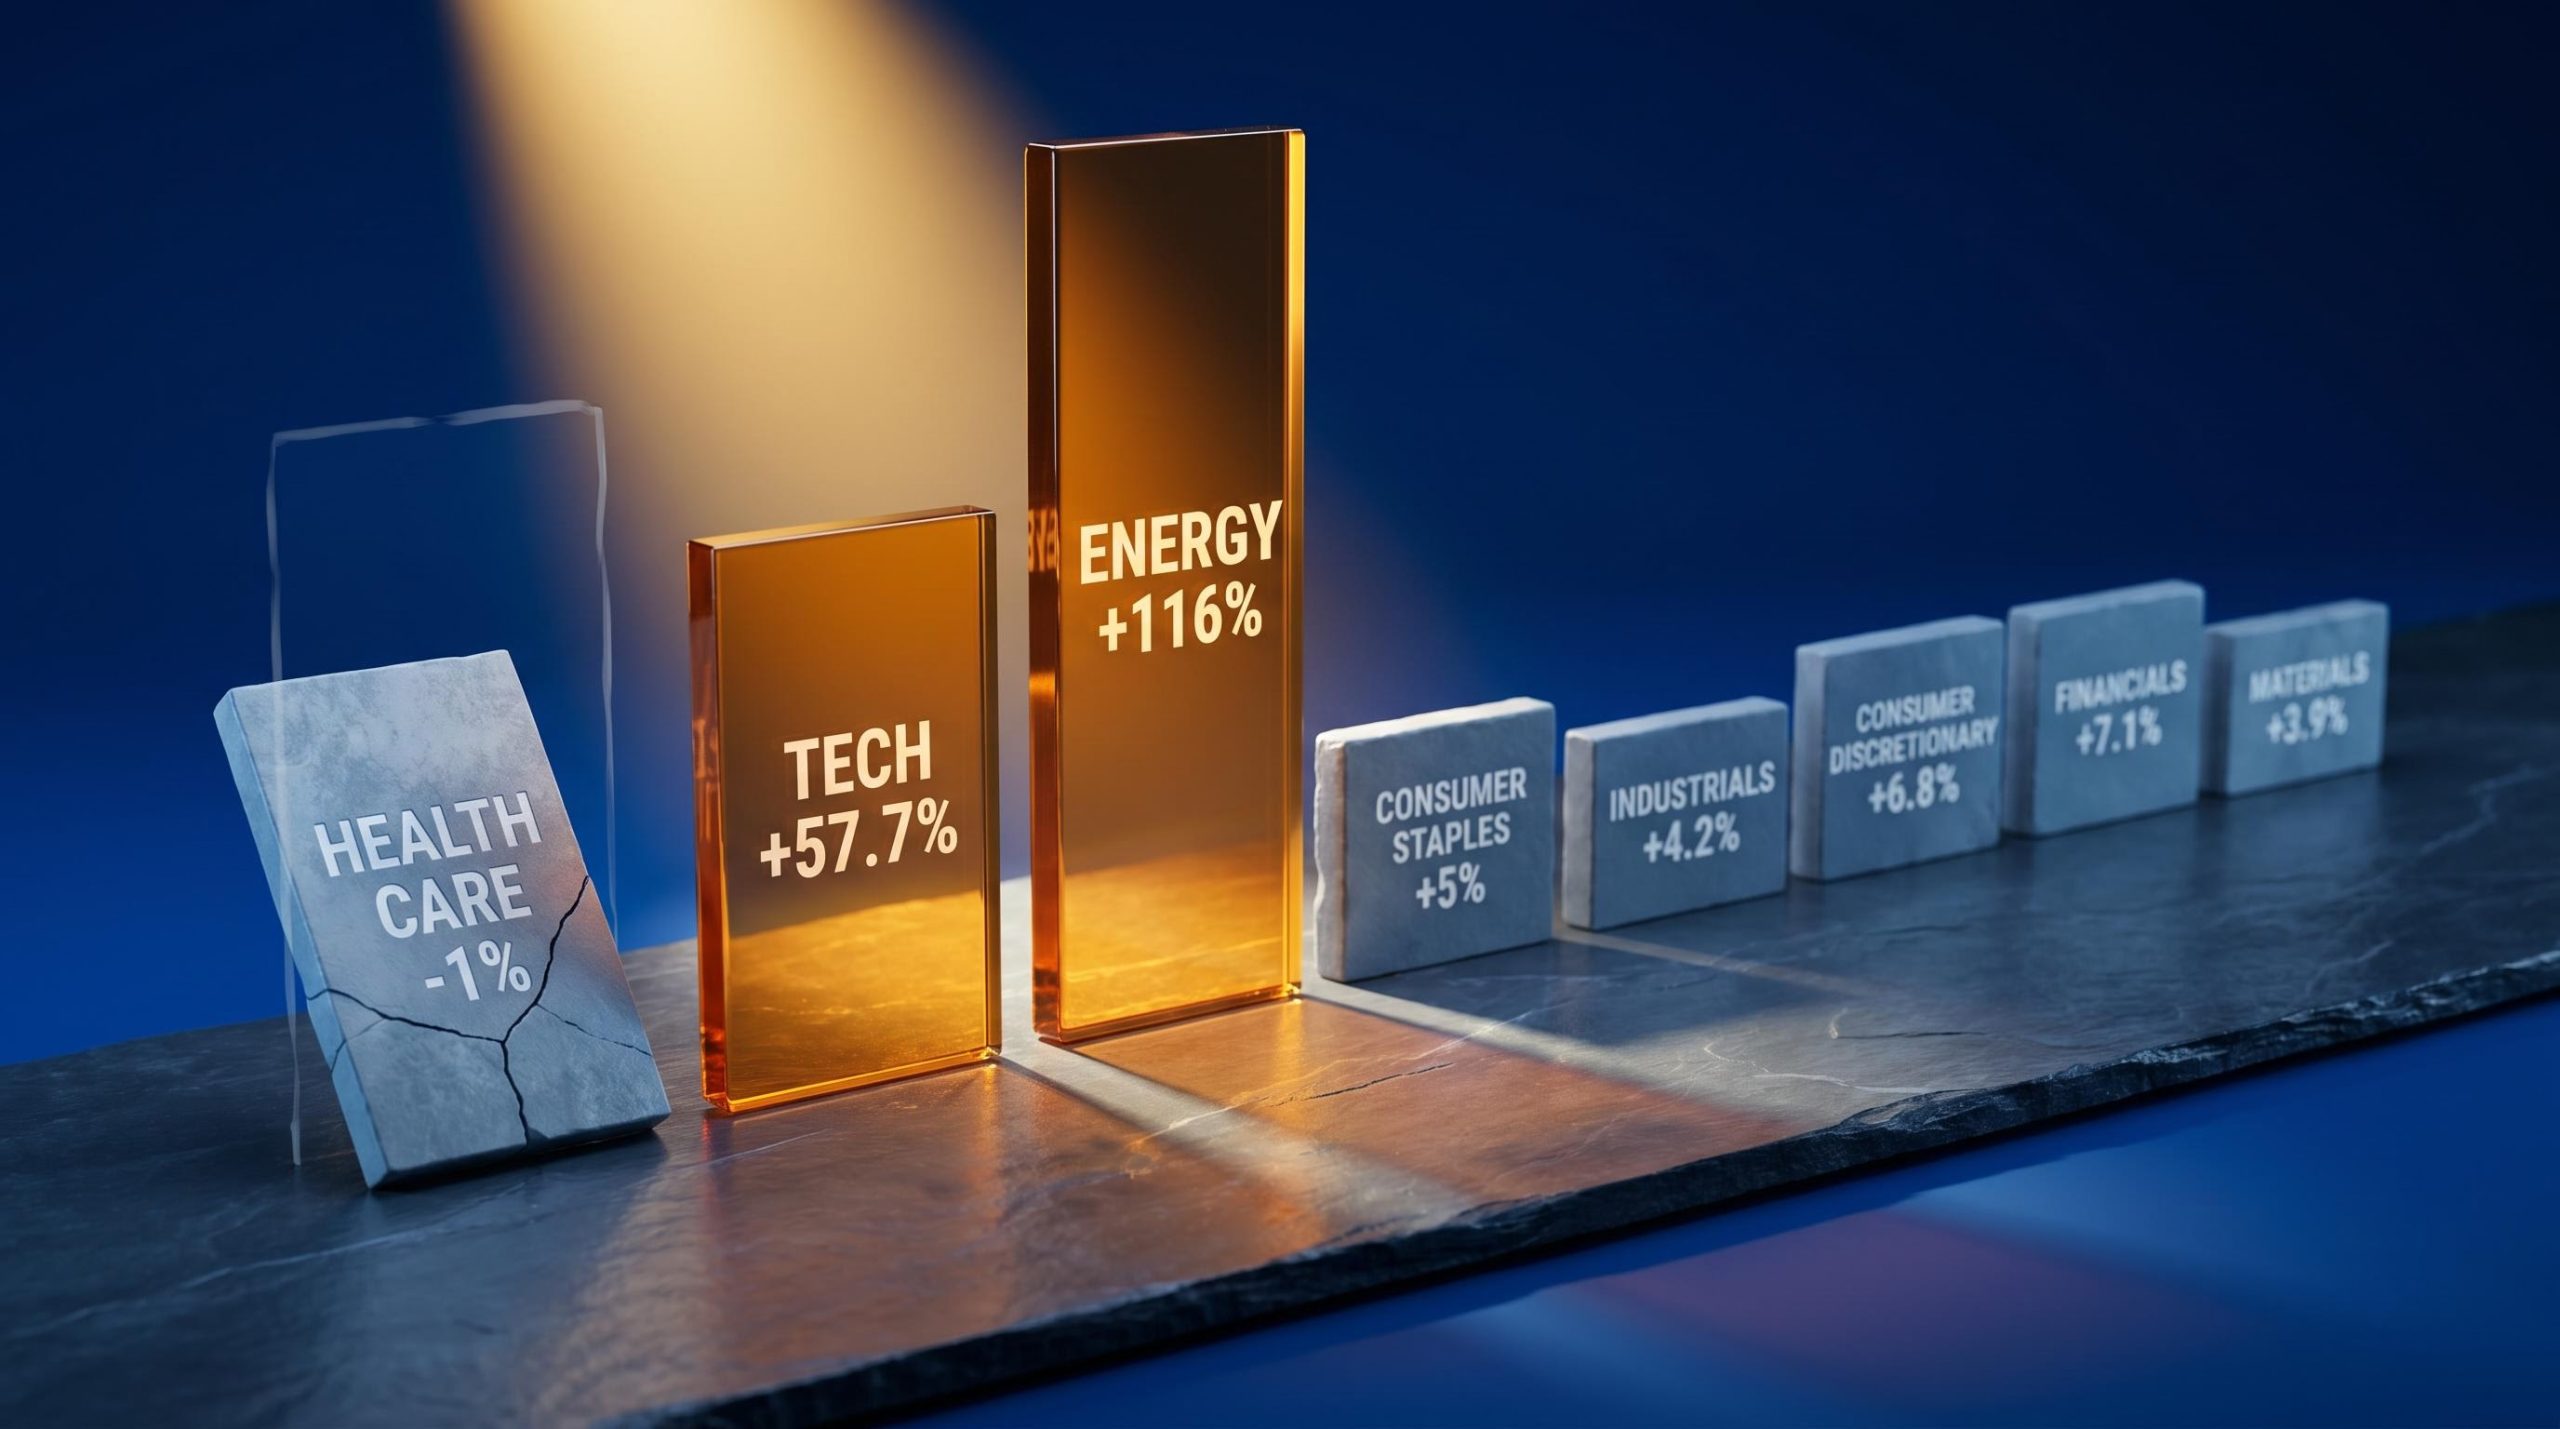
Technology and growth stocks benefit most because falling geopolitical risk premia reduce the discount rates applied to long-duration earnings, explaining the Nasdaq 100's 1.4% after-hours gain; energy-intensive sectors including airlines, shipping, and chemicals also gain from lower input costs, while upstream energy producers face mixed outcomes as crude retreats from crisis highs.