
What a $10,000 CBA Investment Is Actually Worth After 5 Years
1 hr ago

Aggregate S&P 500 earnings growth projections for Q2 2026 have climbed from 13.9% to 21.4% since the start of the year. On the surface, that revision looks like a broad vote of confidence. It is not. The gains are concentrated in a handful of sectors, while several others have seen their outlooks cut or turned negative entirely. Information Technology now carries a projected 57.7% earnings growth rate. Energy sits at 116%. Meanwhile, Health Care is expected to post a year-over-year earnings decline, and Consumer Discretionary, Industrials, and Consumer Staples have all been revised lower. The stock market outlook for the second half of 2026 depends less on aggregate strength than on what this lopsided distribution of expectations reveals about risk, opportunity, and where the current bull market actually stands. What follows is a sector-by-sector reading of that expectation map and what it means for portfolio positioning.
The aggregate revision from 13.9% to 21.4% is the headline. The composition beneath it tells a different story.
The Q1 2026 earnings season produced a blended S&P 500 growth rate of 27.1%, nearly double the 13.1% analyst forecast from quarter-end, and that outsized beat is the direct reason analyst confidence compounded into the ambitious Q2 consensus visible today.
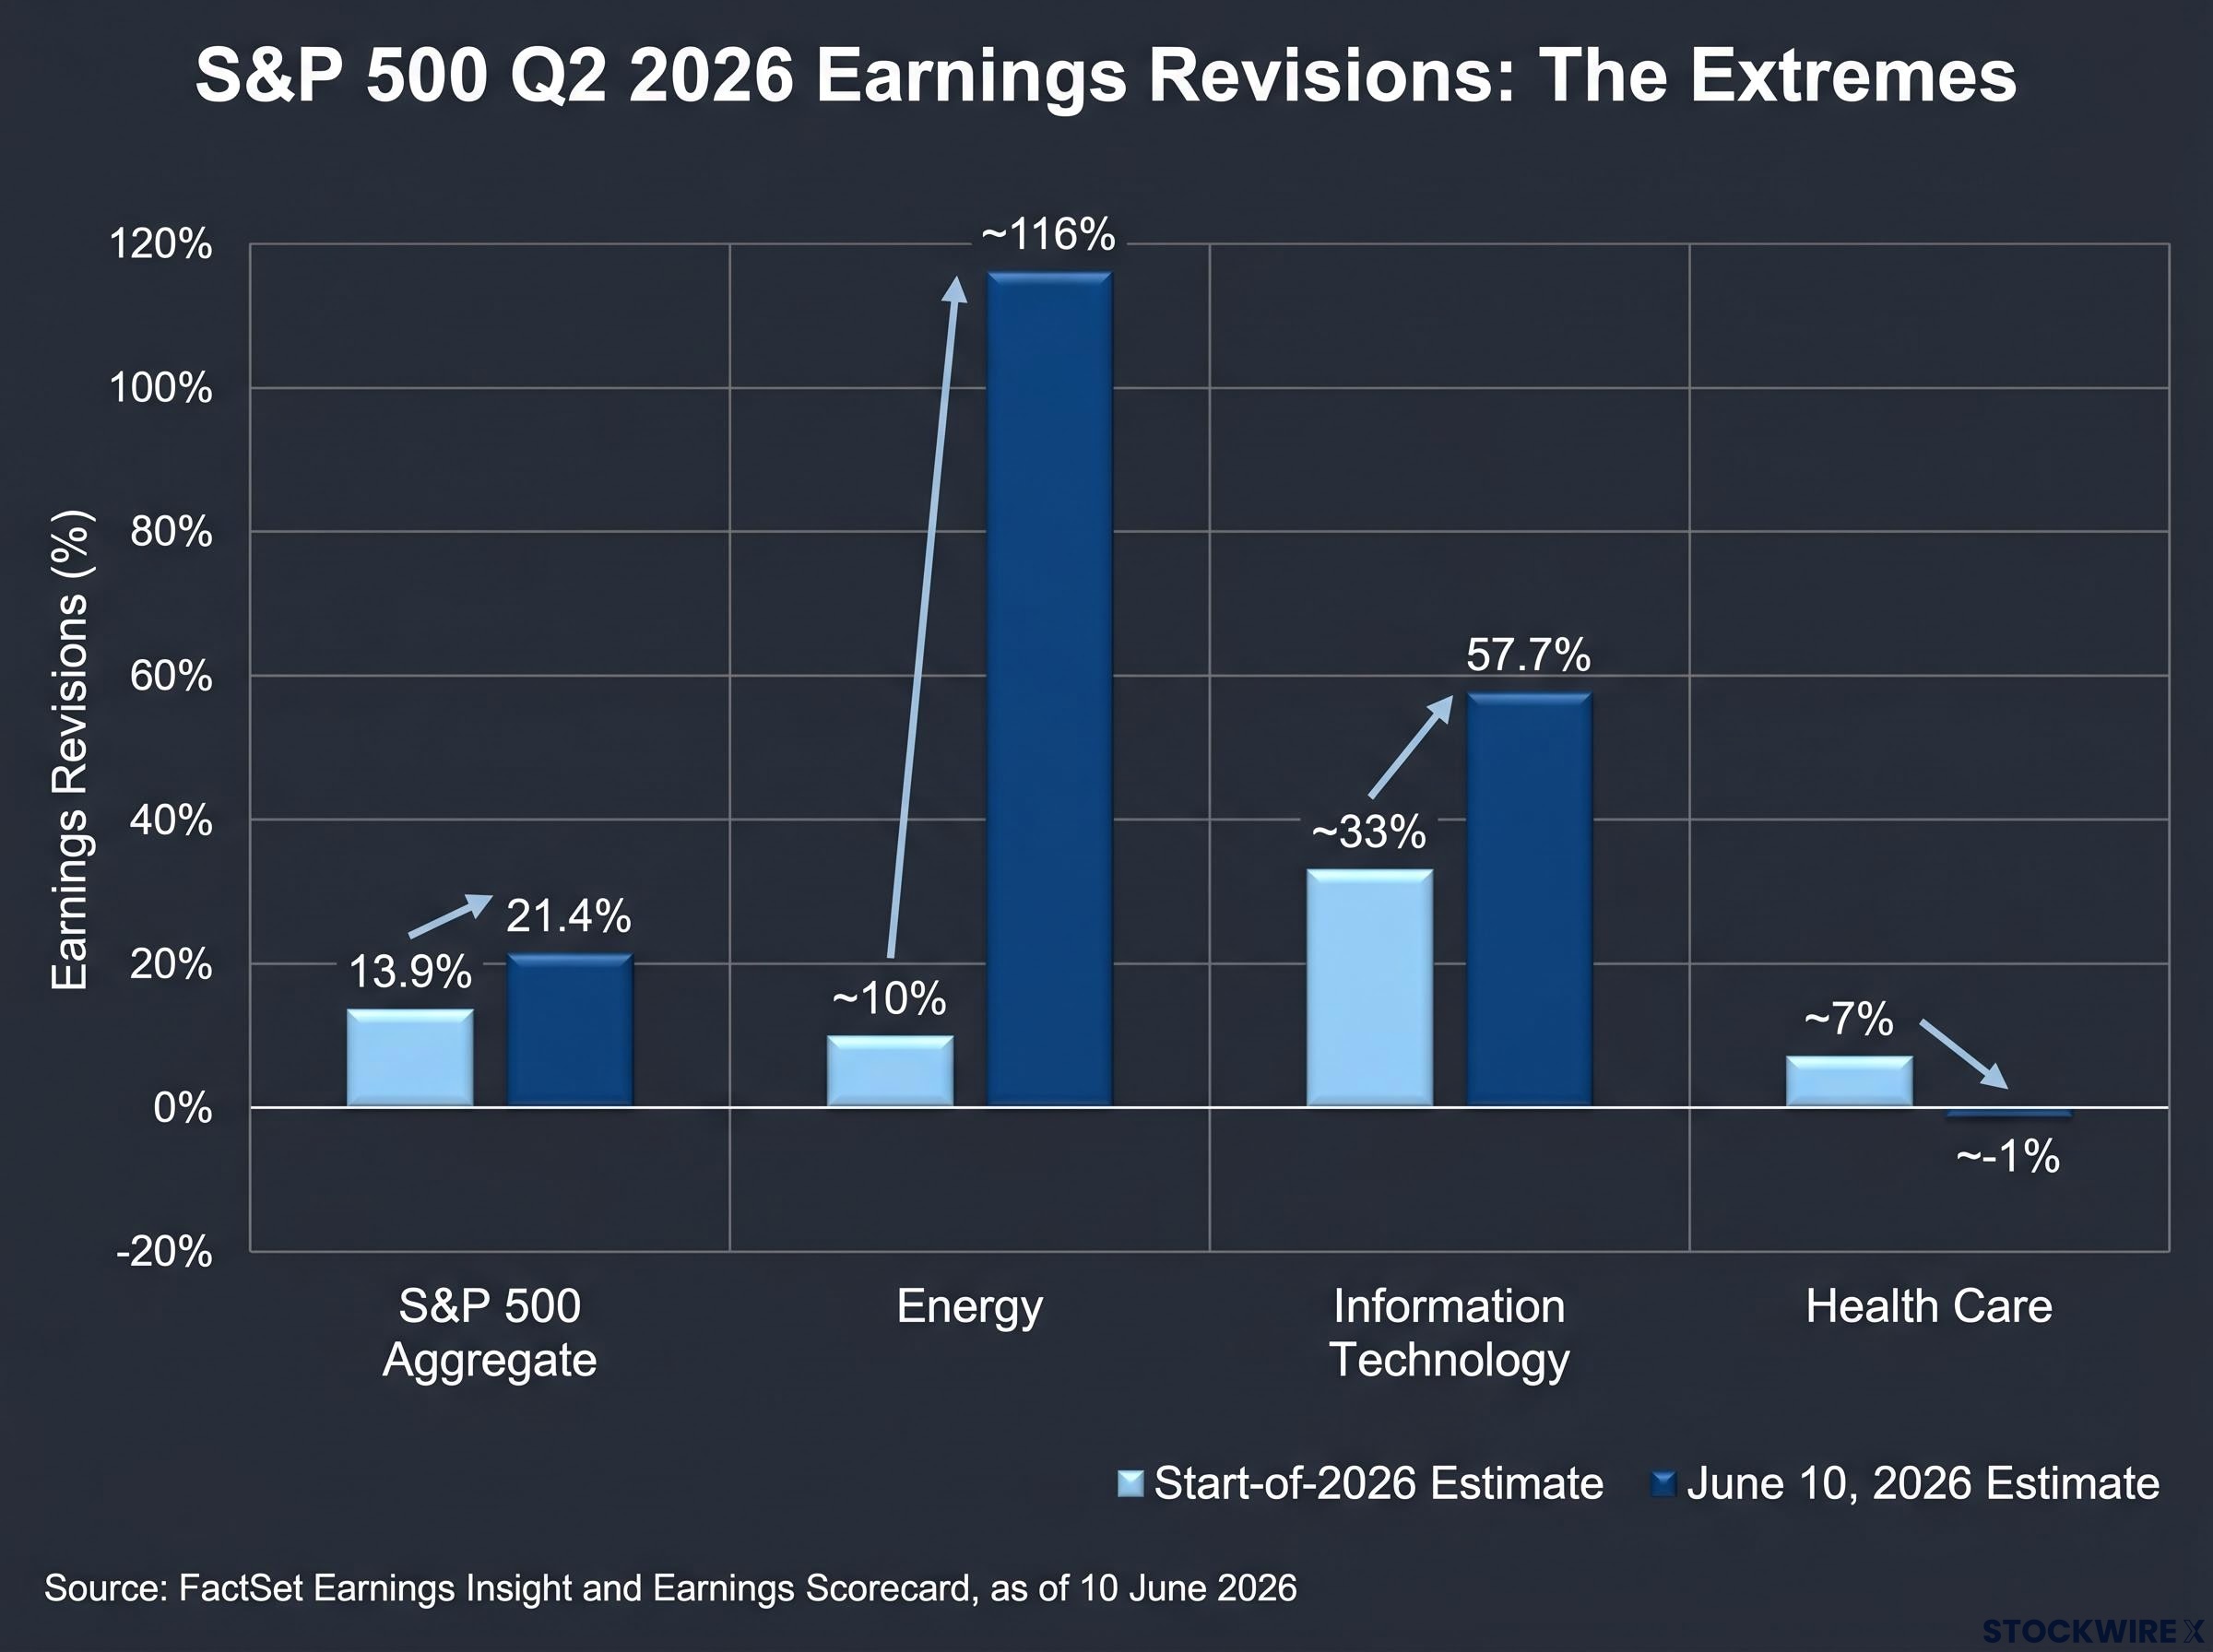
“S&P 500 Q2 2026 earnings growth projections rose from 13.9% to 21.4% since the start of 2026, but the gains were far from evenly shared.”
Three sectors absorbed the bulk of upward revisions: Information Technology (from roughly 33% to 57.7%), Energy (from roughly 10% to 116%), and Materials (from roughly 21% to 35%). The remaining eight sectors either held steady or deteriorated. Health Care swung from an expected 7% growth rate to a projected -1% decline. Industrials fell from 14% to 9%. Consumer Discretionary dropped from 9% to 5%, and Consumer Staples eased from 7% to 5%.
The FactSet Earnings Insight report tracking Q2 2026 estimates documents the revision trajectory in granular detail, recording the aggregate S&P 500 growth estimate at 18.7% as of March 31 before the wave of post-Q1 upward revisions carried it materially higher by mid-June.
The asymmetry is the analytical fact that matters. A rising aggregate figure built on two or three sectors is structurally different from one built on broad-based upgrades.
| Sector | Start-of-2026 Estimate | June 10, 2026 Estimate | Change | Direction |
|---|---|---|---|---|
| Information Technology | ~33% | ~57.7% | +24.7 pp | ↑ |
| Energy | ~10% | ~116% | +106 pp | ↑↑ |
| Materials | ~21% | ~35% | +14 pp | ↑ |
| Communication Services | ~6% | ~7% | +1 pp | ↑ |
| Utilities | ~15% | ~15% | 0 | → |
| Financials | ~5% | ~5% | 0 | → |
| Real Estate | ~5% | ~5% | 0 | → |
| Consumer Staples | ~7% | ~5% | -2 pp | ↓ |
| Consumer Discretionary | ~9% | ~5% | -4 pp | ↓ |
| Industrials | ~14% | ~9% | -5 pp | ↓ |
| Health Care | ~7% | ~-1% | -8 pp | ↓↓ |
| S&P 500 Aggregate | 13.9% | 21.4% | +7.5 pp | ↑ |
Source: FactSet Earnings Insight and Earnings Scorecard, as of 10 June 2026.
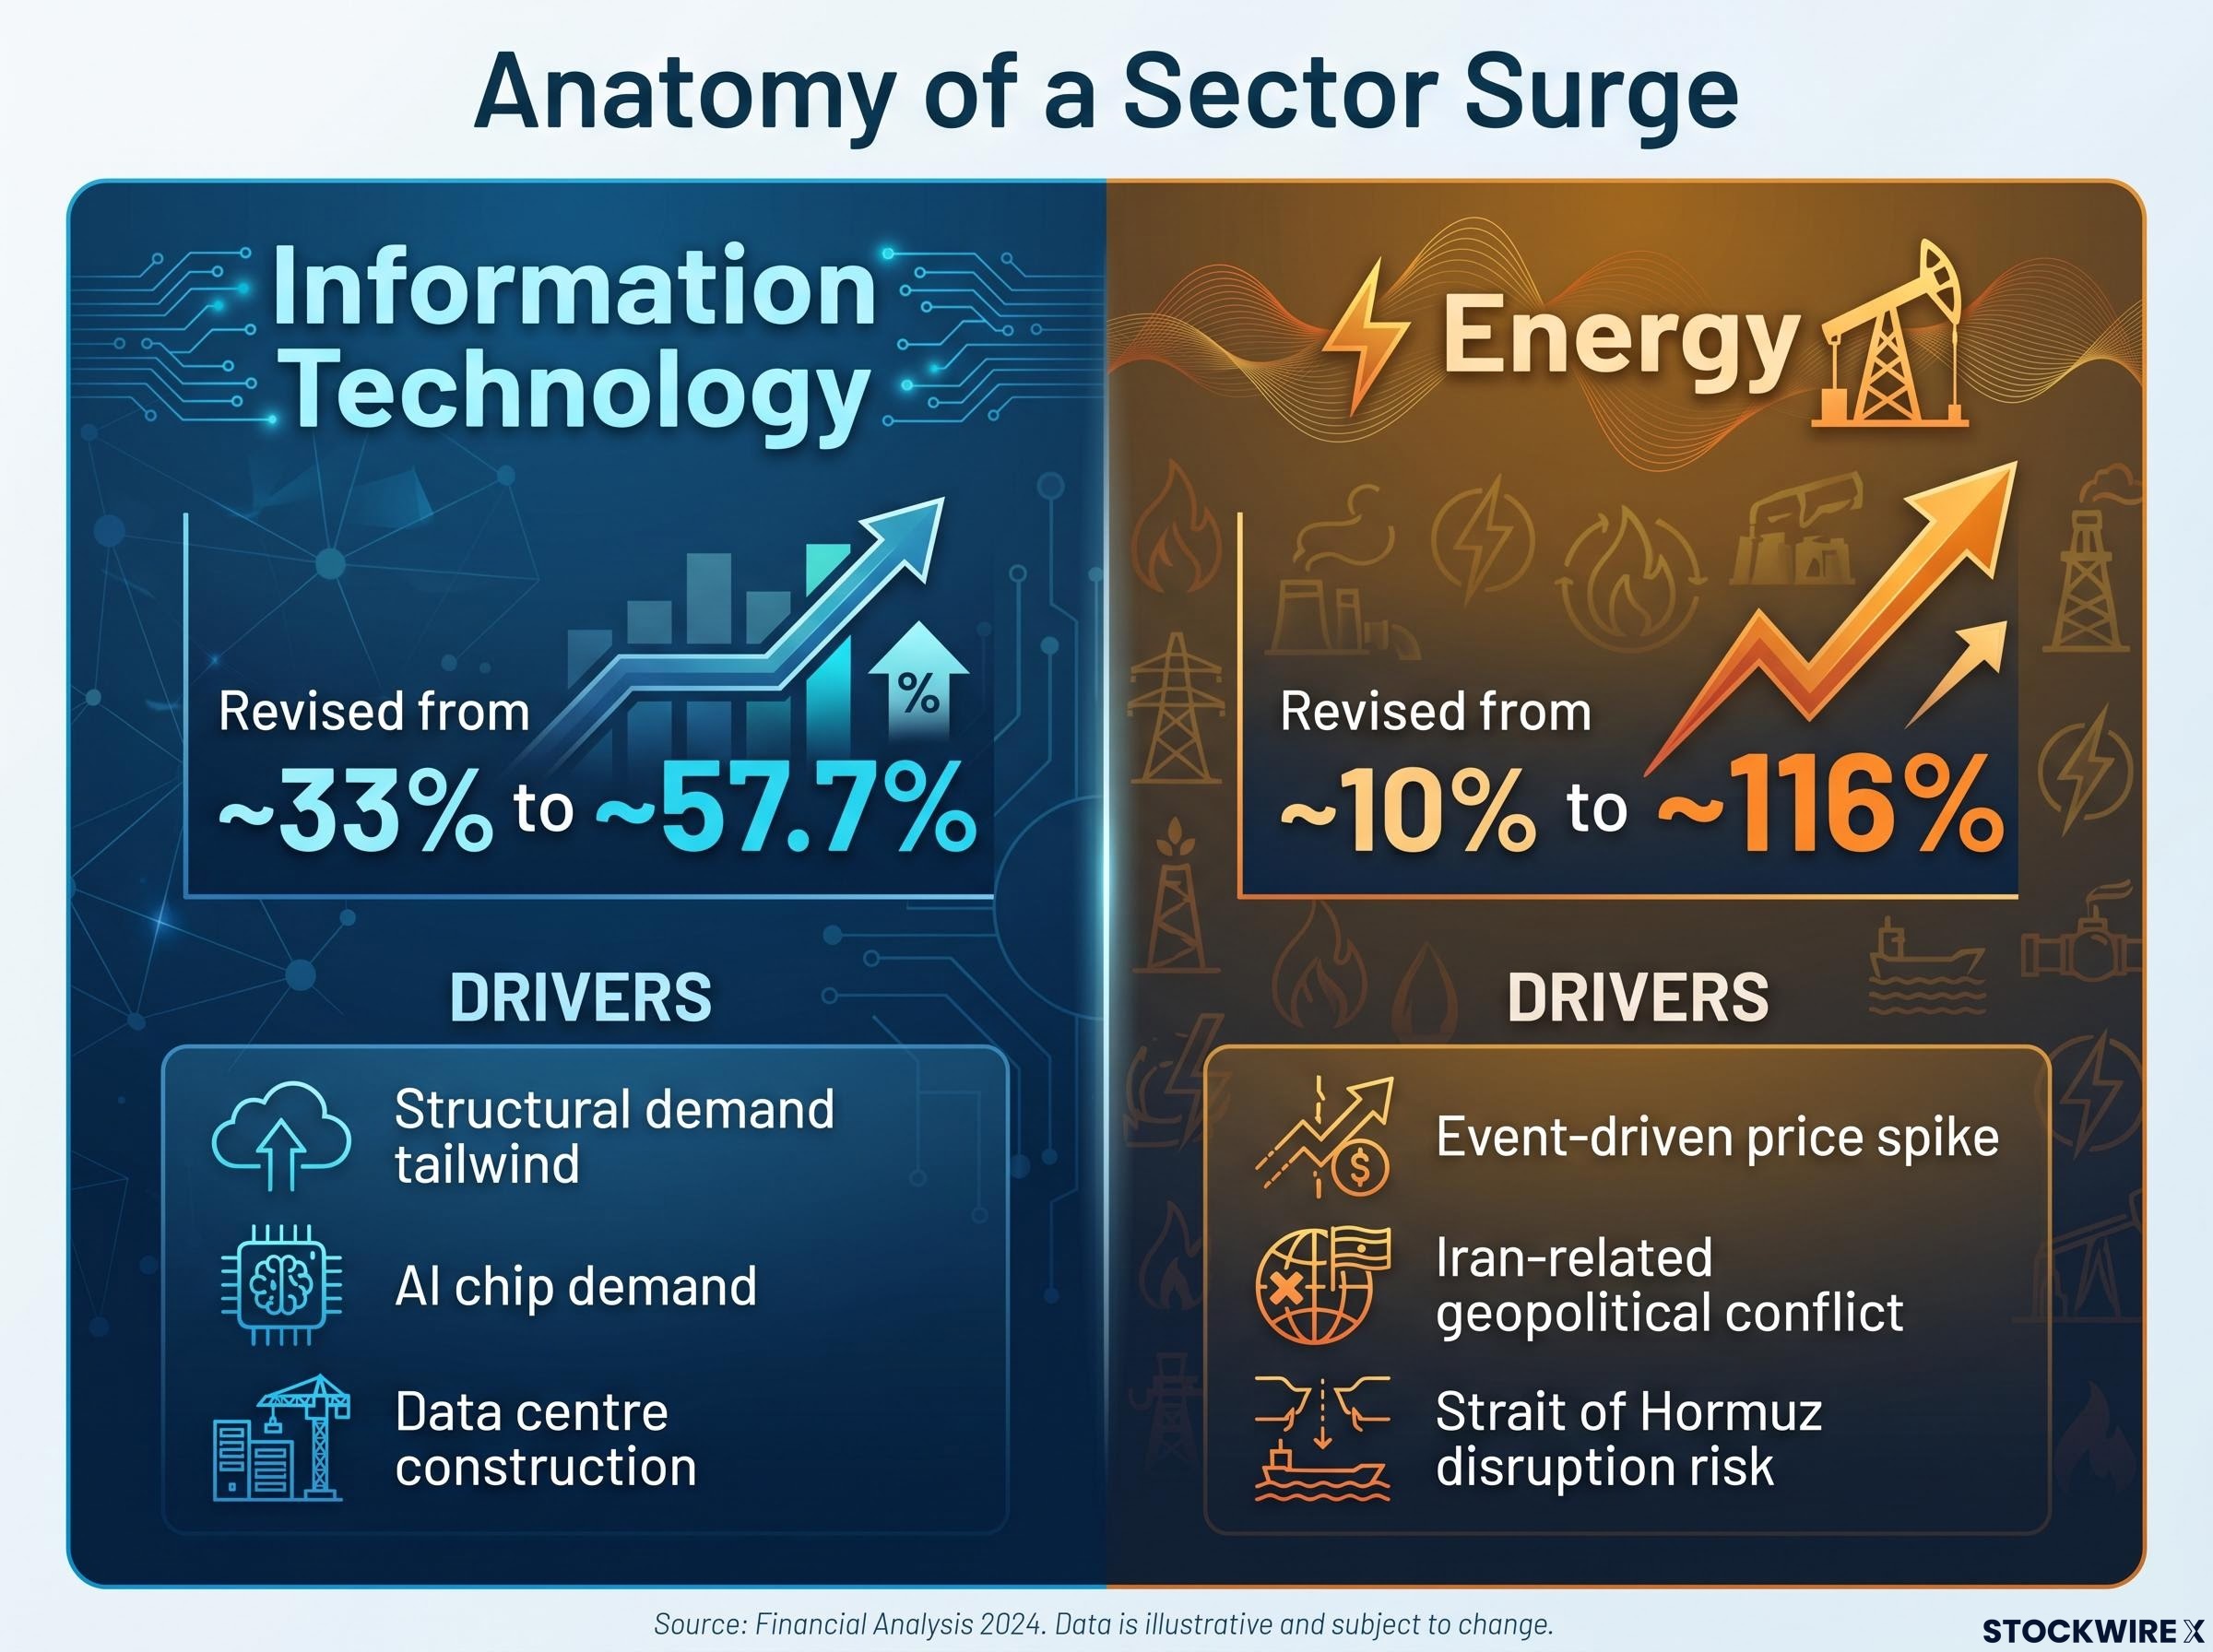
Both sectors were revised sharply higher. Both now carry outsized growth expectations. The resemblance ends there.
Hormuz disruption risk transmitted through oil futures pricing into corporate earnings models faster than historical geopolitical shocks, partly because futures markets had already begun incorporating tail-risk premiums before the full extent of vessel throughput restrictions became apparent.
The distinction matters because the forward risk profile of each revision is fundamentally different.
Information Technology was revised from roughly 33% to 57.7% on the back of sustained AI chip demand and robust data centre construction guidance. Each consecutive quarter of beats fed the next round of upward revisions, creating a self-reinforcing cycle.
That cycle now prices in near-58% earnings growth for Q2. The bar for further positive surprise has risen with each revision. Delivering another beat against a 33% consensus is a different proposition from delivering one against 57.7%. The structural demand story remains intact, but the threshold for the market to reward it has shifted materially higher.
Energy earnings projections surged from roughly 10% to 116% as Iran-related conflict elevated crude prices. Because oil and gas company profits track prevailing crude prices closely, the revision was mechanically predictable once prices rose.
Fisher Investments editorial staff characterised the Energy outlook shift as “broadly anticipated and likely already reflected in market pricing.” Investors considering Energy sector exposure at current valuations face the prospect of paying for expectations that are already embedded in share prices rather than positioning ahead of a surprise.
The instinct is to read a downward revision as a warning. The more useful reading, at this stage of the cycle, is as a lowered bar.
Four sectors saw their Q2 outlooks cut or compressed since the start of 2026:
The mechanism that makes these revisions analytically interesting is straightforward. Stock price movements are driven most by the gap between actual outcomes and prior expectations, not by the absolute level of earnings growth. A sector expected to grow 5% that delivers 8% produces a larger market reaction than a sector expected to grow 50% that delivers 52%.
Below-average expectations create asymmetric upside potential. If macro conditions stabilise, or if regulatory headwinds ease, these sectors face a lower bar to exceed consensus.
“The largest upside surprises in Q3 and beyond are more likely to come from sectors where the bar is currently low than from sectors where expectations are already elevated.” Fisher Investments, 18 June 2026
The sector-level data covered so far is not just a performance scorecard. It is a measurable expression of where investor sentiment currently sits.
The tilt of analyst enthusiasm toward growth-oriented sectors (Technology, Communication Services) and away from defensive categories (Consumer Staples, Health Care) is a pattern that carries diagnostic value. It tells the reader something about market-cycle positioning that raw earnings numbers alone do not.
Fisher Investments characterises the current sentiment environment as “warming but not yet euphoric,” a distinction that matters for interpreting where the bull market stands. Warming sentiment describes rising enthusiasm concentrated in growth-oriented sectors, the pattern visible in the Q2 revision data. Euphoria, by contrast, involves broad speculative excess across the entire market, where even weak companies attract capital simply because prices are rising.
Bull market euphoria, in the Templeton four-stage framework, describes a phase where broad speculative excess floods even structurally weak names with capital, a pattern the current sector revision data does not yet support given that defensive and cyclical names are being revised down rather than bid up indiscriminately.
The current distribution of expectations offers concrete evidence that euphoria has not arrived. Defensive and cyclical sectors are being revised down, not bid up. Capital is concentrating, not flooding indiscriminately.
A common inference when hearing “later-stage bull market” is that a bear market is imminent. Fisher Investments’ analytical framework pushes back on that reading directly: a later-stage bull market does not necessarily indicate an imminent transition to a bear market. Sentiment can remain elevated for extended periods while equity prices continue to rise.
The distinction is between stage and duration. A maturing cycle narrows leadership and concentrates expectations. That is what the data shows. It does not, on its own, set a timeline for reversal.
The expectation map laid out above creates a clear tension at the sector level. Technology and Energy carry elevated expectations that raise the threshold for further positive surprise. Health Care, Industrials, Consumer Discretionary, and Financials carry lower bars that create asymmetric setup potential.
Four considerations follow directly from the data:
| Sector Group | Current Expectation Level | Bar to Beat | Implication |
|---|---|---|---|
| High-Expectation (Technology, Energy) | Elevated | High; ~57.7% and ~116% already priced in | Risk of disappointment even on strong absolute results |
| Mid-Expectation (Materials, Communication Services, Utilities) | Moderate | Moderate; modest revisions leave room for beats | Neutral setup with selective opportunity |
| Low-Expectation (Health Care, Industrials, Consumer Discretionary, Financials, Consumer Staples) | Below average or declining | Low; consensus has already absorbed headwinds | Asymmetric upside if conditions stabilise |
At 21.4% projected aggregate growth, S&P 500 Q2 2026 earnings expectations look strong in absolute terms. The composition underneath that figure, concentrated upward revisions in a narrow set of sectors, declining outlooks in defensive and cyclical names, and warming sentiment that has not yet tipped into speculative excess, is more consistent with a maturing bull market than with either early-cycle breadth or late-cycle breakdown.
Fisher Investments characterises the current environment as warming but non-euphoric sentiment, consistent with a later-stage bull market that retains room to run.
Where expectations are concentrated tells investors as much about risk and opportunity as where earnings growth is strongest. The sectors carrying the most ambitious projections face the highest bar; the sectors carrying the most subdued projections face the lowest.
The next tests of this expectation map are identifiable: Q3 earnings season, the trajectory of global oil prices, and the finalisation of Medicare Advantage rates. Each has the capacity to redraw the current picture. Until then, the distribution of expectations itself is the signal.
For readers wanting to build a systematic framework around the cycle-phase dynamics described throughout this article, our comprehensive walkthrough of sector leadership patterns across business cycle phases covers the four rotation stages, Relative Rotation Graph methodology, and fund flow confirmation signals that institutional allocators use to translate sentiment readings into portfolio weights.
This article is for informational purposes only and should not be considered financial advice. Investors should conduct their own research and consult with financial professionals before making investment decisions. Past performance does not guarantee future results. Financial projections are subject to market conditions and various risk factors.
The stock market outlook for H2 2026 reflects a maturing bull market, with S&P 500 Q2 2026 earnings growth projected at 21.4%, but gains concentrated in Information Technology and Energy while defensive sectors like Health Care face declining expectations.
The upgrade from 13.9% to 21.4% was driven primarily by a blowout Q1 2026 earnings season, where the blended S&P 500 growth rate came in at 27.1%, nearly double the 13.1% analyst forecast, prompting analysts to revise Q2 estimates materially higher.
Energy leads with a projected 116% earnings growth rate for Q2 2026, driven by Iran-related geopolitical disruption lifting oil prices, while Information Technology follows at approximately 57.7%, supported by sustained AI chip and data centre demand.
When a sector's expectations are revised lower, the bar for a positive earnings surprise drops with them; a sector forecast to grow 5% that delivers 8% can generate a stronger market reaction than a sector forecast at 50% that delivers 52%, creating asymmetric upside for Health Care, Industrials, and Consumer Staples.
Warming sentiment describes rising enthusiasm concentrated in growth-oriented sectors, which is what the current Q2 2026 revision data shows, while euphoria involves broad speculative excess across the entire market, including structurally weak names, a pattern the data does not yet support.


