Why Australian Investors Keep Repeating the Same 4 Mistakes
4 hrs ago

Drone strikes on nuclear infrastructure. A major shipping lane running at 5-10% of normal capacity. Crude oil above $103 a barrel for the first time in years. The opening weeks of May 2026 have delivered a geopolitical supply shock, and markets from Tokyo to Sydney are already registering the tremors.
The Strait of Hormuz blockade, now sustained for nearly two months, has moved from a transient risk to a structural supply disruption. Combined with escalating attacks on Gulf energy and nuclear infrastructure, this is a compounding sequence of events that changes the calculus for inflation, interest rates, and equity valuations simultaneously. The mechanics of geopolitical risk and how it translates into real investment outcomes are no longer academic; they are unfolding in real time across every asset class.
What follows traces the specific transmission path from a blocked strait to portfolio losses, inflation pressure, and revised central bank timelines. It draws on the historical precedents that frame this shock’s severity and identifies the indicators investors should be tracking in the weeks ahead.
In normal conditions, roughly a fifth of the world’s traded oil passes through the Strait of Hormuz. In May 2026, vessel traffic through that chokepoint has been reduced to approximately 5-10% of normal throughput, according to reporting from the New York Times and Al Jazeera. The arithmetic is stark: this is not a marginal disruption that inventories can absorb over weeks.
What makes the current disruption structurally different from prior Hormuz incidents is the triple-lock closure mechanism: US naval operations, Iranian toll enforcement on non-US and non-Israeli vessels, and the near-total withdrawal of commercial war-risk insurance have combined to close the strait to standard commercial traffic even when physical passage was technically possible.
The EIA chokepoint analysis quantifies the strait’s structural importance, recording oil flows through Hormuz averaging approximately 20% of global petroleum liquids consumption, a baseline that makes the current 5-10% throughput reduction a supply event with few historical parallels.
The New York Times confirmed on 9 May 2026 that the strait is under an “effective blockade,” corroborated by Al Jazeera reporting on 6 May documenting severe traffic reduction and ongoing restrictions on global oil flows.
The sequence of events that produced this situation has been escalatory, not static:
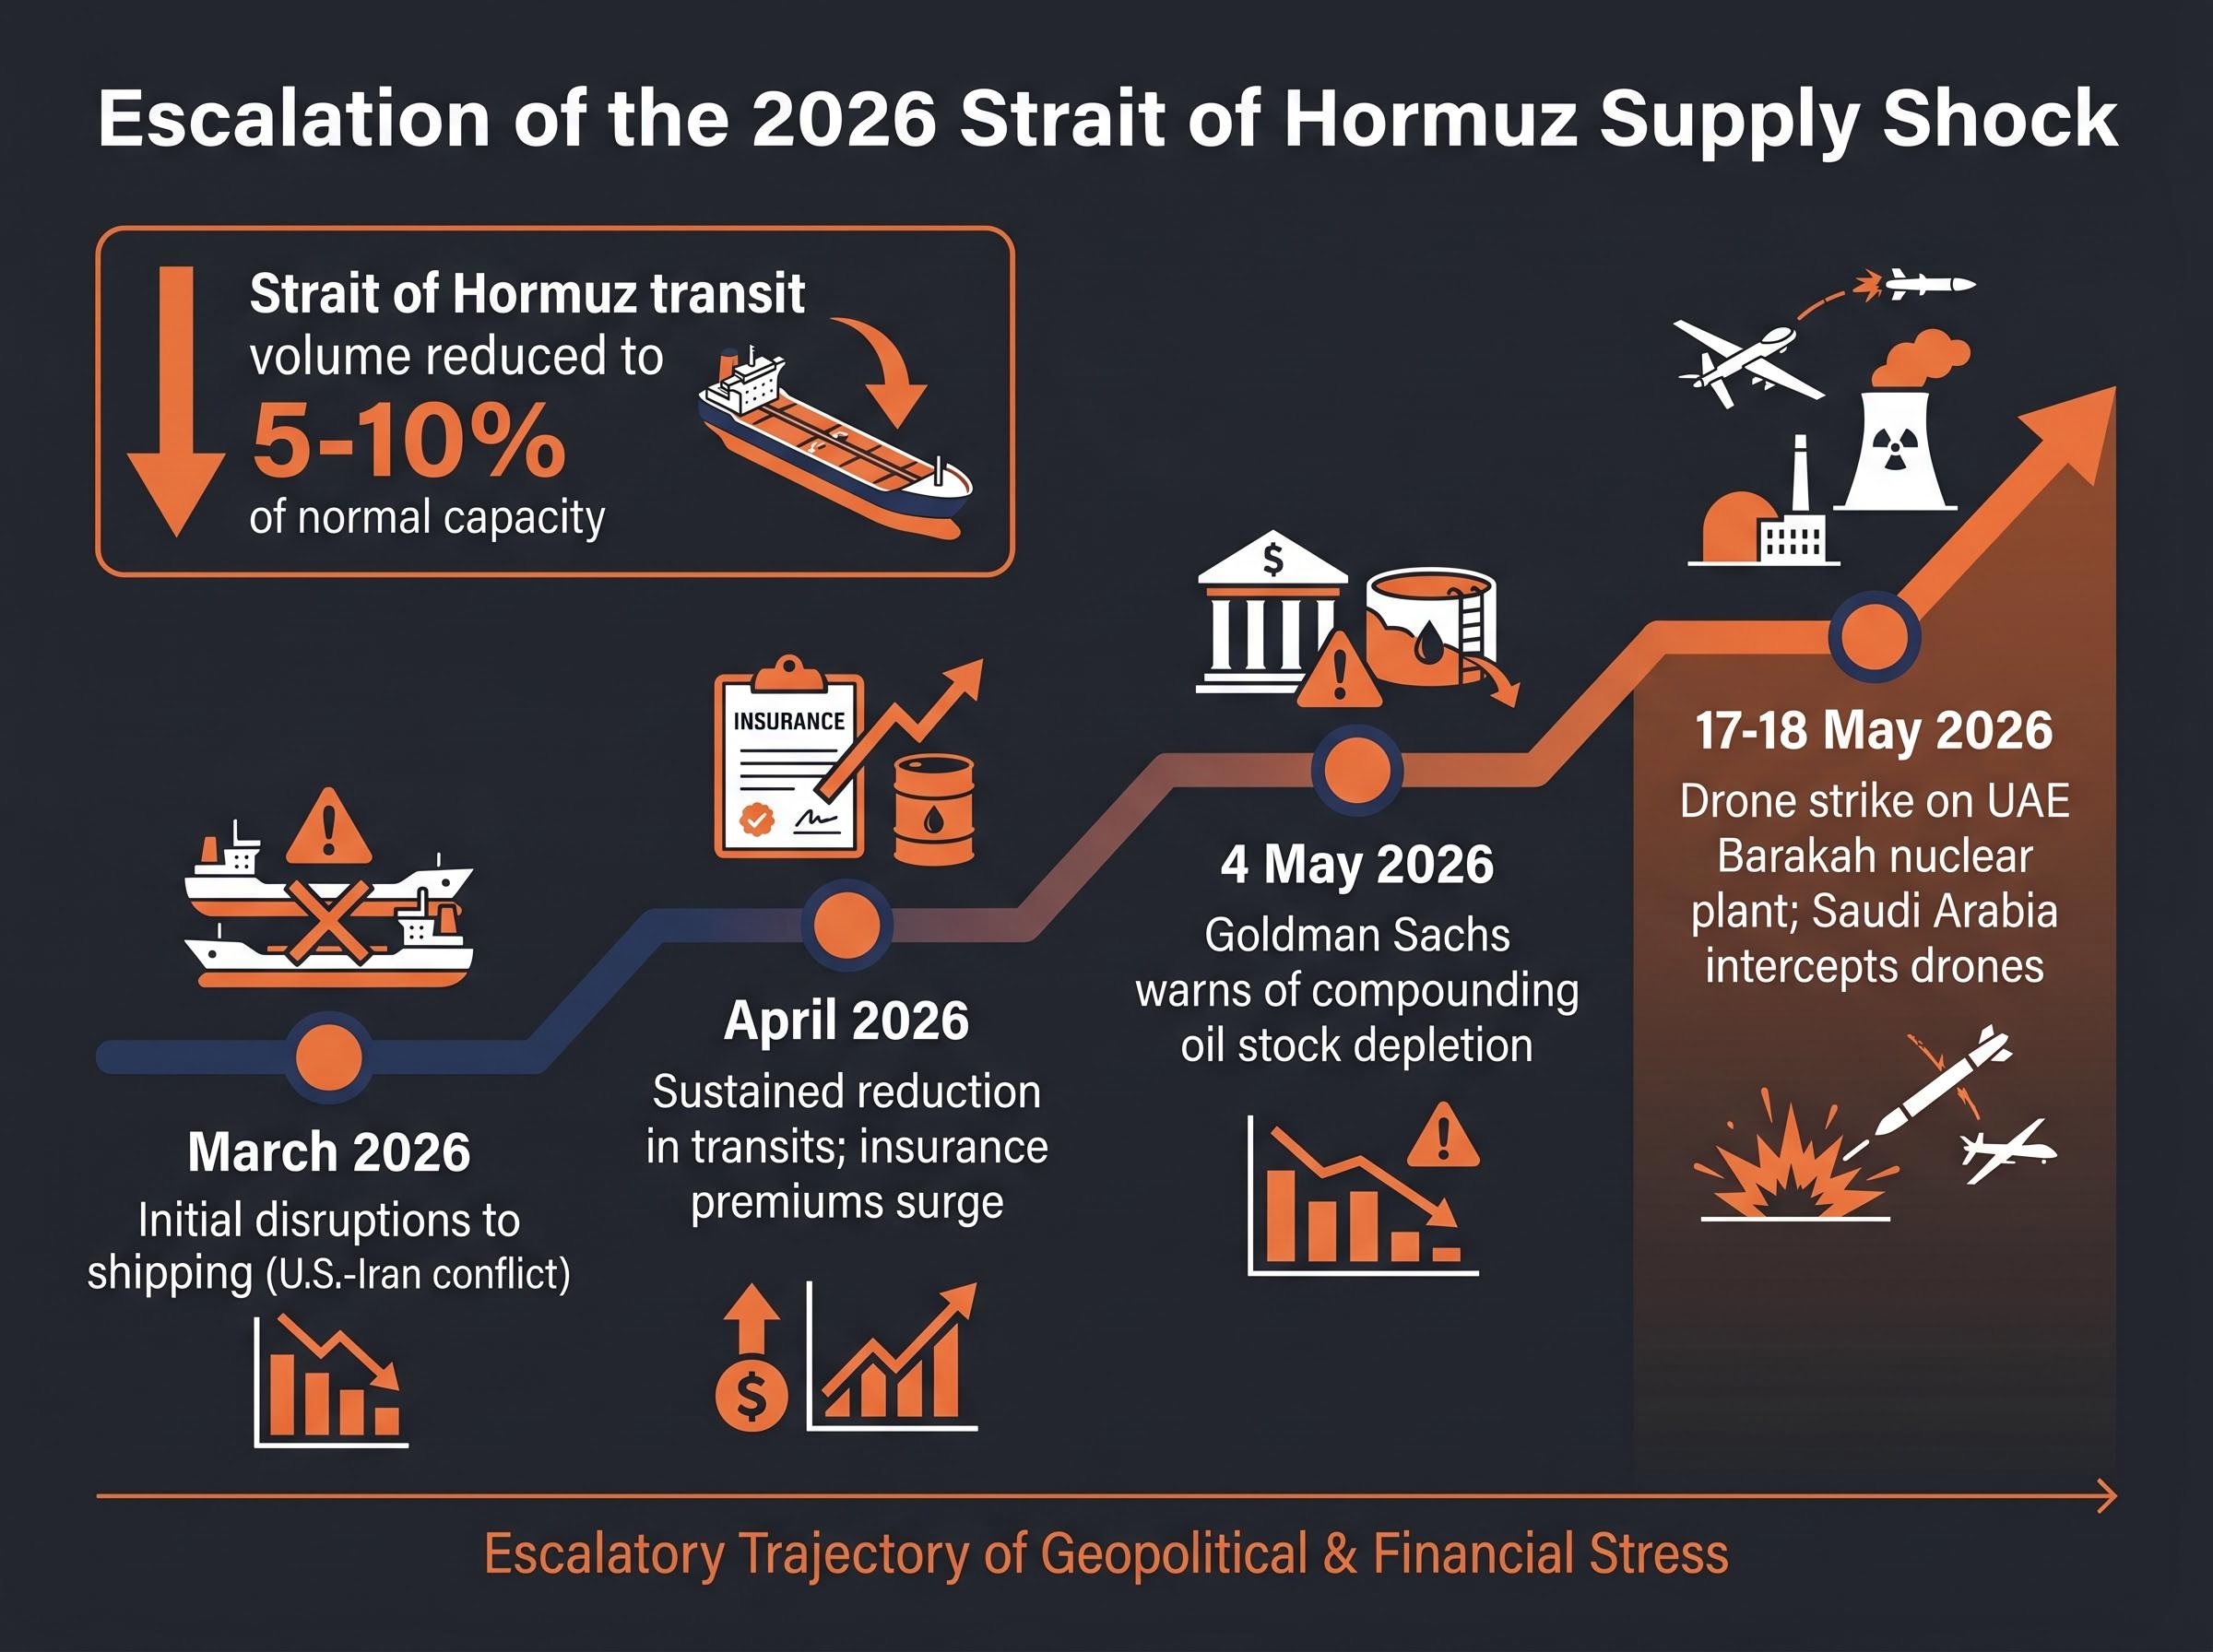
The price signal reflects the duration. WTI crude sits at $103.26-$103.68 per barrel. Brent is at $110.54-$111.29. These are not panic spikes from a single event. They are the market repricing for a sustained supply gap that has been widening for approximately two months, and one that Goldman’s depletion analysis suggests existing buffers are not equipped to close.
Oil does not stay in oil markets. Its price radiates outward through a series of linked channels, each with a different speed and magnitude. The International Energy Agency’s May 2026 report framed the current shock as a present supply crisis requiring active sheltering responses from policymakers, a characterisation that reflects the agency’s assessment that this is already transmitting beyond energy markets.
The most immediate channel is direct. Fuel costs at the pump rise within days of a sustained crude price increase. Utility bills follow within weeks as wholesale energy contracts reprice. Transport and logistics costs, which underpin the pricing of nearly every physical good, begin adjusting within one to two months as freight operators pass through fuel surcharges.
These first-round effects are visible in consumer price indices relatively quickly. The 2022 Russia-Ukraine energy shock, documented extensively in ECB and IMF literature, showed European economies registering direct energy pass-through within four to six weeks of the initial supply disruption.
The harder problem for central banks begins when oil-driven inflation becomes embedded. Sustained high energy costs alter wage negotiation dynamics as workers seek compensation for eroded purchasing power. Business input costs rise across petrochemical products, fertilisers, and agricultural production, creating price pressures in sectors far removed from oil.
The 1973-74 OPEC embargo and the 1990-91 Gulf War spike sit at opposite ends of the severity spectrum for these second-round effects. The embargo triggered a multi-year inflationary spiral; the Gulf War spike reversed within months before second-round effects fully materialised. Where the 2026 episode lands on that spectrum depends on duration, which is why the sustained nature of the Hormuz blockade matters more than the peak price.
IMF analysis of energy price pass-through to consumer inflation, drawing on the 2021-2022 global surge, documents how quickly and broadly oil-driven cost increases embedded into core price indices across both advanced and emerging economies, providing the empirical baseline against which the current shock’s second-round trajectory can be assessed.
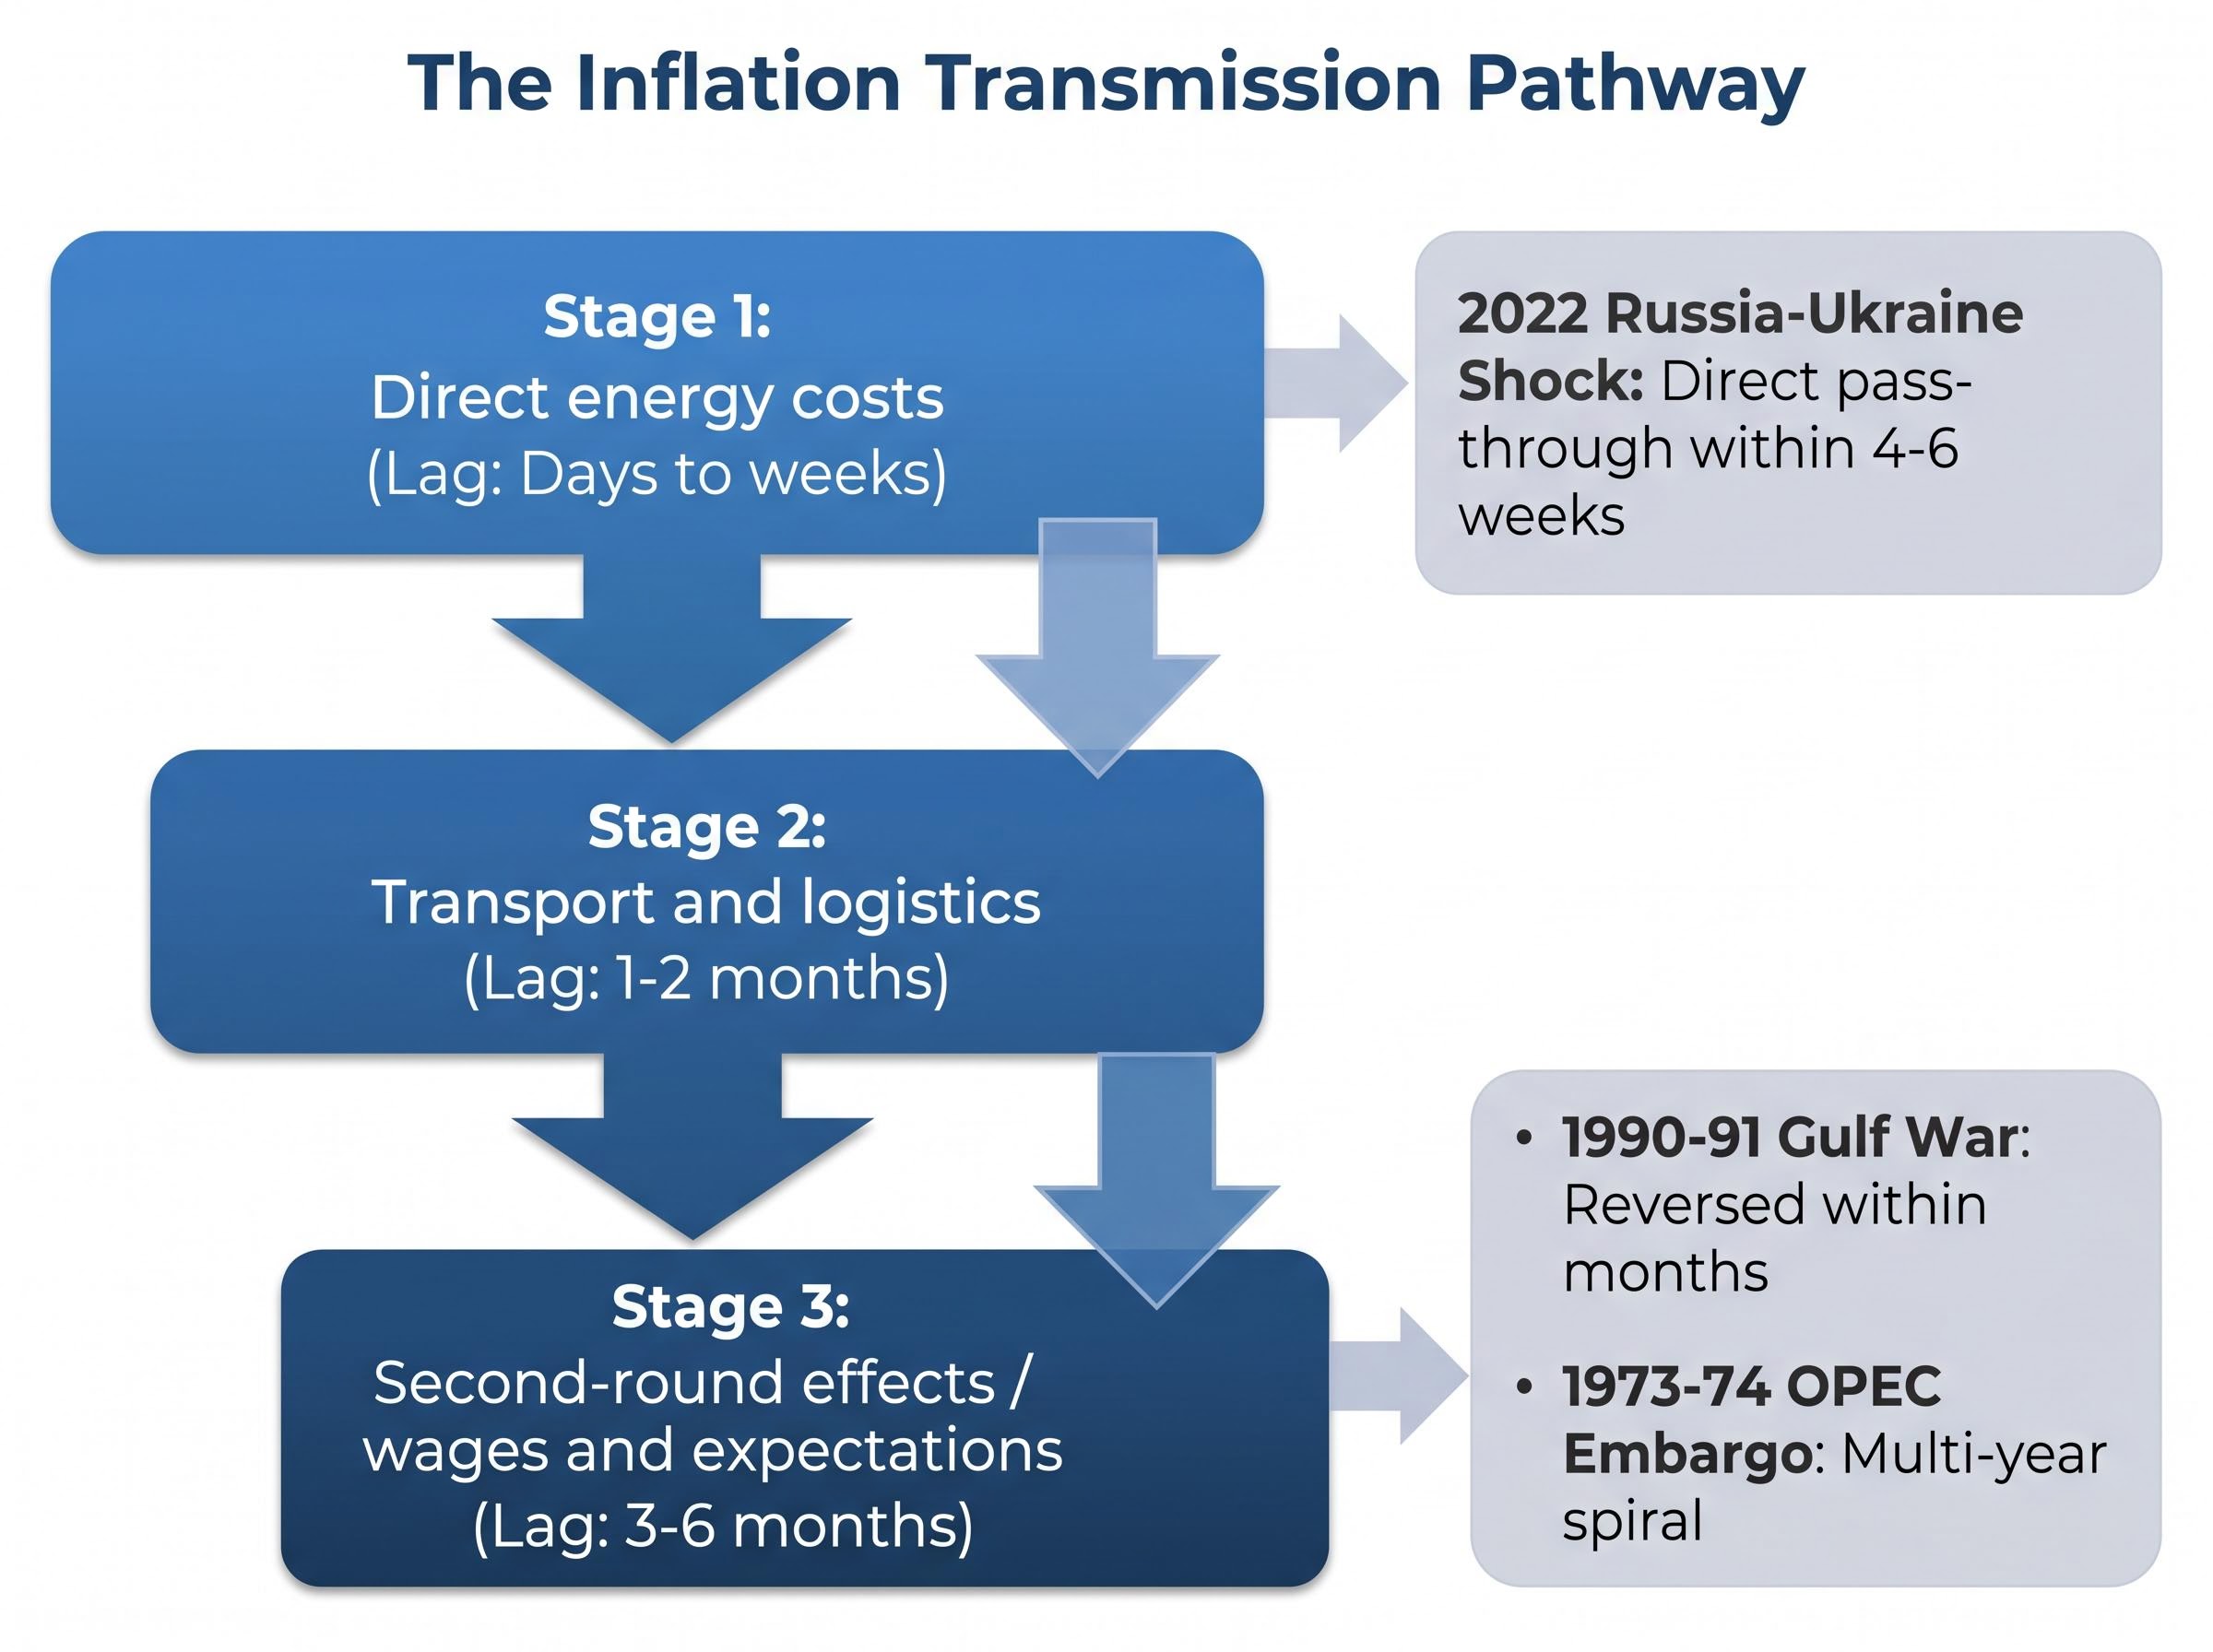
| Stage | Mechanism | Typical Lag |
|---|---|---|
| Direct energy costs | Fuel, utilities, and freight reprice as wholesale crude rises | Days to weeks |
| Transport and logistics | Freight surcharges pass through to goods pricing across supply chains | 1-2 months |
| Second-round (wages and expectations) | Workers demand compensation; businesses embed higher input costs into long-term pricing | 3-6 months |
It is worth noting transparently that specific mid-2026 quantified CPI pass-through estimates are not yet available in published analyst projections. The ECB Economic Bulletin and IMF staff reports are the live sources to monitor for those numbers as they emerge.
ECB Chief Economist Philip Lane made the policy implications explicit on 13 May 2026, directly linking the Iran war-driven oil shock to the potential for rate hikes. His statement, reported by Reuters, is the clearest named official signal on the record that this is no longer just a commodity story.
Philip Lane, ECB Chief Economist (13 May 2026): The oil shock driven by the Iran conflict has introduced the potential for rate increases, as energy price uncertainty feeds directly into the inflation outlook for the eurozone.
The timing is what makes the policy dilemma acute. Central banks in 2025 had been building a disinflation narrative, with markets pricing in a gradual easing cycle. The sustained oil shock disrupts that trajectory and forces a reassessment that is already visible in volatility pricing.
The FOMC internal fracture complicates the rate-path analysis further: the largest dissenting bloc since 1992 features hawks and doves pulling in opposite directions simultaneously, with incoming Chair Kevin Warsh set to inherit a committee divided across three distinct positions on a rate path that the oil shock has made materially harder to communicate with credibility.
The VIX at approximately 18-19 as of mid-May reflects this environment: elevated policy uncertainty priced across bond and equity markets, but not yet full-scale panic. The market is watching central banks as closely as it is watching the strait.
Geopolitical risk is a distinct category of market risk. Unlike an earnings miss or a macro data release, it resists precise quantification, arrives without a scheduled date, and transmits through multiple channels simultaneously. That combination is why portfolio moves during geopolitical episodes often feel disconnected from company-level fundamentals.
Three primary channels explain how a geopolitical event reaches a portfolio:
The current episode’s cross-asset fingerprint on 18 May 2026 illustrates all three channels operating at once. Asian equity markets registered broad declines: the Hang Seng fell approximately 1.7% (with the Hang Seng Tech sub-index down approximately 2.5%), the Nikkei 225 dropped approximately 1%, the ASX 200 fell approximately 1.6%, and the CSI 300 declined approximately 1%, according to Investing.com.
JPMorgan Asset Management’s May 2026 commentary addressed these cross-asset dynamics directly, noting how the oil shock is transmitting across equities, bonds, and currencies in oil-importing economies.
| Transmission Channel | Mechanism | May 2026 Evidence |
|---|---|---|
| Commodity price shock | Supply disruption reprices oil; costs transmit to inflation and margins | Brent at $110+; WTI above $103 |
| Risk-sentiment repricing | Uncertainty raises the cost of holding risk assets | VIX at 18-19; broad Asian equity sell-off on 18 May |
| Policy response shift | Central banks alter rate path; fiscal responses change regulatory environment | ECB’s Lane links oil shock to rate-hike potential on 13 May |
One counter-example is instructive. South Korea’s KOSPI gained approximately 0.2% on the same day, driven by Samsung’s approximately 3.97% rally on progress in a labour dispute. Idiosyncratic factors can partially offset macro headwinds at the country level, a reminder that geopolitical transmission is powerful but not uniform.
China’s April 2026 data arrived into this environment like a second weight on an already stressed structure. Industrial output grew 4.1% year-on-year, well below the 6.0% forecast. The retail sales figure was starker.
China retail sales (April 2026): 0.2% year-on-year growth versus 2.0% expected, the most pronounced miss of the year and a signal that domestic demand momentum has weakened materially.
The intuition that weaker Chinese demand should offset oil’s inflationary pressure is tempting but incomplete. Reduced demand from the world’s largest crude importer may moderate the pace of oil’s rise, but it does not cancel the supply-side inflation already transmitting through energy costs, logistics, and petrochemical inputs in economies that are still consuming at closer to normal levels.
What the China data introduces is genuine policy ambiguity. A supply shock arriving alongside weakening demand in the world’s second-largest economy creates a stagflationary undertone: prices rising while growth decelerates. Ongoing tariff and trade friction headwinds provide additional structural drag. For investors in emerging markets and commodity-importing economies, this confluence is harder to position around than either problem in isolation.
The variables that will determine whether this shock escalates or begins to resolve are identifiable and trackable. Four indicators deserve priority monitoring, ordered by immediacy:
The difference between a short-duration shock (the 1990-91 precedent, where oil normalised within months) and a structural repricing (the 1973-74 precedent, where inflation persisted for years) depends on how these four variables evolve. Investors tracking them are positioned to make better-timed decisions than those reacting to daily price swings.
For investors tracking the outer boundary of this shock’s consequences, our deep-dive into the June 2026 recession risk threshold examines BCA Research’s seven-factor framework identifying why global GDP data has held up so far, why June marks the point at which inventory depletion, lag-effect closure, and futures market repricing converge, and how institutional recession probability estimates ranging from 20% to 70% bracket the range of outcomes if the Hormuz closure persists.
The IEA has characterised the current situation as a “present supply crisis” requiring active policymaker response, a framing that suggests the agency does not view this as a transient disruption likely to self-correct.
The analytical thread running through this episode is specific and traceable: a geopolitical event disrupts a commodity supply route, which drives energy prices higher, which transmits into consumer inflation, which forces central banks to reconsider their rate path, which reprices equities and bonds simultaneously. The May 2026 Hormuz blockade is following that transmission path in real time.
What distinguishes this episode from shorter-lived precedents is its duration and geographic escalation. Drone strikes on nuclear infrastructure, a sustained two-month blockade, and oil above $100 for weeks rather than days make the 1990-91 short-duration template a less reliable guide than the 2022 energy crisis precedent.
The resolution variables are known: Hormuz throughput, central bank signals, diplomatic progress, and whether equity markets find sectoral counterweights. Monitoring those indicators is itself a form of risk management, and a more productive one than reacting to each morning’s price move.
This article is for informational purposes only and should not be considered financial advice. Investors should conduct their own research and consult with financial professionals before making investment decisions. Past performance does not guarantee future results. Financial projections are subject to market conditions and various risk factors.
Geopolitical risk investing refers to the practice of analysing how political events, conflicts, and supply disruptions transmit into asset prices across equities, bonds, and commodities. Events like the 2026 Strait of Hormuz blockade illustrate how a single geopolitical shock can simultaneously reprice oil, trigger inflation, and force central banks to revise interest rate paths, hitting portfolios across multiple channels at once.
The Strait of Hormuz carries roughly 20% of globally traded oil, so a sustained blockade creates an immediate supply gap that drives crude prices higher; in May 2026, WTI rose above $103 and Brent above $110. Higher crude prices then transmit into fuel costs, freight surcharges, and eventually wages and core consumer prices, a process that typically completes over a three to six month window.
The four priority indicators are Hormuz vessel throughput data, central bank communications from the ECB and Federal Reserve on rate-path revisions, diplomatic developments between the US and Iran, and equity market earnings results that test whether sector-level momentum can offset geopolitical risk-off sentiment.
The 1973-74 OPEC embargo triggered a multi-year inflationary spiral with persistent second-round effects on wages and prices, while the 1990-91 Gulf War oil spike reversed within months before those effects fully materialised. The 2026 Hormuz disruption more closely resembles the sustained 2022 energy crisis than the short-duration 1990 precedent, largely because the blockade has already persisted for approximately two months.
China's April 2026 retail sales grew only 0.2% year-on-year against a 2.0% forecast, and industrial output missed sharply, reducing demand from the world's largest crude importer. However, softer Chinese demand does not cancel the supply-side inflation already embedded in energy, logistics, and petrochemical costs elsewhere, and the combination of rising prices and slowing growth creates a stagflationary dynamic that is particularly difficult for investors to position around.