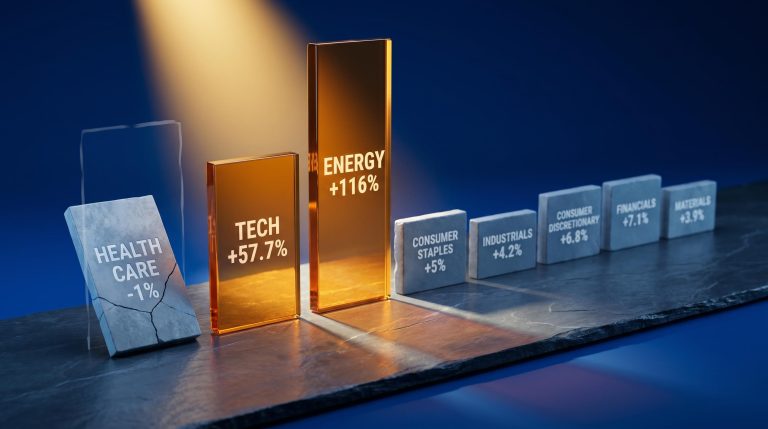
Why the S&P 500 Earnings Surge Is Narrower Than It Looks
1 hr ago

A $10,000 investment in Commonwealth Bank of Australia (ASX: CBA) shares five years ago is worth $17,769 today in nominal terms. That headline figure, though, is only half the story.
On 18 June 2021, CBA shares were trading at $103.69. Five years on to the day, they sit at $162.89. In between, the bank paid ten fully franked dividends, inflation eroded purchasing power by roughly 22.6%, and a generation of retail investors discovered that share price charts do not capture the full picture of what long-term equity ownership actually delivers.
What follows breaks down exactly what a $10,000 CBA investment from five years ago is worth today across three measures: capital appreciation, dividend income, and real purchasing power after inflation. It also explains why retail investors who track only share price are systematically undercounting their returns.
The starting point is straightforward. A $10,000 purchase at $103.69 per share on 18 June 2021 acquired 96 shares, with a small residual cash balance. Five years later, those shares are priced at $162.89 each.
The core price data:
That 57.1% gain is a strong result on its own terms. But it becomes more striking when measured against the broader market.
Over the same five-year window, CBA more than doubled the return of the S&P/ASX 200 Index (ASX: XJO). For a large-cap financial stock, outperforming the index by that margin over a sustained period is a material outcome, not a rounding error.
Market commentary has attributed part of that outperformance to effective management and CBA’s dominant competitive position within Australian banking. The bank held the title of Australia’s largest ASX-listed company by market capitalisation for much of the period, a position it recently ceded to BHP Group Ltd (ASX: BHP).
Price appreciation, however, is only the most visible component of equity returns. It is not the complete picture.
Over the five-year holding period, CBA made ten fully franked dividend payments to shareholders. The cumulative payout totalled $22.20 per share, delivering $2,131 in cash income on the 96-share holding.
That figure reshapes the return picture. Without dividends, the portfolio shows a capital value of $15,637. With dividends included, the nominal total reaches $17,769, an increase of approximately 13.6% above the capital-only figure.
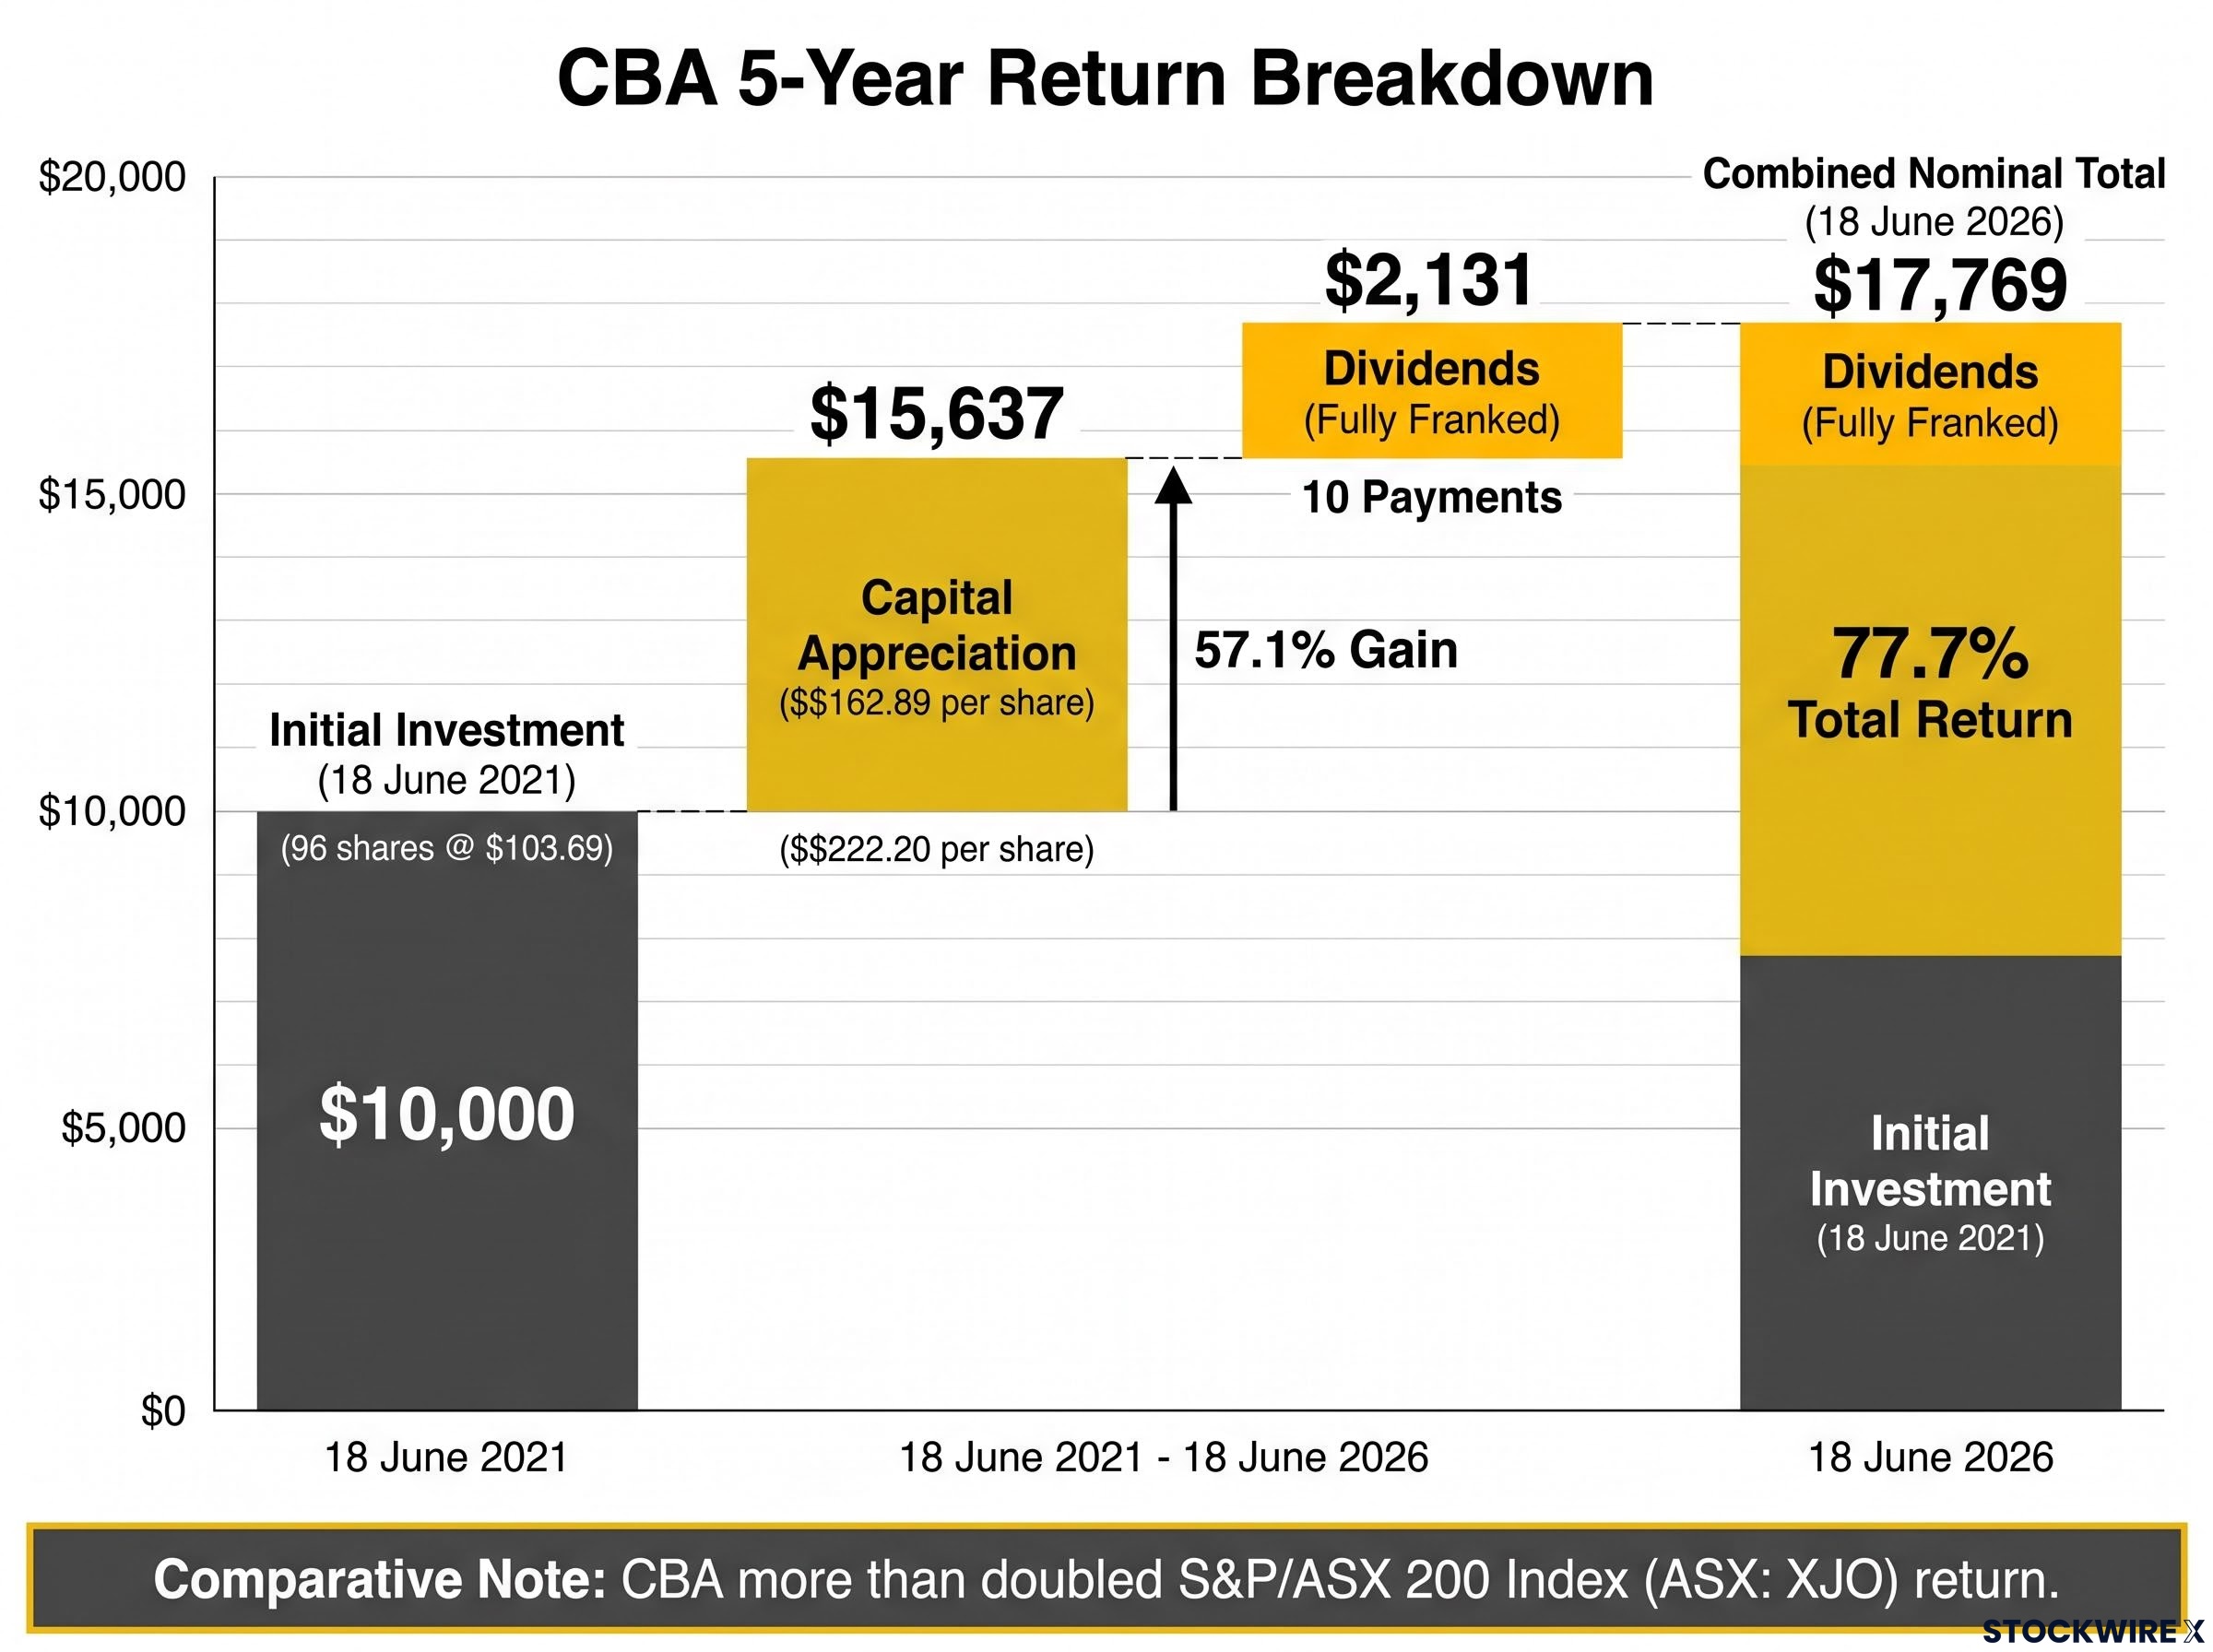
Nominal total return: approximately 77.7% over five years.
The gap between 57.1% (price only) and 77.7% (total return) is the dividend contribution that a share price chart never shows.
CBA dividend forecasts project the payout rising from $4.65 per share in FY2024 to $5.45 in FY27, a trajectory that shifts the income maths significantly for investors now assessing what future distributions might deliver relative to today’s entry price.
| Component | Value |
|---|---|
| Capital value (96 shares × $162.89) | $15,637 |
| Total dividends received (cash) | $2,131 |
| Combined nominal total | $17,769 |
Full franking credits on all ten distributions add further value not reflected in the cash figures above, particularly for eligible Australian resident shareholders. That mechanism warrants its own explanation.
Australia’s dividend imputation system is one of the distinguishing features of the local equity market. It exists to prevent corporate profits from being taxed twice: once at the company level and again in the hands of the shareholder.
The mechanism works in three steps:
The ATO guidance on franking credit refunds sets out the eligibility conditions under which individual shareholders can offset franking credits against their personal tax liability and receive a cash refund where credits exceed tax owed, a mechanism that materially increases the effective yield of fully franked dividends for low-income earners and SMSF members in pension phase.
CBA’s dividends across all ten distributions in this period were fully franked. That means the cash dividend figures in this analysis understate the total economic benefit to eligible Australian shareholders.
Shareholders with marginal tax rates below the 30% corporate rate receive the greatest benefit. Self-managed superannuation funds (SMSFs) in accumulation phase (taxed at 15%) and retirees with low taxable income are among the primary beneficiaries, as the gap between the corporate rate and their personal rate translates into a cash refund.
The grossed-up yield on bank shares is the honest baseline for income comparisons, not the cash dividend figure quoted on most broker screens; pension-phase SMSF members receive franking credits as a direct ATO cash refund rather than a tax offset, making the gap between Australian bank income and international alternatives widest for this investor group.
Non-resident investors cannot claim franking credits, making this a distinctly Australian structural advantage for domestic shareholders.
A brokerage statement shows the $17,769 nominal total. It does not show the purchasing power that inflation removed along the way.
Between June 2021 and June 2026, cumulative Australian inflation ran at approximately 22.6% (estimates range from 22.3% to 22.9% depending on the data source and exact measurement dates). That means every dollar from 2021 buys roughly 18% less today.
Adjusting the nominal total for that erosion, the $17,769 holds a real value of approximately $14,493 in 2021 purchasing power. The real return over five years: approximately 50%.
The contrast sharpens against a cash alternative.
An uninvested $10,000 left in cash from June 2021 would hold a real value of only approximately $8,156 today.
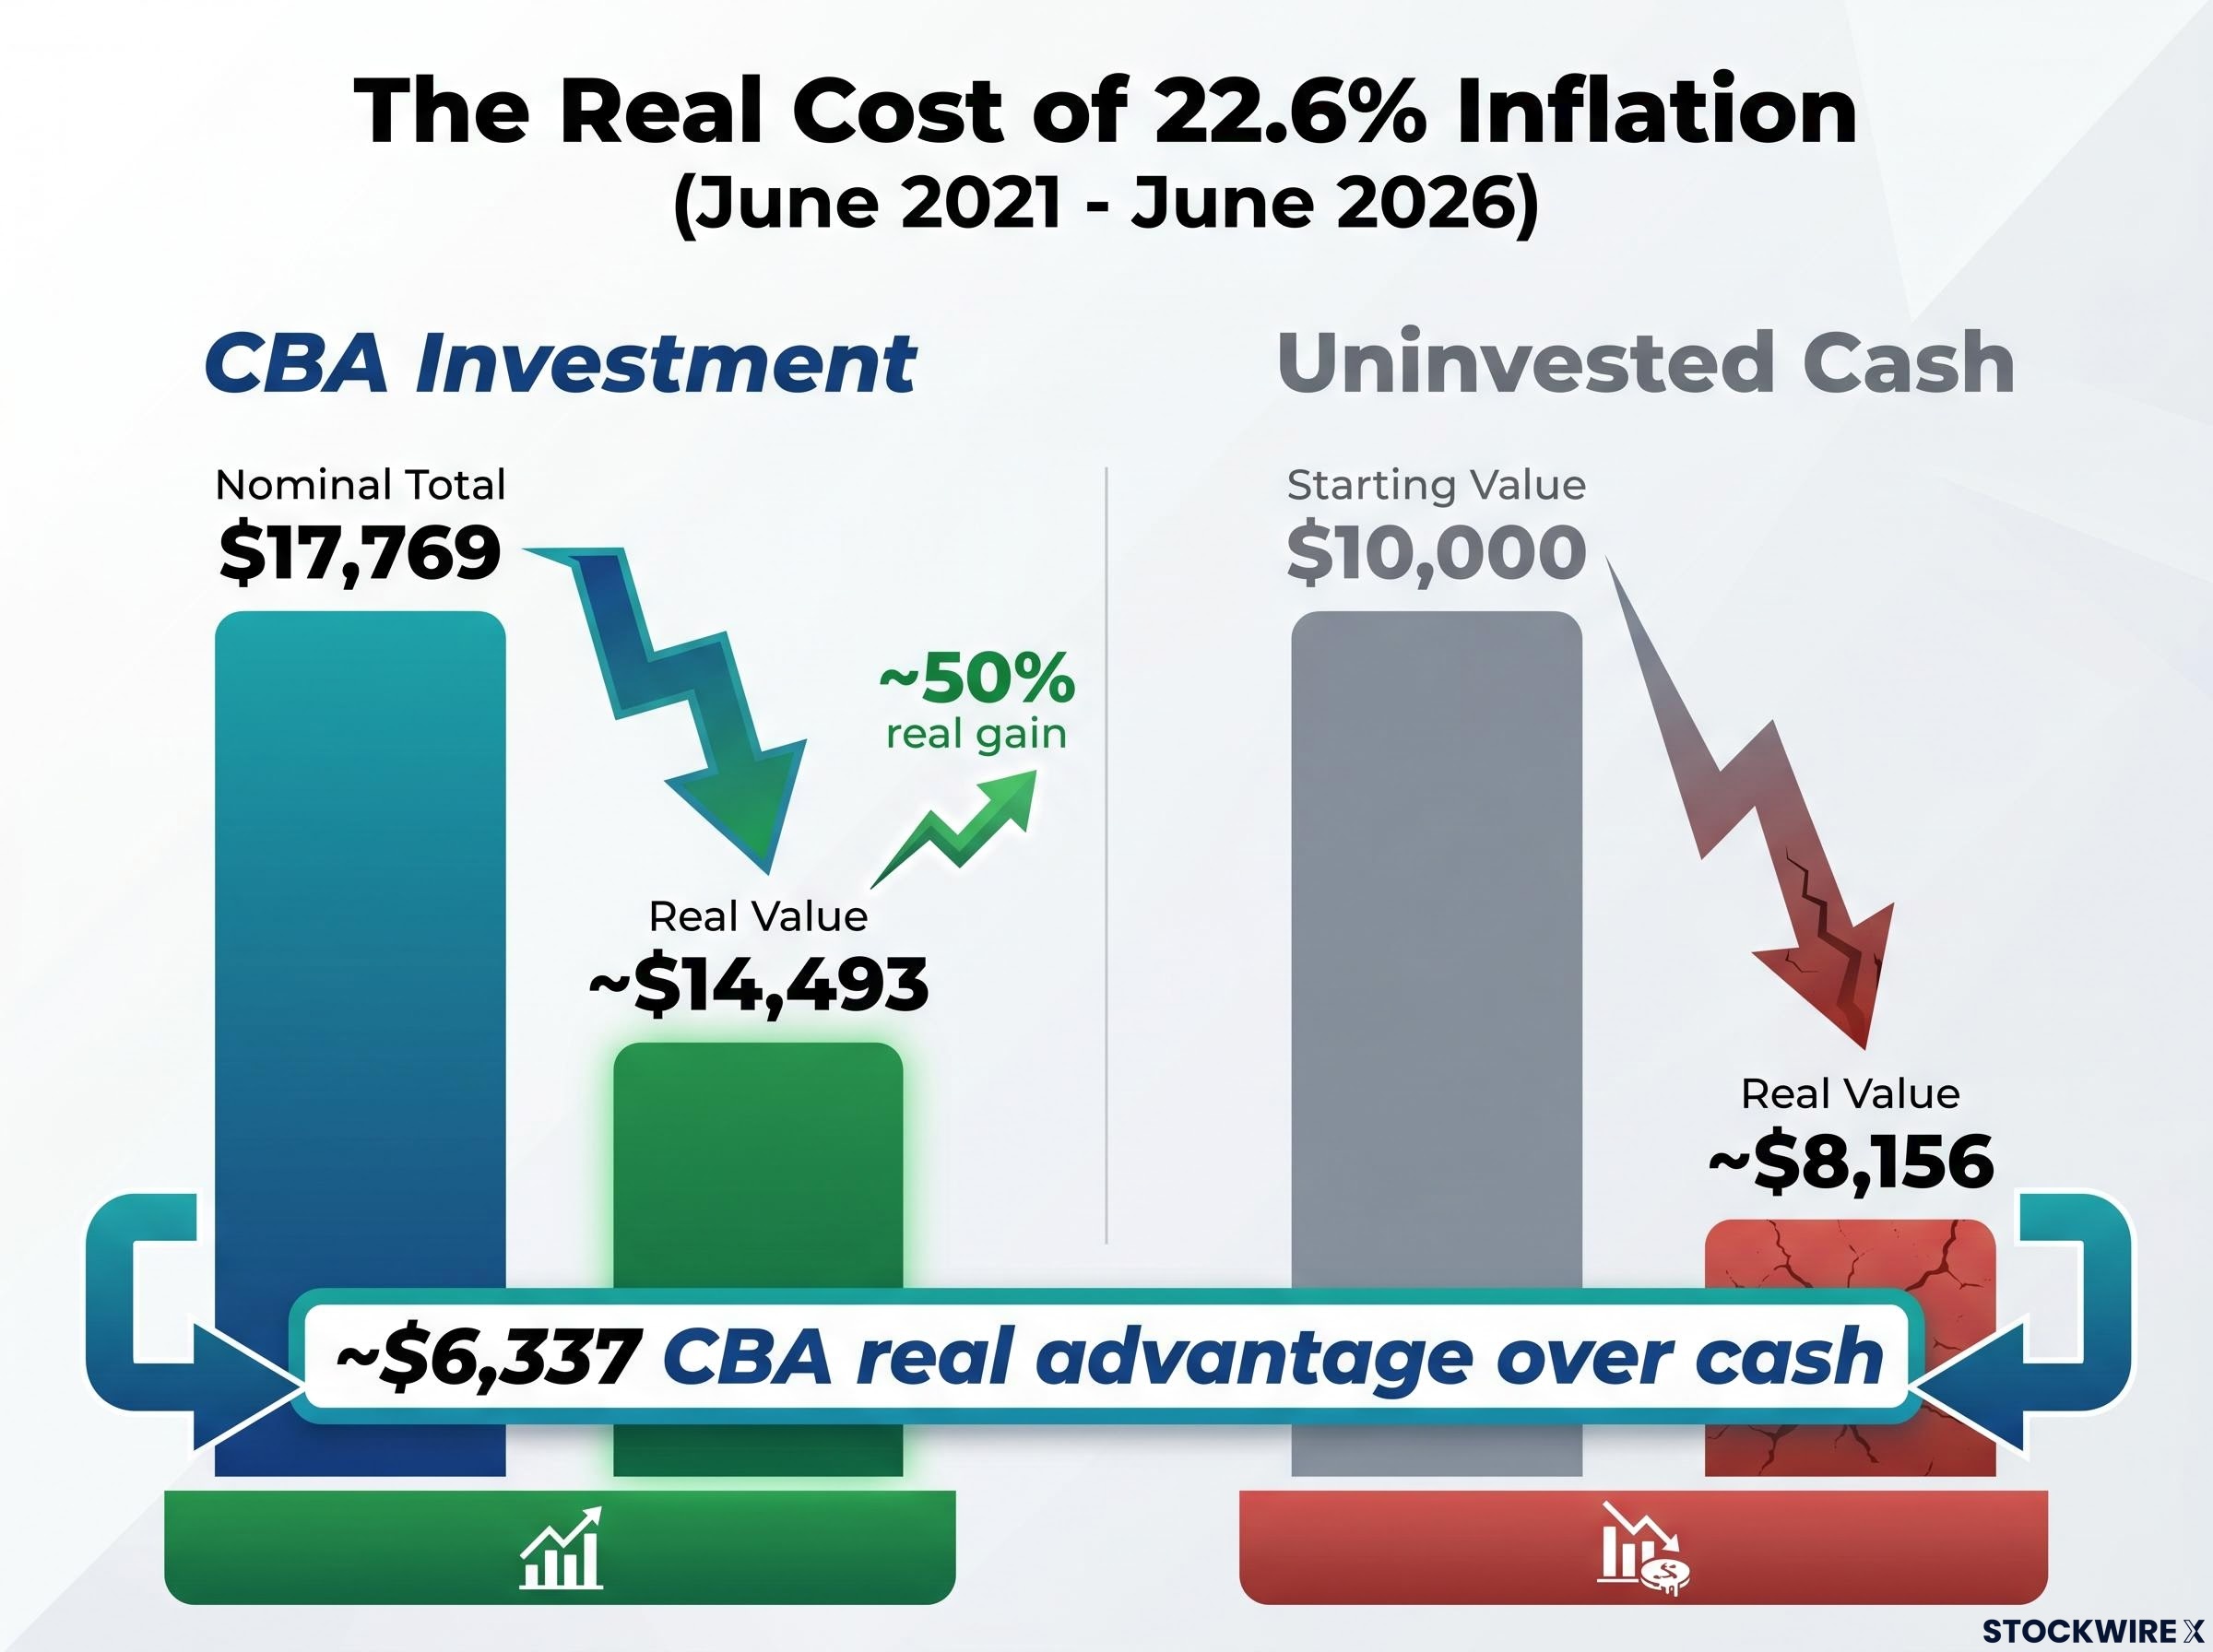
The CBA investor’s real advantage over the cash holder: approximately $6,337.
An inflation investment strategy built around Australian equities with pricing power, including fully franked large-cap dividend payers, has historically preserved more real purchasing power than passive cash positions, a comparison made concrete by the approximately $6,337 real-terms gap between the CBA investor and the uninvested cash holder in this analysis.
| Measure | Value |
|---|---|
| Nominal total (capital + dividends) | $17,769 |
| Real value in 2021 purchasing power | ~$14,493 |
| Real gain over five years | ~50% |
| Real value of uninvested $10,000 cash | ~$8,156 |
| CBA investor’s real advantage over cash holder | ~$6,337 |
Inflation estimates vary by data source and exact measurement dates. The 22.6% cumulative figure applied here represents the midpoint of the cited range.
The $17,769 figure assumes every dividend was taken as cash. A dividend reinvestment plan (DRP) would have produced a materially different outcome.
Under a DRP, each of the ten dividend payments would have been used to purchase additional CBA shares at or near the prevailing market price. Those new shares would then have received subsequent dividends and appreciated alongside the original holding. Given CBA’s 57.1% price appreciation over the period, dividends reinvested in the earlier years would have compounded at meaningfully higher rates than those reinvested later.
The exact DRP outcome requires reinvestment price data for each of the ten distribution dates and falls outside the scope of this analysis. The direction, however, is clear: the DRP total would sit materially above $17,769.
Three conditions make DRP participation most beneficial:
CBA offers a dividend reinvestment plan through which shareholders can elect to receive new shares instead of cash dividends, typically at a small discount to the prevailing market price. DRP elections can be made or changed before each record date, giving investors flexibility to switch between cash and reinvestment as their circumstances evolve.
For long-term holders with no immediate income need, DRP participation converts a passive holding into an actively compounding one.
A single $10,000 investment in CBA, held for five years with dividends taken as cash, delivered three distinct layers of return:
Nominal total return: approximately 77.7% over five years, equivalent to a compound annual growth rate (CAGR) of approximately 12.3%.
Price appreciation contributed 57.1%. Ten fully franked dividends added $2,131 in cash income, with additional franking credit value for eligible Australian shareholders. After adjusting for approximately 22.6% cumulative inflation, the real return stood at roughly 50% in 2021 purchasing power. CBA more than doubled the S&P/ASX 200 return over the same period.
The transferable framework is a three-part checklist applicable to any long-term equity holding:
Evaluating equities on price alone systematically undercounts what ownership actually delivers.
A forward-looking caveat applies. CBA’s five-year performance reflects a specific set of market conditions, management decisions, and economic circumstances. The bank’s current valuation reflects a premium that investors should weigh independently against their own outlook.
CBA’s current valuation sits at a trailing price-to-earnings ratio approximately 66% above its 10-year median multiple, a premium that 14 of 16 analysts have flagged as unsustainable at the same time as the fully franked dividend track record, unbroken since 2006, continues to anchor the income thesis for long-term holders.
This article is for informational purposes only and should not be considered financial advice. Investors should conduct their own research and consult with financial professionals before making investment decisions. Past performance does not guarantee future results.
A $10,000 investment in CBA shares on 18 June 2021 grew to $17,769 in nominal terms by 18 June 2026, reflecting a total return of approximately 77.7%, combining 57.1% price appreciation and $2,131 in fully franked dividend income.
Fully franked dividends carry franking credits representing the 30% corporate tax CBA has already paid, allowing eligible Australian shareholders to offset those credits against personal tax owed or receive a cash refund from the ATO, increasing the effective yield beyond the headline cash payout.
Cumulative Australian inflation of approximately 22.6% between June 2021 and June 2026 reduced the real purchasing power of the $17,769 nominal total to approximately $14,493 in 2021 dollars, representing a real gain of roughly 50% rather than the nominal 77.7%.
A dividend reinvestment plan (DRP) allows shareholders to receive new shares instead of cash dividends, typically at a small discount to the market price; CBA offers this option and shareholders can elect or change their DRP participation before each record date, converting a passive holding into a compounding one over time.
CBA more than doubled the return of the S&P/ASX 200 Index over the five-year period from June 2021 to June 2026, a material outperformance for a large-cap financial stock that held the title of Australia's largest ASX-listed company by market capitalisation for much of that period.


