ASX Bears Pile Into Healthcare, Cover Gold in Week 26 Data
1 hr ago

Crude oil prices are heading toward three-month lows after a potential US-Iran agreement raised the prospect of Iranian barrels re-entering global markets. Brent and WTI fell 4-5% in a single session on 18 June 2026, pushing crude below US$77 per barrel and marking a fourth consecutive day of losses. The anticipated deal would reopen tanker traffic through the Strait of Hormuz, a chokepoint carrying roughly 20% of global oil flows, and the market is pricing in both additional future supply and a sharply reduced geopolitical risk premium.
That combination is doing the most damage to crude prices, but the transmission does not stop at energy markets. What follows traces the full chain: what the oil move means for inflation and rate expectations, why it is simultaneously supportive for gold and only conditionally supportive for the Australian dollar, and which technical levels investors should watch across all three markets.
The mechanism is specific. The anticipated agreement would reinstate Iranian crude exports and reopen the Strait of Hormuz to full tanker traffic, effectively removing a supply bottleneck that has kept a geopolitical premium embedded in oil prices for months. Markets moved before a single additional barrel shipped.
That distinction matters. The 4-5% single-session decline in Brent and WTI reflects risk-premium removal as much as any tangible new supply. Analysts stress that normalisation of Iranian production and shipping logistics will take time; the current price drop is forward-looking anticipation, not confirmed supply hitting the market.
The context for today’s de-escalation move is a supply disruption at scale that had no modern precedent: EIA modelling showed Gulf production shut-ins peaking near 10.8 million barrels per day, a volume that bypass pipeline infrastructure, including Saudi Arabia’s East-West Pipeline and the UAE’s ADCOP line, could not collectively replace.
The Strait of Hormuz carries approximately 20% of global oil flows. Even a partial reopening of this route reprices the entire geopolitical risk curve embedded in crude.
The fragility is real. No barrels have moved yet, and the deal itself remains unconfirmed. If negotiations stall or conditions change, the premium that has been stripped out of prices could return just as quickly as it disappeared.
Three key downstream consequences follow from the deal, if it materialises:
The connection between cheaper crude and broader financial markets runs through a four-step transmission chain. Each link follows logically from the one before it:
This chain is the core macro mechanism connecting crude oil’s decline to gold and AUD/USD. Every section that follows depends on it.
The lag between energy prices and consumer prices is not symmetric in either direction: analyst estimates put oil price pass-through into CPI at 40-60% over a 3-6 month window, which means the June and July inflation prints will carry more policy weight for the Federal Reserve than any immediate data released in the days following the deal announcement.
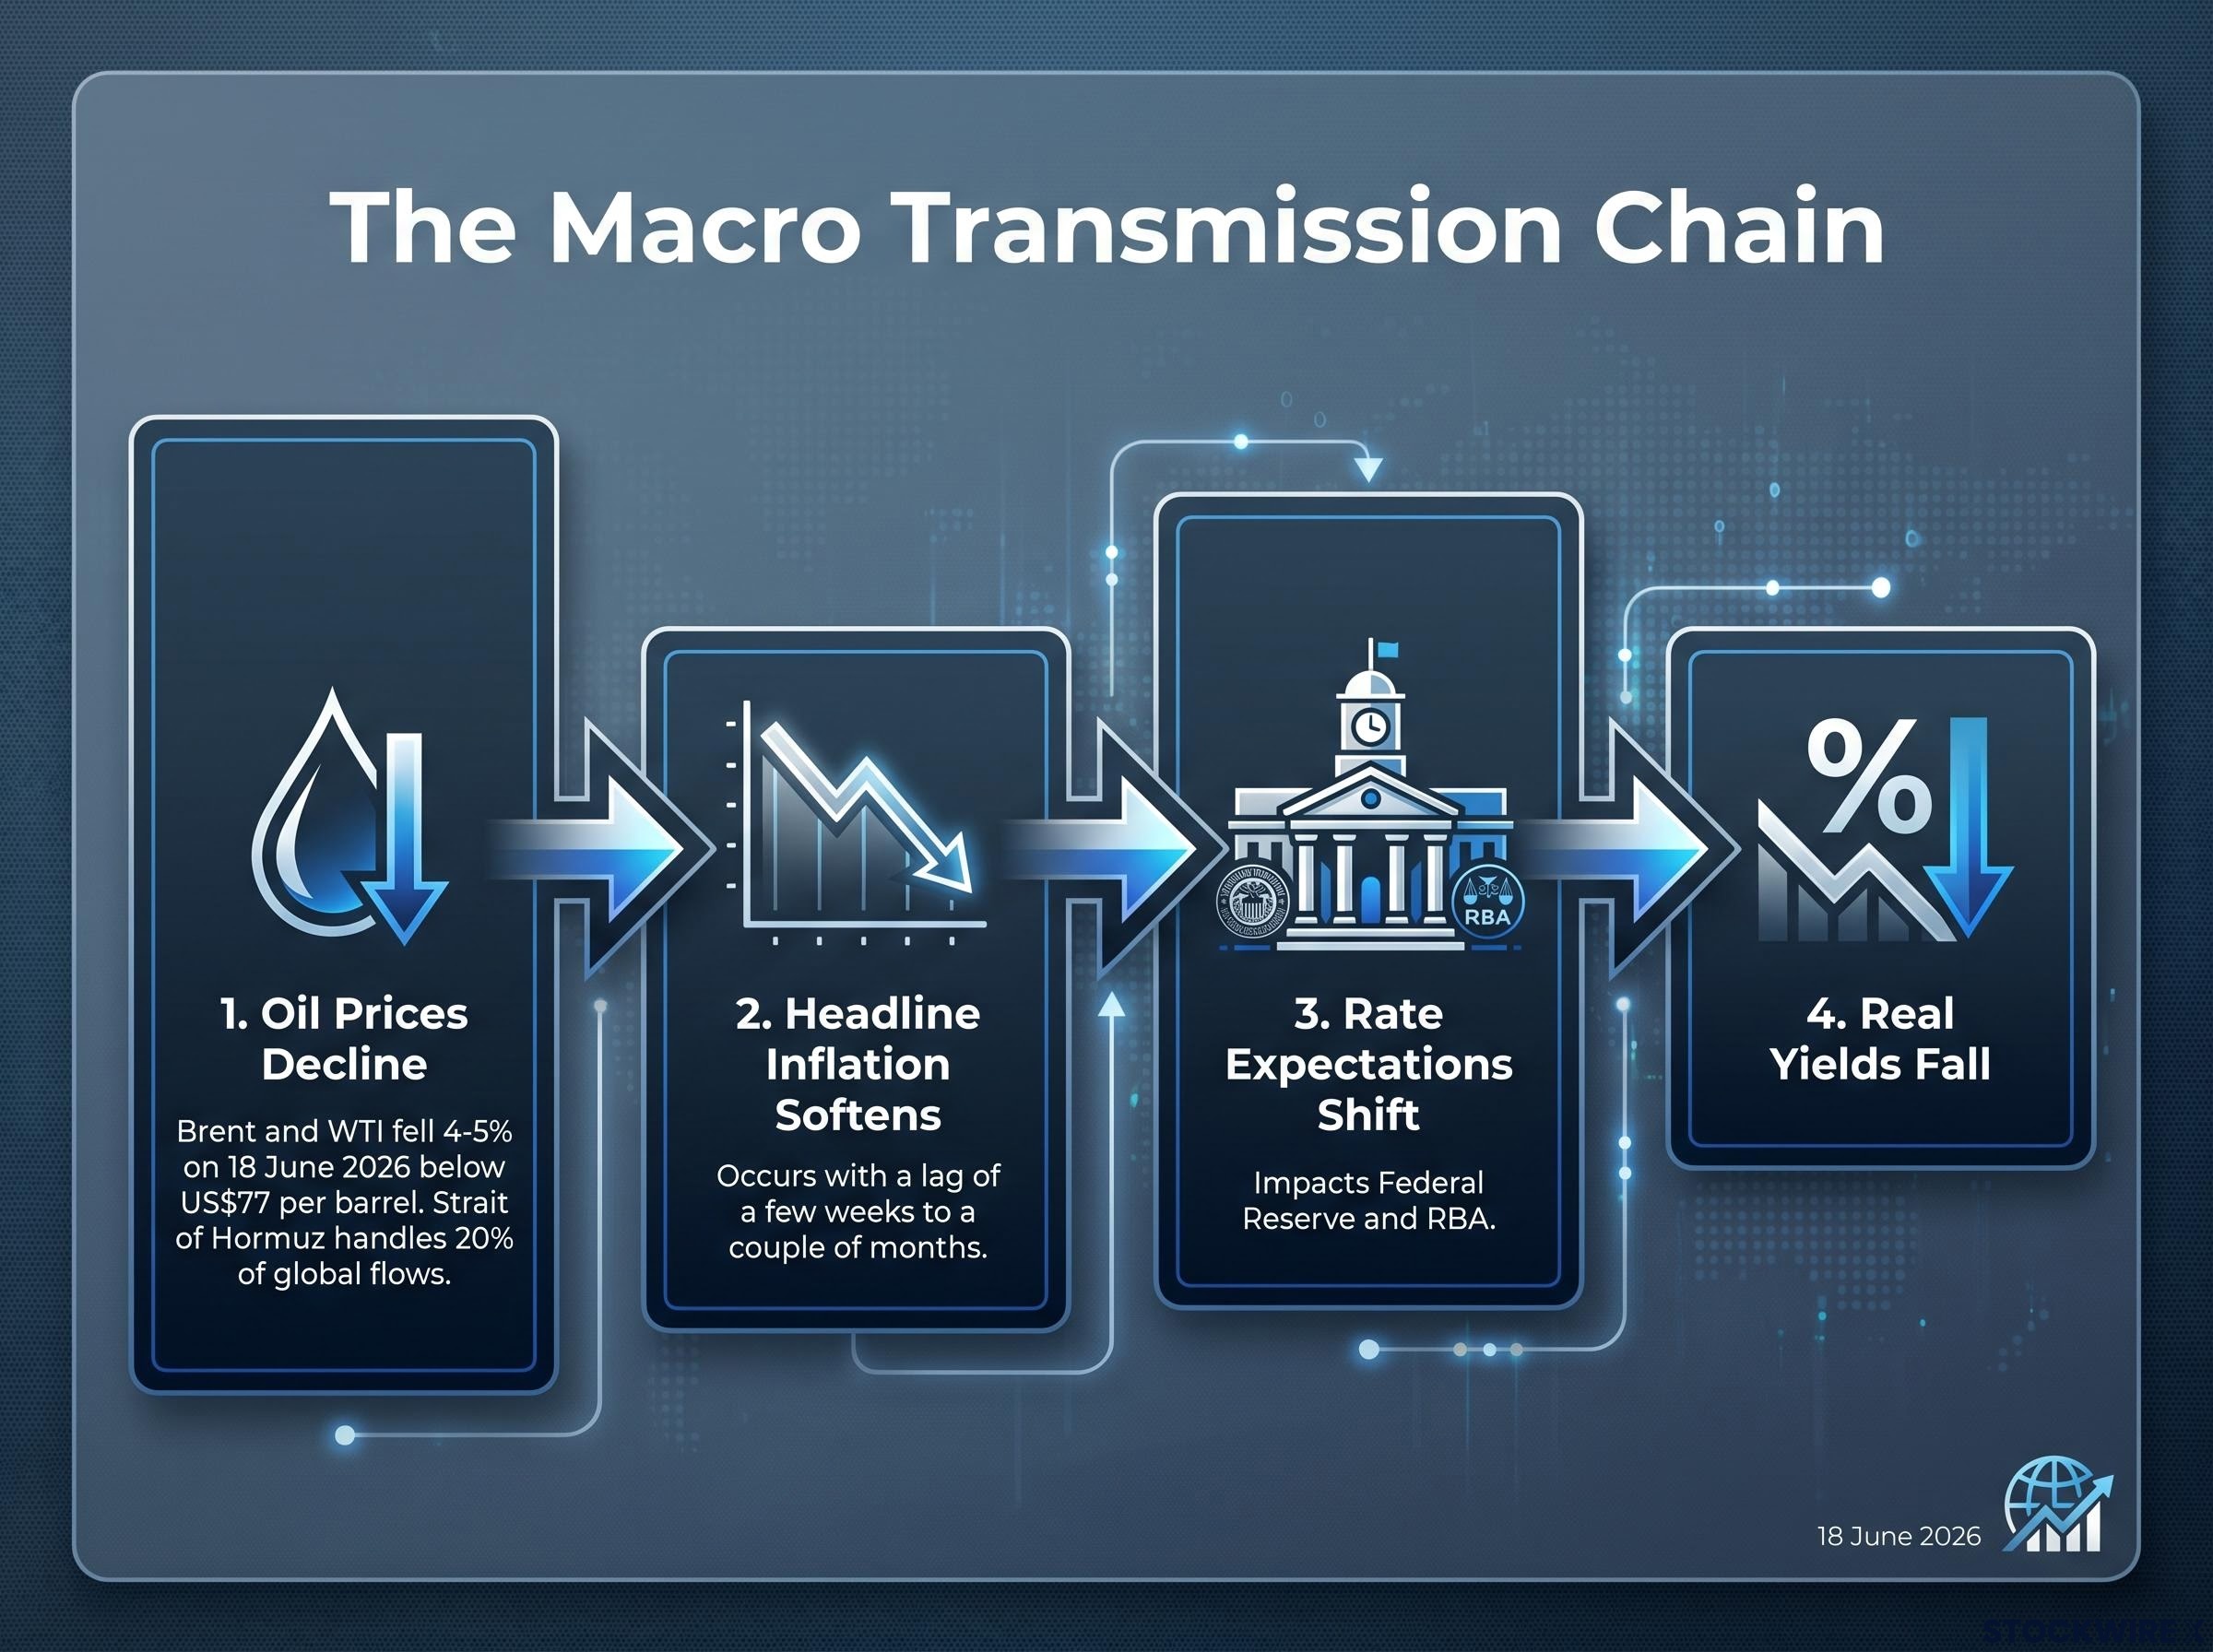
When energy-driven inflation pressures ease, markets reprice rate expectations forward. Both the Federal Reserve and the Reserve Bank of Australia (RBA) are sensitive to headline inflation readings, and a sustained decline in oil prices gives both institutions room to hold rates steady or signal future easing.
The two central banks do not move in lockstep. The relative shift in their expected rate paths matters: for gold, the Fed’s trajectory influences the US dollar and real yields directly; for AUD, the gap between RBA and Fed expectations determines the rate differential that drives currency flows. A scenario where markets scale back RBA tightening expectations faster than Fed expectations would narrow or reverse the differential in a direction unfavourable to the Australian dollar.
The rates channel is doing the heavy lifting. Lower real yields reduce the opportunity cost of holding gold, which pays no interest and competes directly with bonds and cash for portfolio allocation. As the oil decline feeds into softer inflation expectations, markets are repricing the path of rate cuts forward, and that repricing supports the metal.
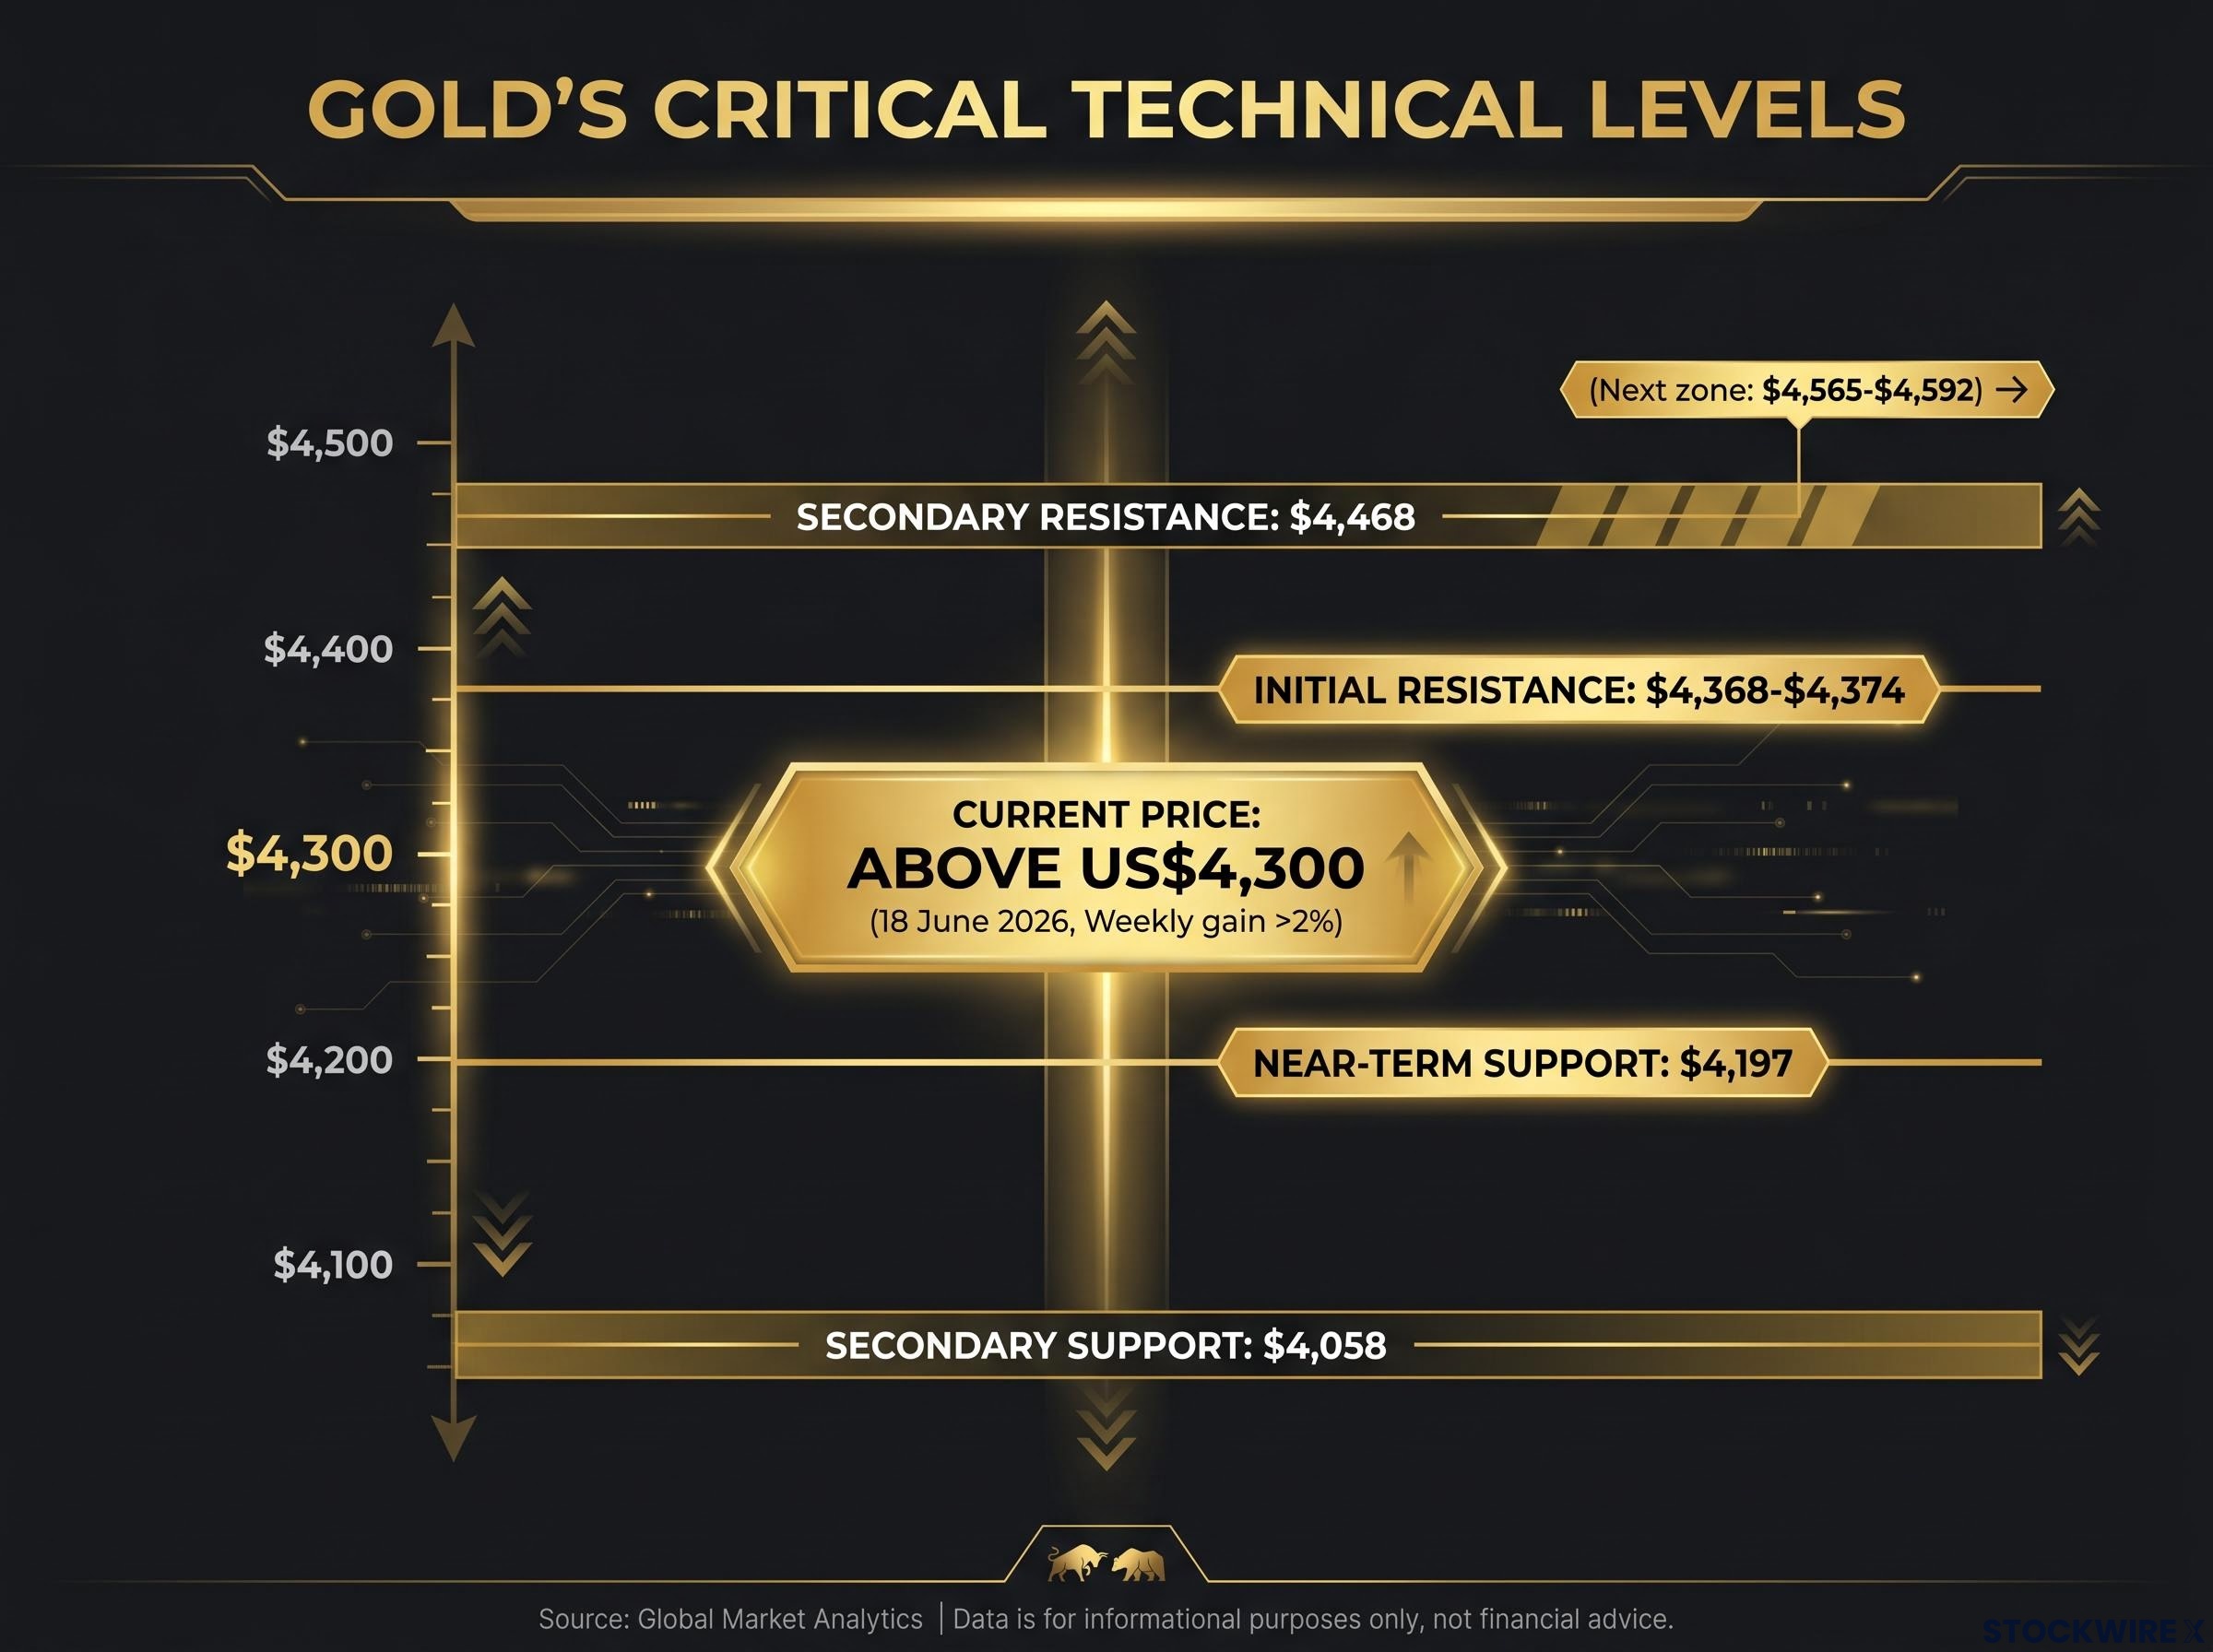
Gold was trading above US$4,300 per ounce on 18 June 2026, with a weekly gain exceeding 2%. The bounce from recent lows is meaningful but not yet definitive.
The move above US$4,300 represents a recovery attempt rather than a confirmed directional reversal. Conviction requires a decisive break above near-term resistance.
The competing force is geopolitical. A credible US-Iran deal and a safer Strait of Hormuz reduce the probability of military escalation and supply shocks in one of the world’s most strategically sensitive regions. That directly lowers safe-haven demand for gold, partially offsetting the bullish impulse from falling yields.
The 2026 bear market in gold, where the metal fell nearly 25% from its January high of $5,405 despite simultaneous military conflict, oil supply disruption, and elevated inflation, is the clearest recent demonstration of real yields overriding safe-haven demand: rising real yields and a stronger dollar systematically overpowered every geopolitical catalyst that conventional gold logic would have treated as bullish.
The table below summarises the technical levels that will determine which force prevails:
| Level Type | Price (USD) | Significance |
|---|---|---|
| Initial resistance | $4,368-$4,374 | Near-term directional test; a break here shifts momentum |
| Secondary resistance | $4,468 | A clean break required for a more substantial recovery; next zone at $4,565-$4,592 |
| Near-term support | $4,197 | First downside level if recovery attempt fails |
| Secondary support | $4,058 | Near the recent low; a breach here would signal renewed bearish pressure |
Gold’s follow-through depends on incoming inflation data, central bank rhetoric from the Fed, and whether the yield channel continues to dominate the fading safe-haven bid. According to Vantage Markets analysis by Hebe Chen, Senior Market Analyst, the broader technical setup remains cautious even as the near-term momentum indicator supports a bounce.
The intuitive story is straightforward. De-escalation in the Gulf reduces tail-risk around global energy supply, supports risk appetite, and lifts pro-cyclical currencies including the Australian dollar. AUD/USD was trading near 0.7070 on 18 June 2026, attempting a recovery within a short-term descending channel.
Two forces support the currency in this environment:
Two forces work against it:
This is the structural complication. The same channel that supports gold (lower yields via softer inflation) is the channel that can undermine AUD. A dovish RBA repricing driven by cheaper energy imports does not help a currency that needs rate-differential support.
RBA rate path divergence from the Fed became one of the defining macro themes of the first half of 2026, with Australia’s central bank hiking to 4.35% in May while the Fed, ECB, and Bank of England all held steady, creating a rate differential of up to 235 basis points that had been supporting AUD carry flows before the Gulf de-escalation introduced a new variable.
The technical levels below define the boundaries of this tension:
| Level Type | Price (AUD/USD) | Significance |
|---|---|---|
| Primary resistance | 0.7100-0.7135 | Aligns with the 20-day moving average near 0.7105 |
| Confirmation level | 0.7144 | 50-day moving average; a break above provides stronger recovery signal |
| Key downside support | 0.6980-0.6988 | A breach indicates the rebound has reversed |
| Extended downside | 0.6847 | 200-day moving average; becomes the focus if primary support fails |
According to Vantage Markets analysis, the near-term rebound remains corrective rather than trending until key resistance levels are convincingly cleared. AUD traders cannot simply buy the currency on a Gulf de-escalation headline without accounting for the rate-differential risk that runs in the opposite direction.
A single geopolitical headline has simultaneously removed oil risk premium, eased inflation expectations, and created a conditionally supportive backdrop for both gold and AUD. None of these moves is confirmed as a sustained trend.
The signals that will convert corrective price action into directional conviction arrive in a specific order:
The same catalyst that pressures oil creates a conditionally supportive backdrop for gold and AUD, but confirmation requires more than one headline. Both gold’s recovery above US$4,300 and AUD’s rebound near 0.7070 remain corrective in character until resistance levels are cleared and macro data confirms the directional shift.
Oil below US$77 per barrel sets the current macro baseline. Gold’s test comes at US$4,368-US$4,374. AUD/USD faces its equivalent at 0.7100-0.7135. Until those levels break, the move is sentiment, not trend.
The potential US-Iran agreement represents a genuine macro catalyst, not noise. It simultaneously reprices energy supply risk, inflation trajectories, and central bank flexibility across multiple asset classes at once. Few single headlines achieve that breadth of transmission.
The channel from oil to gold to AUD runs through rates, and rates take time. Inflation data needs to confirm what energy prices are signalling. Central banks need to respond. The transmission is real but not instant.
Investors tracking crude oil price developments should treat the confirmed resistance breaks in gold and AUD/USD, not the oil headline itself, as the true validation signals. The catalyst has arrived. The confirmation has not.
This article is for informational purposes only and should not be considered financial advice. Investors should conduct their own research and consult with financial professionals before making investment decisions. Forward-looking statements regarding the US-Iran agreement, inflation trends, and central bank actions are speculative and subject to change based on market developments.
The geopolitical risk premium is the additional price built into crude oil above its fundamental supply-demand value, reflecting the market's compensation for the risk of supply disruption from conflict or political instability in key producing regions.
Cheaper oil reduces input costs for fuel, transport, and energy across the economy, which softens headline inflation readings; as inflation expectations ease, markets typically reprice central bank rate paths, pulling back expectations for further tightening or bringing forward anticipated rate cuts.
Falling oil prices eased inflation expectations, which in turn pushed down real yields; lower real yields reduce the opportunity cost of holding gold (which pays no interest), making the metal more attractive relative to bonds and cash.
A US-Iran deal creates competing forces for AUD: improved risk appetite and a constructive global growth narrative are supportive, but lower imported inflation reduces the case for further RBA tightening, which can narrow the Australia-US rate differential and undermine the carry flows that had been supporting the currency.
For gold, the key near-term resistance sits at US$4,368-US$4,374, with secondary resistance at US$4,468; for AUD/USD, primary resistance is at 0.7100-0.7135 and confirmation comes at 0.7144, while a break below 0.6980-0.6988 would signal the rebound has reversed.