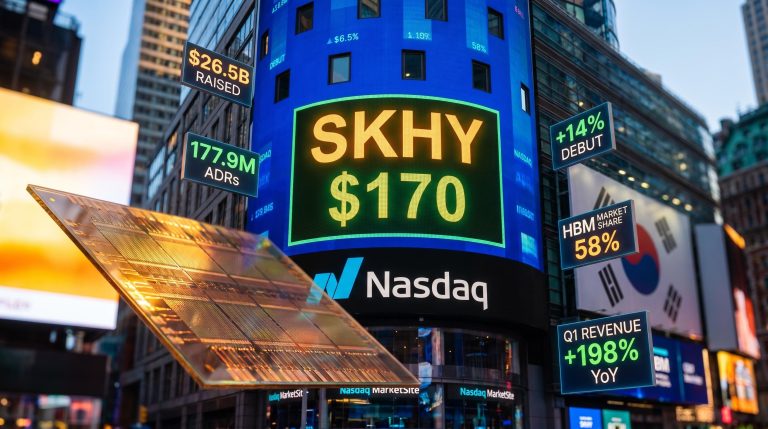
SK Hynix’s $26.5B Nasdaq Listing Shatters ADR Demand Records
1 hr ago
Brent crude swung nearly $2 per barrel within a single session on 8 May 2026, as traders toggled between war and peace in real time. The trigger: armed exchanges between U.S. and Iranian forces near the world’s most important oil chokepoint, the Strait of Hormuz, which has been effectively closed to normal tanker traffic since the conflict escalated earlier this year.
With an estimated 17-20 million barrels per day unable to flow through the Strait, commodity markets are pricing a scenario without modern precedent in scale. Yet diplomatic signals from both Washington and Tehran suggest a peace framework is closer than at any point in the conflict, creating a session where optimism and alarm competed for control of the same barrel of oil. What follows is an explanation of what actually happened on 8 May, why oil price volatility looks paradoxical when viewed at different timeframes, how geopolitical risk premiums work in commodity markets, and what specific signals investors should watch in the days ahead.
The spike came first. Brent surged from approximately $101.60 to $103.37 intraday as reports confirmed armed exchanges between U.S. and Iranian forces near the Strait of Hormuz. WTI briefly touched the $96-$97 range before pulling back. For a few hours, the market priced in a scenario where the ceasefire was dead.
Then the reversal began. President Trump stated the ceasefire remained nominally in effect despite the exchange, and reports circulated of a 14-point peace framework memo serving as the basis for ongoing negotiations. Iran’s counter-claim, that the U.S. had targeted two ships and struck civilian areas, kept the session volatile, but the diplomatic signal was enough to cap the upside.
President Trump stated the ceasefire remained in effect despite the military exchange, a signal that partially suppressed the intraday fear premium and anchored Brent’s close below the session high.
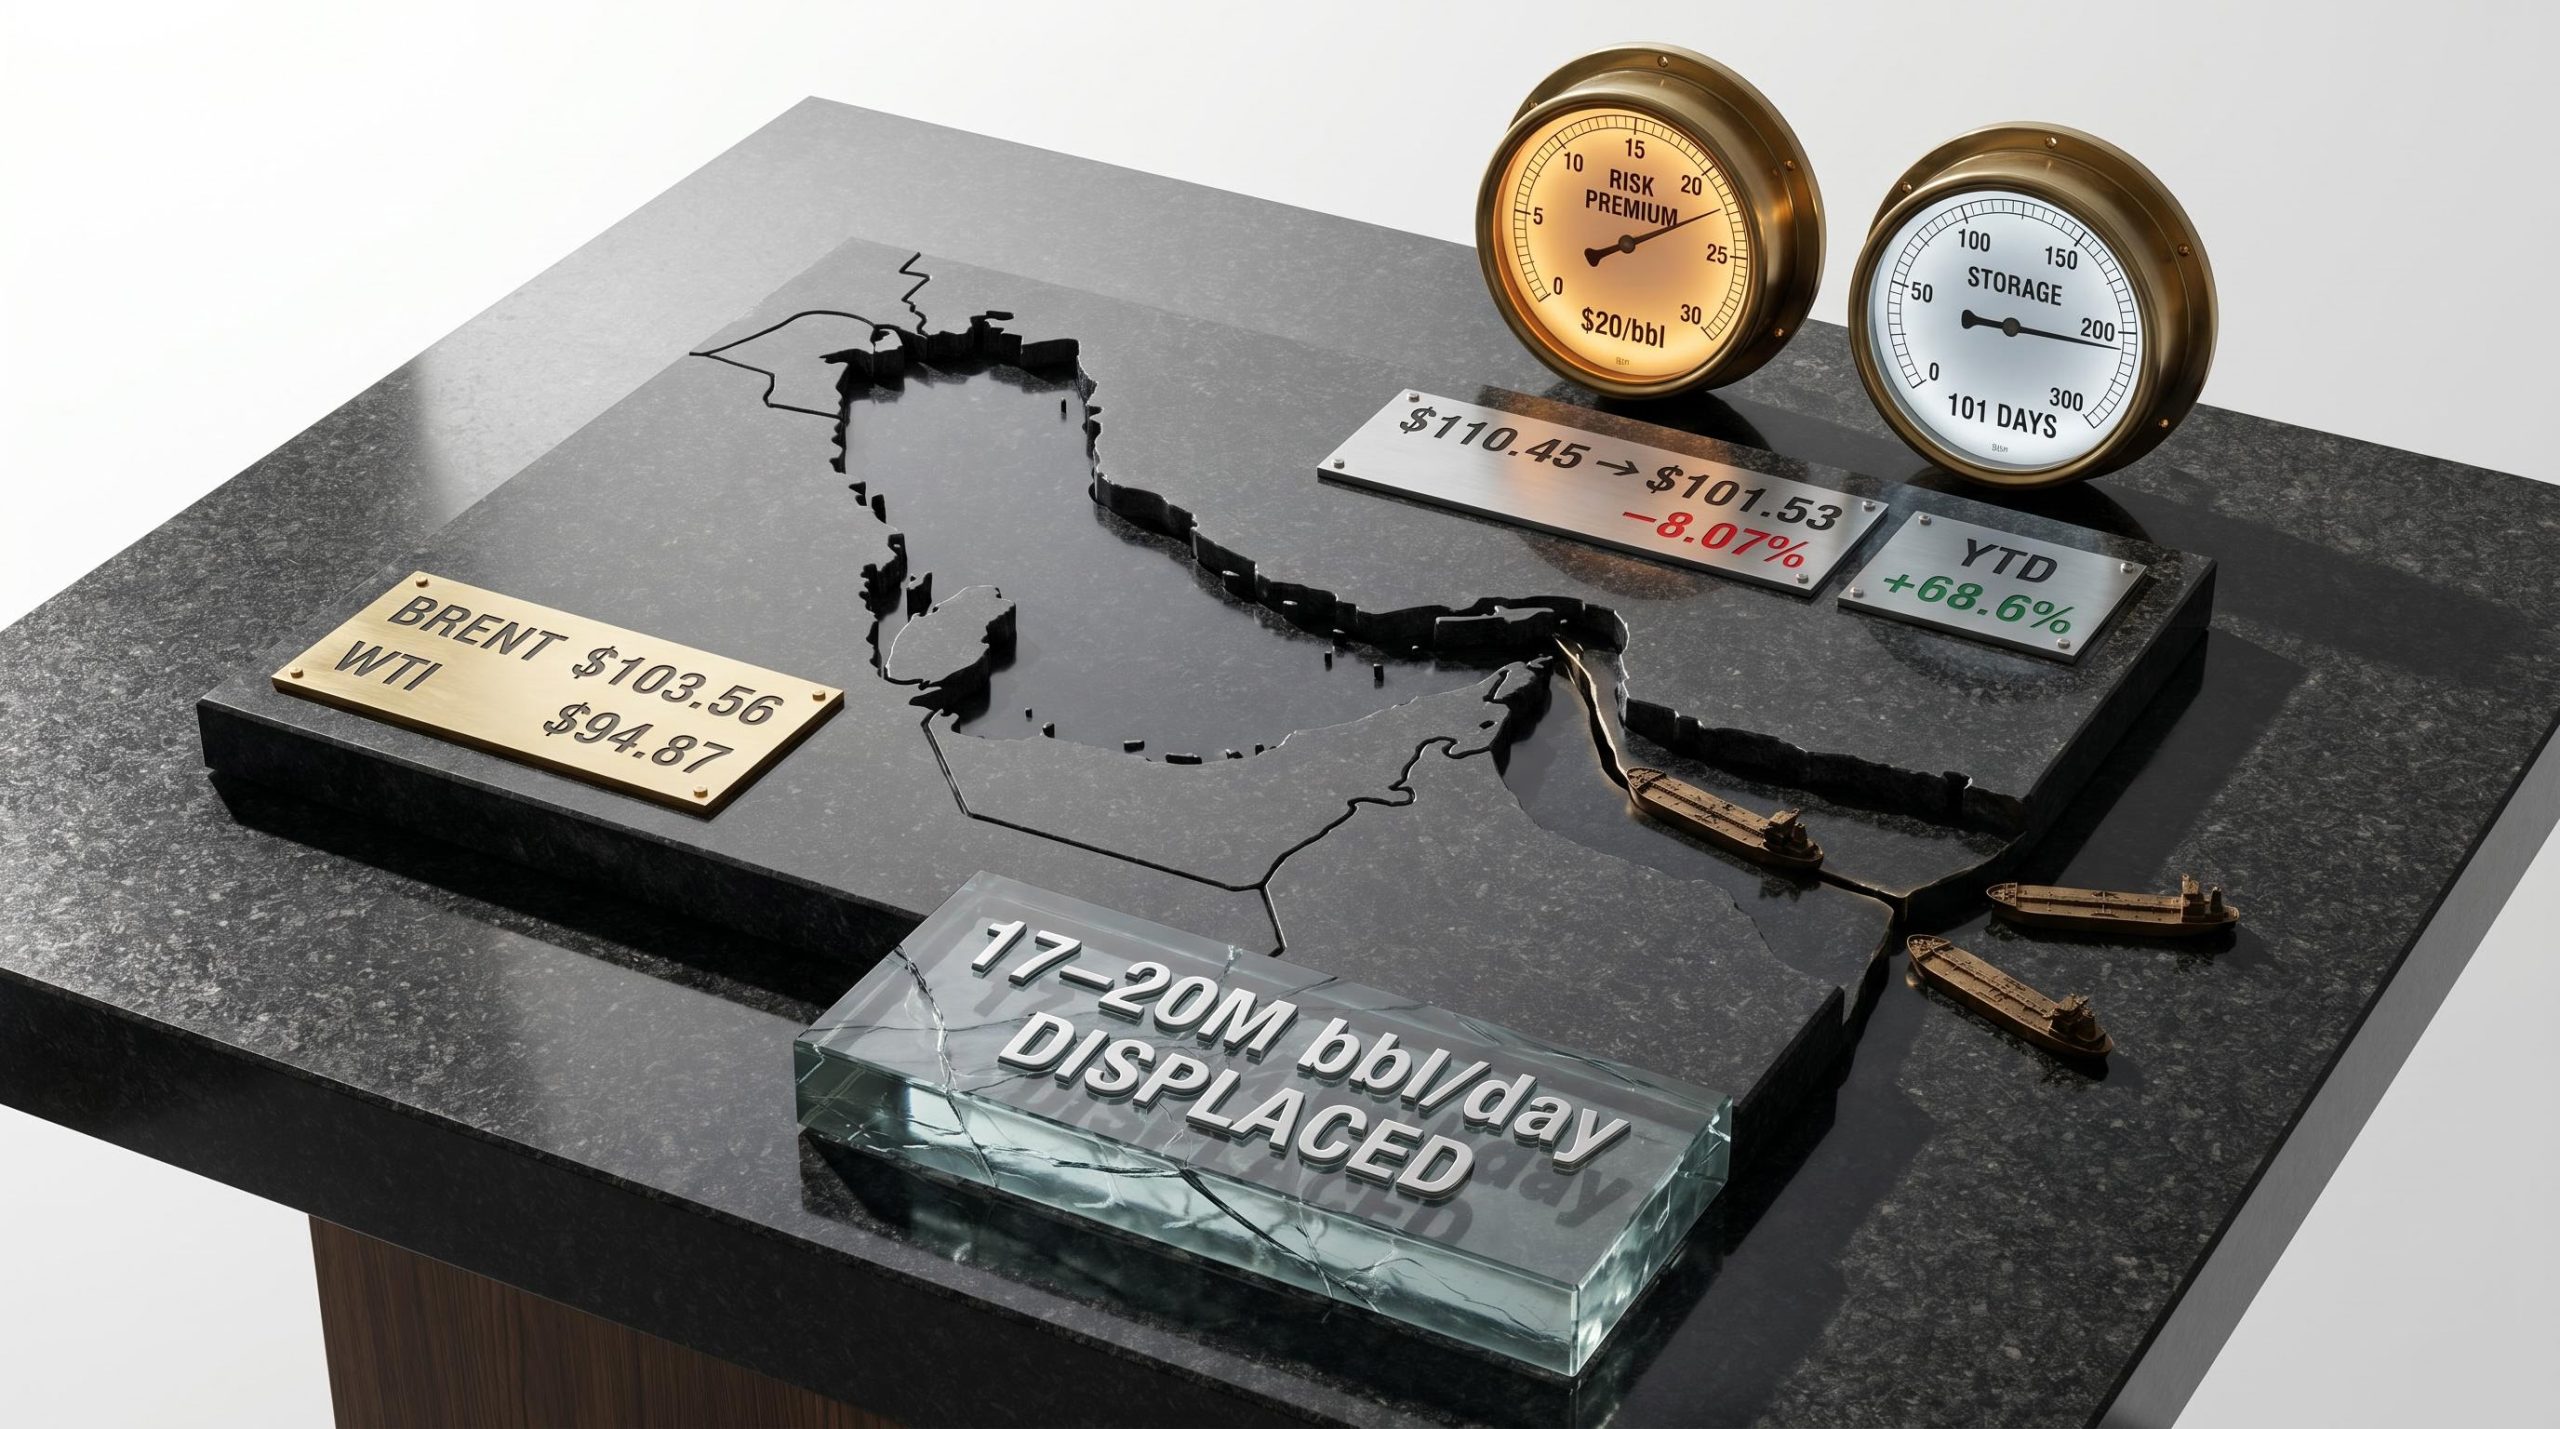
The closing prices tell one story. The weekly trajectory tells another. Brent settled at $103.56 (up from the prior close of $101.53 on 7 May), while WTI closed at $94.87. But zoom out: Brent fell from $110.45 on 6 May to $101.53 on 7 May, a drop of approximately 8.07%, and the week was tracking toward a roughly 7% loss overall. The intraday spike was fear. The weekly decline is the market’s accumulating bet that diplomacy may hold.
The 7 May session, when Brent fell approximately 7.5% to $101 as US-Iran peace talks advance on a reported framework memo, established the baseline from which 8 May’s intraday spike and partial recovery played out; the two sessions read as a single event only when examined together.
| Date | Brent Close ($/bbl) | WTI Close ($/bbl) | Brent Daily Change |
|---|---|---|---|
| 6 May 2026 | $110.45 | — | — |
| 7 May 2026 | $101.53 | — | -8.07% |
| 8 May 2026 | $103.56 | $94.87 | +2.0% |
The divergence between the intraday spike and the weekly decline is the most important information in this session’s data. It tells investors that headline-driven swings are noise; the direction of the weekly trend is the signal.
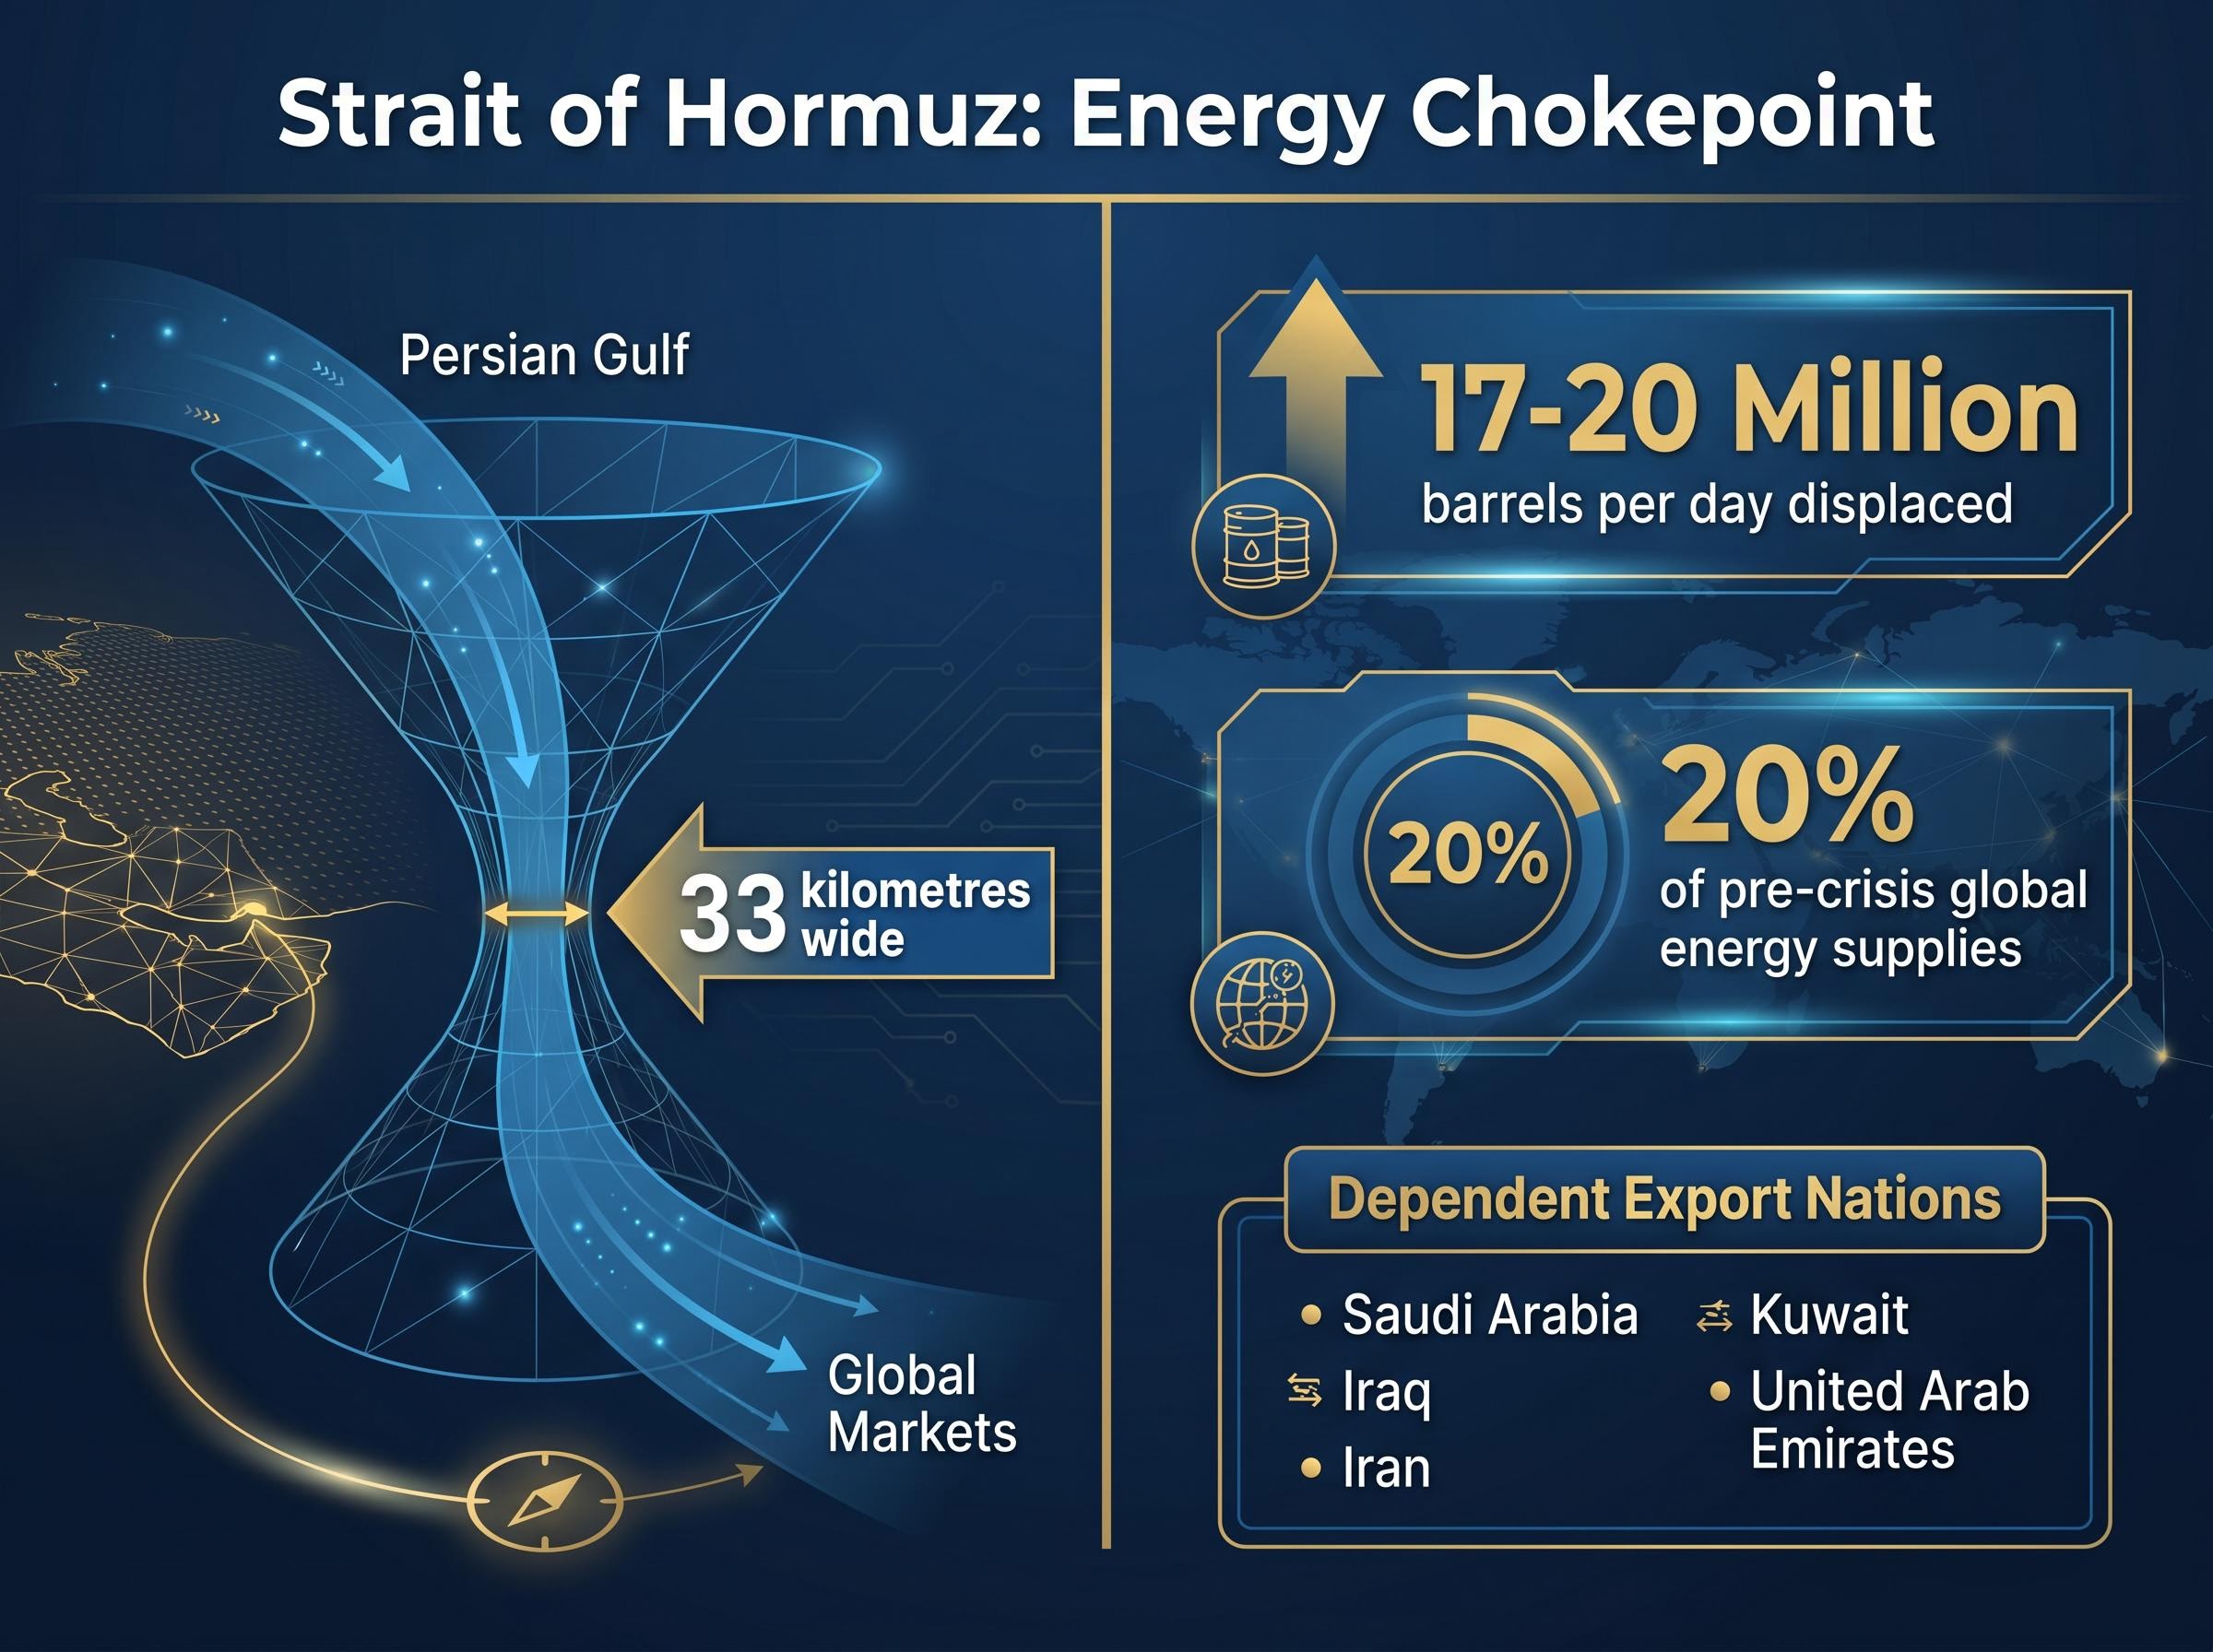
The Strait of Hormuz is a narrow passage, roughly 33 kilometres wide at its narrowest point, connecting the Persian Gulf to the Gulf of Oman and the open ocean beyond. It is the only maritime exit for oil exports from the Gulf’s largest producers. Every tanker carrying crude from these nations must pass through it.
The EIA Strait of Hormuz data confirms that in 2024 the passage carried approximately 20 million barrels per day, equivalent to roughly 20% of global petroleum liquids consumption, making it the single most consequential chokepoint in the global energy network.
The nations whose exports depend on this single corridor include:
Under pre-crisis conditions, the Strait carried approximately 20% of global energy supplies. Its closure is not a partial disruption; it is the removal of the world’s most concentrated energy bottleneck from the supply chain.
With an estimated 17-20 million barrels per day currently displaced, global stockpile trajectories have become the market’s countdown clock.
Goldman Sachs projects that global oil storage, currently at 101 days of demand as of early May, could decline to approximately 98 days by 31 May if the closure continues at its current scale.
Saudi Arabia has been ramping its overland pipeline to the UAE as a partial offset, though no verified figures on the pipeline’s current throughput capacity are available. The pipeline provides relief at the margin, but it cannot replace the volume the Strait carried. Every day the storage figure falls, the price floor beneath crude becomes more durable, because the market’s ability to absorb further disruption shrinks with each barrel drawn from reserves.
Oil prices reflect supply and demand. That is the starting point most investors understand. But when a military conflict threatens a chokepoint that carries 20% of global energy supply, a third variable layers on top of those fundamentals: the geopolitical risk premium.
The mechanism works in three steps:
General market commentary has estimated the current conflict-driven risk premium at $10-$20 per barrel above where Brent would trade on fundamentals alone. No verified analyst consensus exists on how long that premium will persist.
This mechanism explains the 8 May session precisely. The intraday spike was a risk premium expansion: the military exchange raised the perceived probability of sustained Hormuz closure, and traders bid prices higher. The partial reversal was a risk premium compression: Trump’s ceasefire statement reduced that perceived probability, and some of the premium bled off.
Barclays raised its 2026 Brent crude average forecast to $100/bbl, with a conditional scenario of $110/bbl if Hormuz disruptions persist through the end of May.
Brent’s year-to-date gain of approximately 68.6% (from $61.41 on 1 January 2026 to $103.56 on 8 May) reflects both fundamental tightening and a compounding risk premium. Investors who understand this distinction can read oil price moves more accurately: not every spike is a supply event, and not every reversal signals resolution.
VLCC daily hire rates tracking approximately $110,000 per day represent a real-time physical market signal of disruption severity, and the shipping cost repricing extends the Hormuz risk premium into import costs for Japan, China, India, and South Korea, with analysts flagging Q3 2026 rationing risk if no resolution materialises before summer.
Markets are not passive victims of the Hormuz closure. Producers around the world are responding, and that supply-side mobilisation explains why Brent has not surged past $120 despite the largest chokepoint disruption on record.
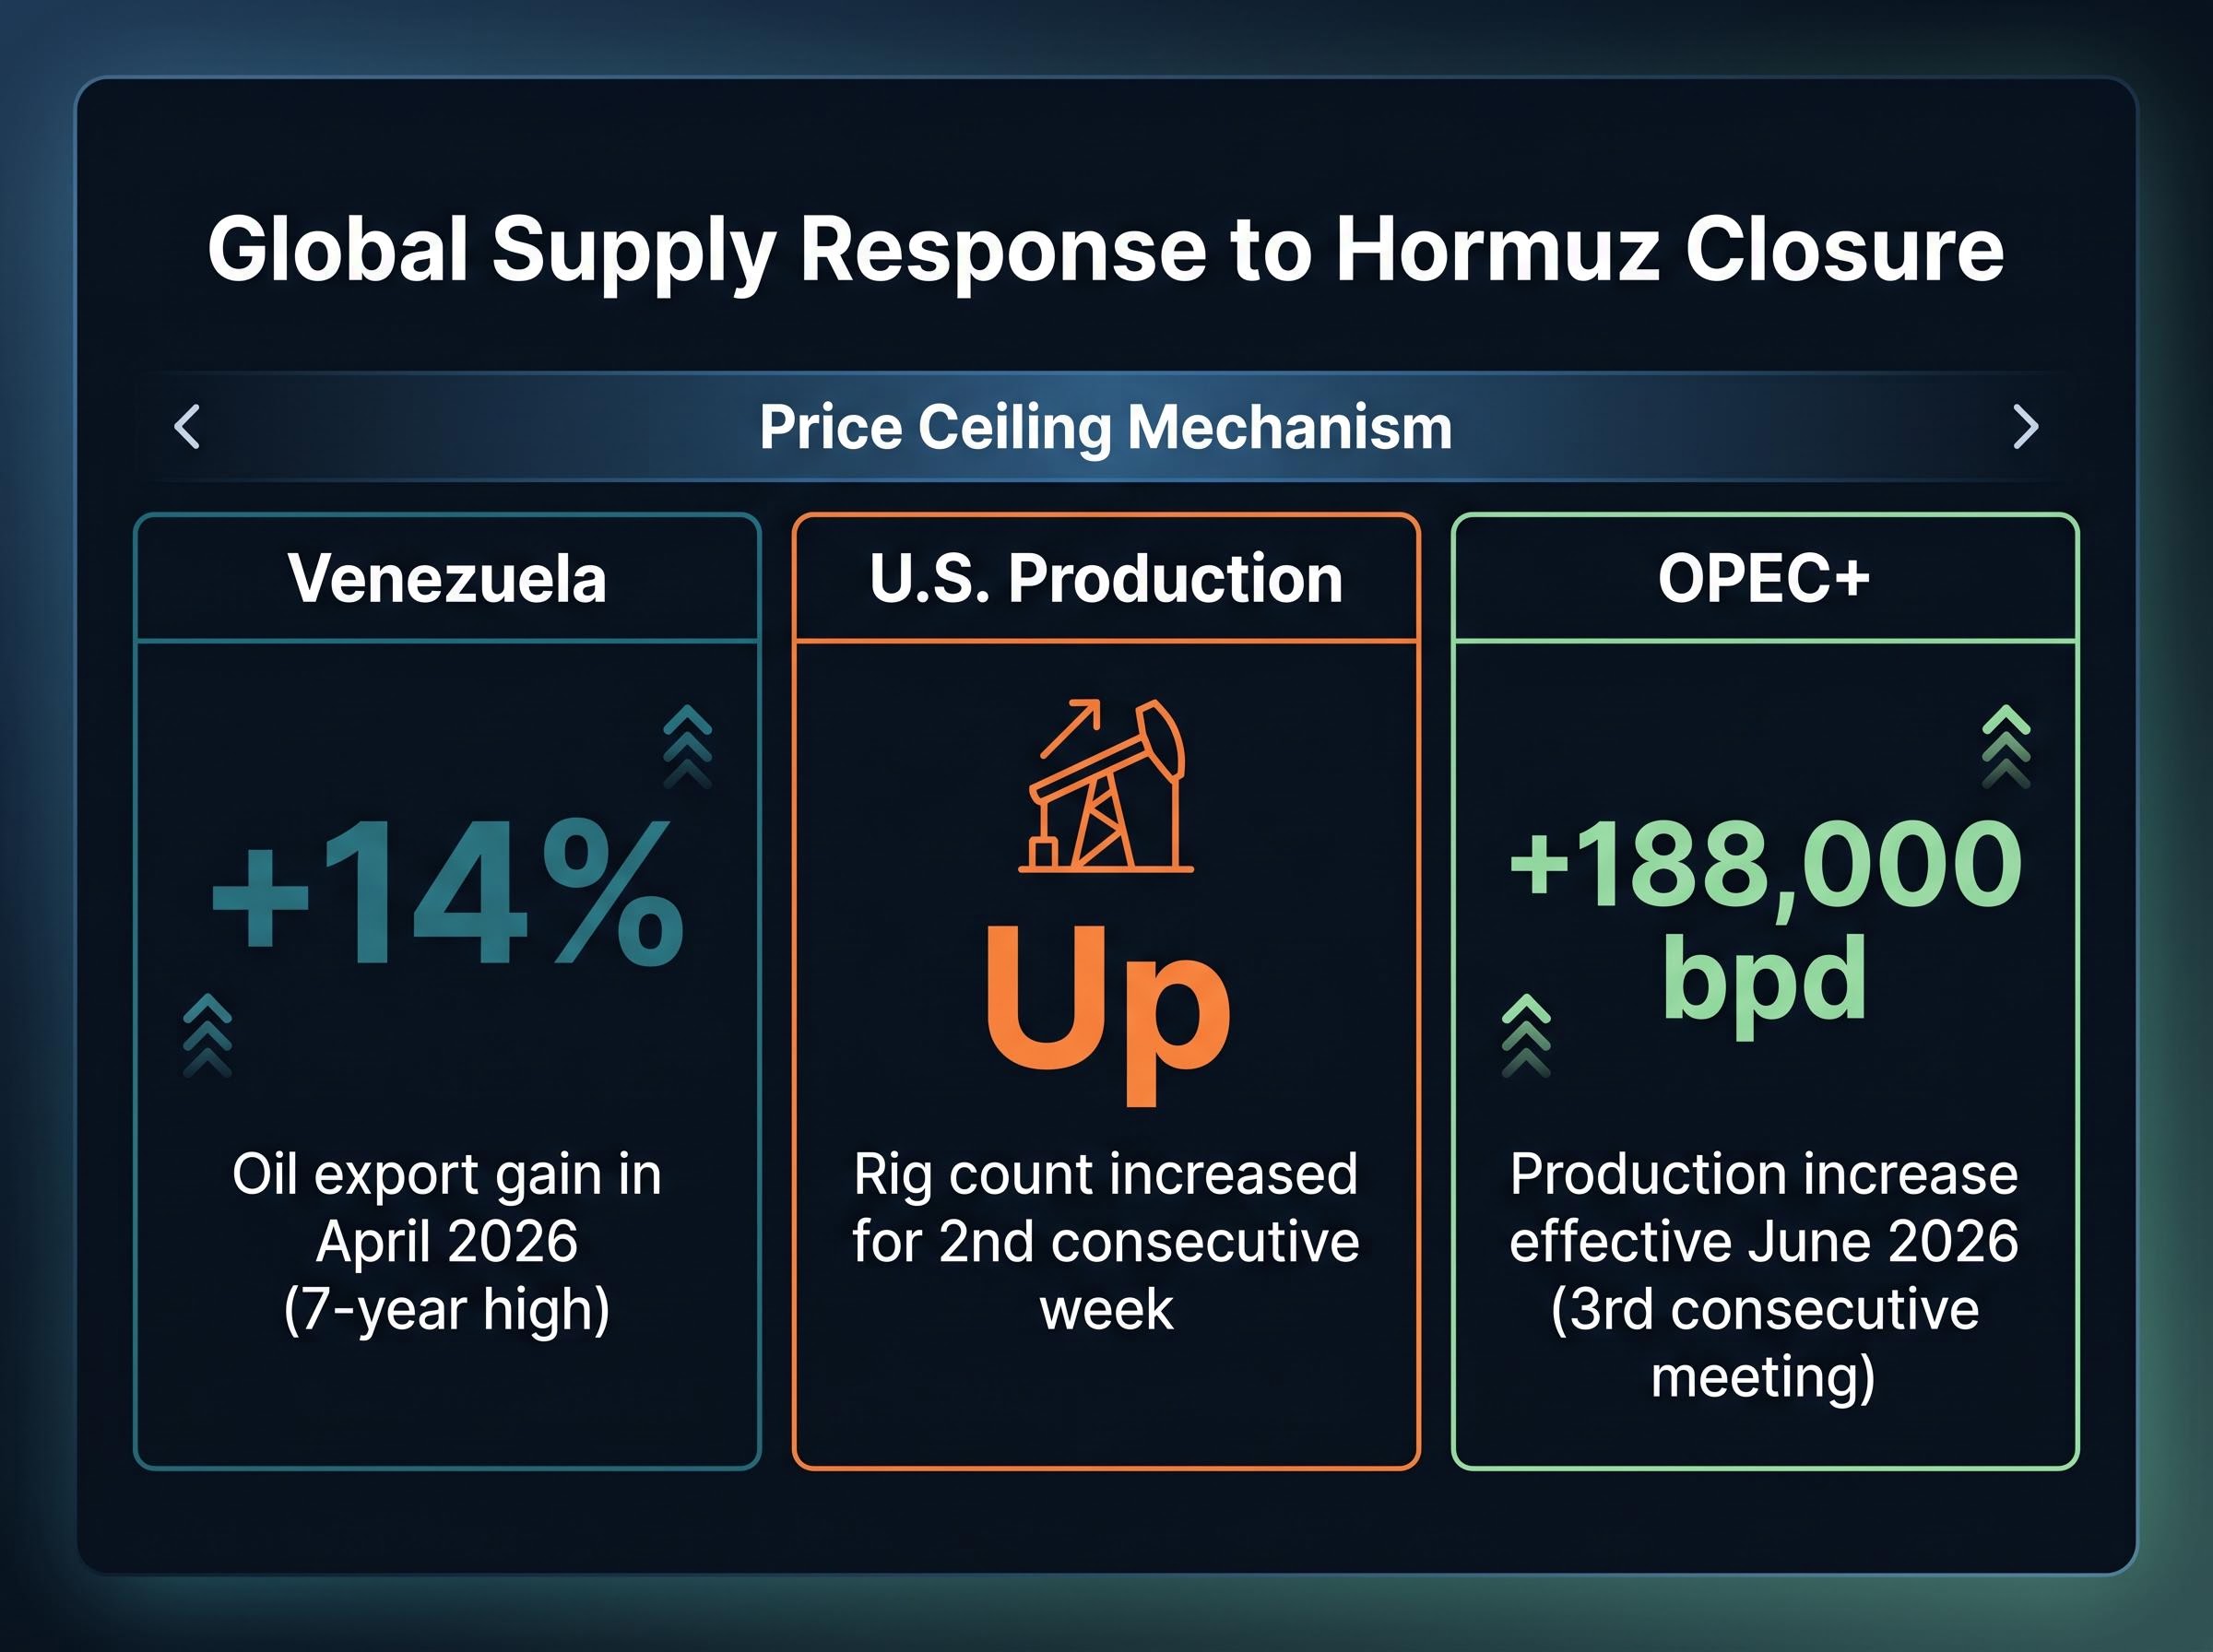
Three concurrent supply responses are visible:
These responses create a floor-and-ceiling dynamic. The Hormuz closure provides the floor: persistent demand for alternative supply keeps prices elevated. The supply mobilisation provides the ceiling: each additional barrel from Venezuela, U.S. shale, and OPEC+ limits how far prices can run before alternative supply catches up.
The supply cushioning mechanisms keeping Brent below analyst forecasts of $150-$200 include Saudi Petroline running at its physical ceiling of 7 million barrels per day, Chinese stockpile resales, and sanctions waivers, but each is capacity-constrained, meaning the framework that has held prices below forecast extremes cannot absorb an escalation in disruption duration indefinitely.
A Reuters investigation identified bets worth up to $7 billion placed across multiple exchanges in March and April 2026, preceding major Iranian policy announcements. The U.S. Commodity Futures Trading Commission (CFTC) is examining the trades, though no formal investigation has been publicly confirmed as of 8 May 2026.
The CFTC insider trading enforcement landscape shifted materially in early 2026 when the regulator issued a dedicated advisory and pursued its first formal action in this category, providing the legal and procedural context within which the commission is now examining the commodity futures bets linked to Iranian policy announcements.
The supply response picture is what separates a temporary price spike from a structural energy shock. If alternative supply can scale fast enough to replace Hormuz volumes before storage levels become critical, the risk premium will deflate without a demand destruction event.
The 8 May session is over. What matters now is which signals will determine whether this week’s pullback is the beginning of a sustained de-escalation or a temporary pause inside a broader uptrend. Ranked by probable market impact:
The technical levels, sourced from FOREX24.PRO analysis on 8 May 2026, provide the price map:
| Level | Price (Brent, $/bbl) | Implication |
|---|---|---|
| Upside target | $116.35 | Bullish momentum continuation |
| Near-term support | $95.65 | Active test level; buyers expected |
| Critical support | $95.05 | Rally thesis invalidated if breached |
| Extended downside | $80.55 | Scenario if critical support fails |
Knowing which signals matter most allows investors to allocate attention efficiently. Not every headline will move markets, but a confirmed peace framework or a storage level breach below 95 days would be genuinely market-moving events.
Pull back from the session-level detail and the year-to-date arc comes into focus. Brent opened 2026 at $61.41. It closed on 8 May at $103.56. Nearly 69% of gains accumulated during the conflict escalation period. The price at which oil trades today is not a supply-demand equilibrium; it is a fear-adjusted number reflecting the market’s estimate of how long the world’s most important chokepoint remains closed.
The weekly decline of approximately 7% is a sign that markets are beginning to price in a non-zero probability of resolution. It is not a sign that the risk is over. The gap between those two readings matters enormously for positioning.
Barclays set its 2026 Brent average forecast at $100/bbl, with a conditional $110/bbl scenario if Hormuz disruptions persist through the end of May. This represents the institutional anchor for the year-ahead view.
One confirmed gap in available data deserves acknowledgement: no verified information exists on major importer emergency responses, including China strategic petroleum reserve releases, Indian supply rerouting, or Japanese import substitution. That represents the next layer of this story, and it could materially alter the supply picture when it becomes visible.
If the 14-point framework is signed and the Strait reopens, the $10-$20 per barrel risk premium could unwind rapidly. That implies a potential return toward $80-$85/bbl on Brent, roughly in line with the pre-crisis trajectory adjusted for tighter fundamentals.
A complete price collapse is unlikely in that scenario. The Goldman Sachs storage figure of 101 days means physical demand for restocking would cushion the downside; refiners and importers who drew inventories during the closure would need to rebuild them. The floor would hold, but it would hold at a level substantially below where Brent trades today.
These statements are speculative and subject to change based on the pace and terms of any diplomatic resolution.
The core lesson from 8 May is that oil price volatility driven by geopolitical risk premium behaves differently from volatility driven by supply-demand fundamentals. A supply-demand move reflects a change in the physical balance of the market. A risk premium move reflects a change in the market’s estimate of probability, of conflict persisting, of a chokepoint reopening, of a deal being signed. The two types require different investor responses.
The indicators that matter going forward are not the daily headline price. They are:
Deutsche Bank has noted that markets have not yet fully priced in a worst-case outcome, meaning the upper bound on risk remains higher than current prices reflect. The outcome is genuinely uncertain. A military escalation that closes Hormuz permanently would be structurally different from a resolved standoff, and no current forecaster has verified visibility on which scenario prevails.
Retail investors who entered this article confused by a 3% spike that turned into a weekly loss can now separate the components: the spike was fear, the reversal was hope, and the weekly decline is the market’s honest assessment of where the balance of probabilities sits today.
For investors who have seen oil whipsaw while equity indices hold near highs and want to understand why those two signals coexist, our dedicated guide to geopolitical risk and equity markets examines how markets process military escalation as a probability-adjusted earnings input, why the S&P 500 closed near record levels even as the Caspian Pipeline attack removed 1.7 million barrels per day from circulation, and under what specific conditions the historical resilience pattern breaks down.
This article is for informational purposes only and should not be considered financial advice. Investors should conduct their own research and consult with financial professionals before making investment decisions. Past performance does not guarantee future results. Financial projections are subject to market conditions and various risk factors.
A geopolitical risk premium is the extra cost added to oil prices above what supply and demand fundamentals alone would justify, reflecting the market's estimate of the probability that a conflict or disruption will reduce future supply. In the current Hormuz crisis, analysts estimate this premium at roughly $10-$20 per barrel above fundamental value.
The Strait of Hormuz is the only maritime exit for oil exports from major Gulf producers including Saudi Arabia, Iraq, Iran, Kuwait, and the UAE, carrying approximately 20 million barrels per day in 2024, which equals roughly 20% of global petroleum liquids consumption. Its effective closure removes the world's single most concentrated energy bottleneck from the supply chain.
The intraday spike to around $103.37 was triggered by reports of armed exchanges between U.S. and Iranian forces near the Strait of Hormuz, which expanded the geopolitical risk premium. The partial reversal occurred after President Trump stated the ceasefire remained nominally in effect and reports circulated of a 14-point peace framework, which compressed that risk premium and capped the upside.
Three concurrent supply responses are capping prices: Venezuelan oil exports rose 14% in April 2026 to a seven-year high, U.S. rig counts increased for a second consecutive week, and OPEC+ voted to add 188,000 barrels per day effective June 2026. These alternative barrels create a ceiling that prevents prices from running unchecked even as the Hormuz disruption provides a durable price floor.
Technical analysis cited in the article identifies $95.65 as a near-term support level where buyers are expected, $95.05 as a critical support level whose breach would invalidate the rally thesis, $116.35 as the upside target if bullish momentum continues, and $80.55 as the extended downside scenario if critical support fails.