Approximately $4.5 trillion sits in Australian managed funds as of December 2025, according to APRA and RBA data. Yet most retail investors holding units in these funds, often indirectly through superannuation, cannot explain what a managed fund actually is or how their money is being allocated within one.
Managed funds remain one of the most widely used investment vehicles in Australia. They are also among the least understood. The mechanics of unit pricing, the layered fee structures, and the distinction between growth and defensive assets are frequently overlooked before capital is committed. Recent regulatory updates from ASIC, including revised fee disclosure standards under Regulatory Guide 97 (November 2024) and updated conduct expectations under INFO 270 (April 2025), have made fund disclosures more transparent and comparable than in prior years. That makes this a practical moment to understand how managed funds work from the ground up.
This guide walks through the structure of managed funds, the types of assets they hold, how fees compound over time, what to look for in a Product Disclosure Statement, and how to evaluate a fund manager before making any investment decision.
What a managed fund actually is and how your money moves through it
A managed fund pools capital from multiple investors. A professional investment manager then allocates that combined pool across a range of assets, including equities, bonds, property, and cash, on behalf of all participants. The investor does not choose individual holdings. The manager does, guided by the fund’s stated objectives.
When an investor puts money into a managed fund, they receive units representing their proportional stake in the total pool. They do not directly own the underlying shares, bonds, or property the fund holds. They own a fraction of the whole.
Returns arrive through two mechanisms:
- Capital growth: the unit price rises as the market value of the fund’s underlying assets increases.
- Income distributions: the fund periodically pays out earnings (such as dividends or interest received from its holdings), which can be taken as cash or reinvested as additional units.
There is no capital guarantee. If the assets held by the fund decline in value, unit prices fall, and investors may incur losses.
How unit prices are calculated and what they mean for you
A fund’s unit price equals the net asset value of its total holdings divided by the number of units on issue. If a fund holds $100 million in assets and has 50 million units outstanding, each unit is worth $2.00.
Unit prices are typically recalculated daily, meaning an investor’s returns are directly tied to market movements in whatever the fund holds. This daily repricing is what connects the investor’s experience to the real-time performance of equities, bonds, or other assets sitting inside the fund.
When big ASX news breaks, our subscribers know first
Growth assets versus defensive assets: understanding what your fund holds
Every managed fund holds a mix of asset types, and those types fall into two broad categories. Understanding the distinction is the single most useful step in matching a fund to an investor’s own timeframe and risk tolerance.
Growth assets, such as equities and real estate, carry higher short-term volatility. Prices can swing sharply over weeks or months. Over longer periods, however, growth assets have historically delivered higher returns than defensive alternatives. An investor with a 10-year horizon and the capacity to absorb short-term drawdowns is typically better positioned for a growth-heavy allocation.
Defensive assets, including cash, gold, and fixed-income instruments such as government bonds, are designed for stability. Returns tend to be lower but more consistent. These assets are commonly used to reduce overall portfolio volatility or to preserve capital closer to a withdrawal date.
Most funds blend both categories. The specific mix is disclosed in the fund’s Product Disclosure Statement (PDS), which also specifies the fund’s intended risk profile and suggested minimum investment timeframe.
Cyclical and defensive allocation decisions extend beyond managed fund selection into direct equity portfolios, where the timing of sector tilts across the economic cycle, shifting from consumer cyclicals in early recovery toward industrials and technology as investment accelerates, produces meaningfully different return profiles from the same underlying asset categories.
| Asset Category | Examples | Key Characteristics |
|---|---|---|
| Growth | Equities, real estate | Higher risk, greater return potential, susceptible to pronounced short-term swings |
| Defensive | Cash, gold, fixed-income instruments | Lower risk, more consistent returns, designed for capital stability |
Investors should align a fund’s suggested minimum investment timeframe with their own long-term goals before committing capital. A mismatch between the two is one of the most common causes of poor investor outcomes.
How managed funds actually make money for investors: the role of the Product Disclosure Statement
The PDS is the mandatory document every managed fund must issue before accepting investor capital. It discloses the fund’s objectives, asset allocation, risk profile, suggested minimum investment timeframe, and all fees. Most investors treat it as a compliance formality. It is, in practice, the single most useful comparison tool available before investing.
Four items in any PDS deserve close reading:
- Objectives and strategy: what the fund is trying to achieve and how it intends to get there.
- Asset allocation: the target mix of growth and defensive assets, including allowable ranges.
- Risk profile: the level of volatility the fund expects and the types of risk it is exposed to.
- Total fee disclosure: the full cost of ownership, including management fees, buy/sell spreads, performance fees, and indirect costs.
The total management costs figure matters more than the headline management fee. Buy/sell spreads and performance fees can add materially to the cost of ownership, and they are frequently buried deeper in the document.
What ASIC’s 2024-2025 regulatory updates mean for your PDS reading
ASIC updated Regulatory Guide 97 in November 2024, clarifying how managed funds must disclose ongoing fees, performance fees, and transaction costs. The update improved consistency in how management costs and buy/sell spreads are presented, making it easier for investors to compare fee disclosures across funds.
ASIC Regulatory Guide 97 sets the binding standards for how managed funds must present fees and costs in Product Disclosure Statements and periodic statements, giving investors a consistent framework for comparing the true cost of different funds on a like-for-like basis.
ASIC also updated INFO 270 in April 2025, strengthening expectations around clear descriptions of investment strategy, risks, liquidity, and the use of leverage or derivatives. Fund managers are now expected to avoid misleading labelling and ensure marketing materials do not overstate performance.
In January 2025, ASIC issued interim stop orders on several high-risk managed funds due to inadequate Target Market Determinations (ASIC Media Release 25-012MR). This means funds are now subject to stricter enforcement ensuring they are marketed only to investors who genuinely match the fund’s risk profile, reducing the likelihood of being sold an inappropriate product.
The real cost of managed funds: fees, spreads, and the compounding drag on returns
Three fee components determine the true cost of holding a managed fund:
- Management expense ratio (MER): an annual percentage charged against the fund’s total assets to cover management and administration.
- Buy/sell spread: a transaction cost applied when investors enter or exit the fund, covering the cost of buying or selling underlying assets.
- Performance fees: an additional charge levied by some active managers when returns exceed a specified benchmark, often layered on top of the base MER.
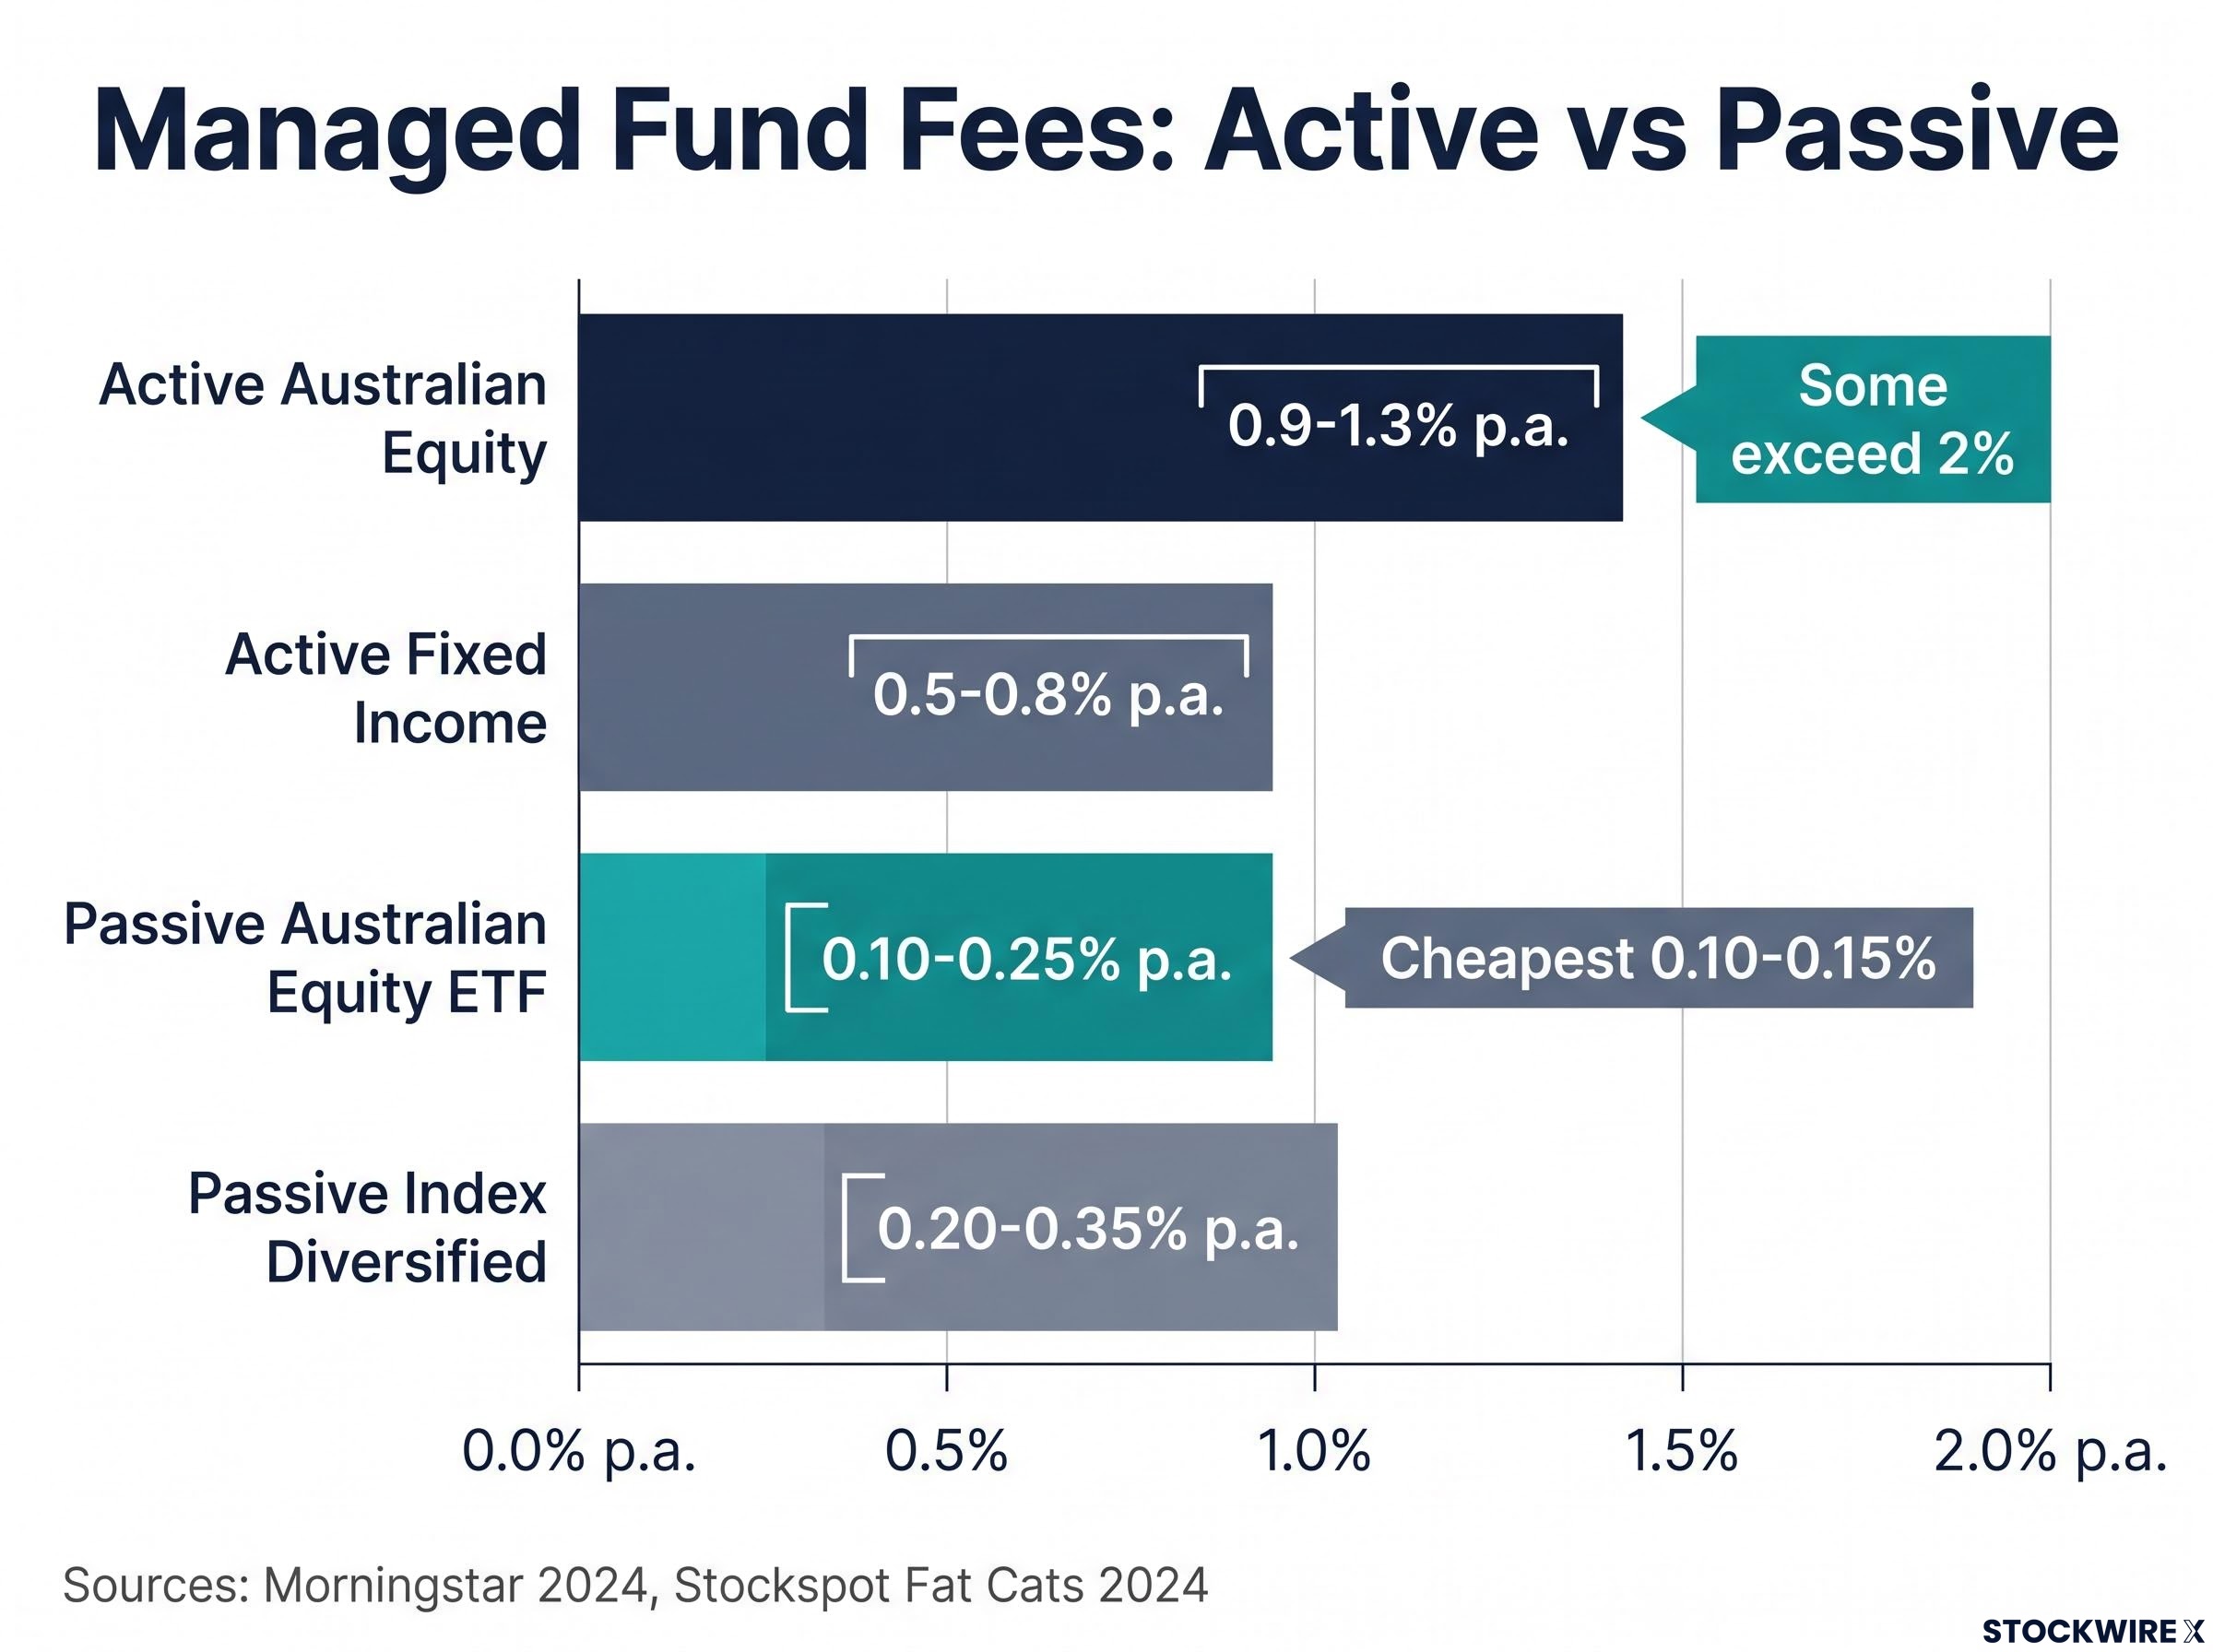
The gap between active and passive fees in Australia remains substantial. According to Morningstar’s 2024 data, active Australian equity funds (retail, asset-weighted) carry MERs clustered at roughly 0.9-1.3% per annum. Some high-fee active diversified funds exceed 2% per year when indirect costs and performance fees are included, according to the Stockspot Fat Cats 2024 report.
Passive Australian equity ETFs, by contrast, sit at approximately 0.10-0.25% per annum on an asset-weighted basis. The cheapest broad-market ETFs charge as little as 0.10-0.15% per annum.
That fee difference of roughly 0.7-1.3 percentage points per year may appear modest in isolation. Compounded over a 20-year investment horizon, it represents a meaningful reduction in terminal portfolio value. Fees are the one variable entirely within an investor’s control before committing capital.
The arithmetic of fee compounding on long-term returns is more punishing than most investors intuitively expect: SPIVA data shows more than 75% of Australian active equity managers failed to beat their benchmark after fees over the decade to December 2023, and the cheapest fee quintile of multisector growth funds achieved an 87% success rate compared to just 14% for the most expensive quintile.
| Fund Type | Typical MER Range | Notes |
|---|---|---|
| Active Australian Equity | 0.9-1.3% p.a. | Retail, asset-weighted; some exceed 2% with indirect costs |
| Active Fixed Income | 0.5-0.8% p.a. | Retail, asset-weighted |
| Passive Australian Equity ETF | 0.10-0.25% p.a. | Asset-weighted; cheapest at ~0.10-0.15% |
| Passive Index Diversified | 0.20-0.35% p.a. | Total costs often under 0.50% p.a. |
Always examine total management costs in the PDS, not just the headline management fee. Buy/sell spreads, performance fees, and indirect costs can materially increase the true cost of ownership.
Past performance does not guarantee future results. Fee comparisons are based on published industry data and may vary by individual fund.
A structured due diligence process for assessing fund managers
Selecting a fund manager does not need to be an intimidating judgment call. It can be reduced to a repeatable sequence of checks that covers regulatory standing, costs, performance, and governance.
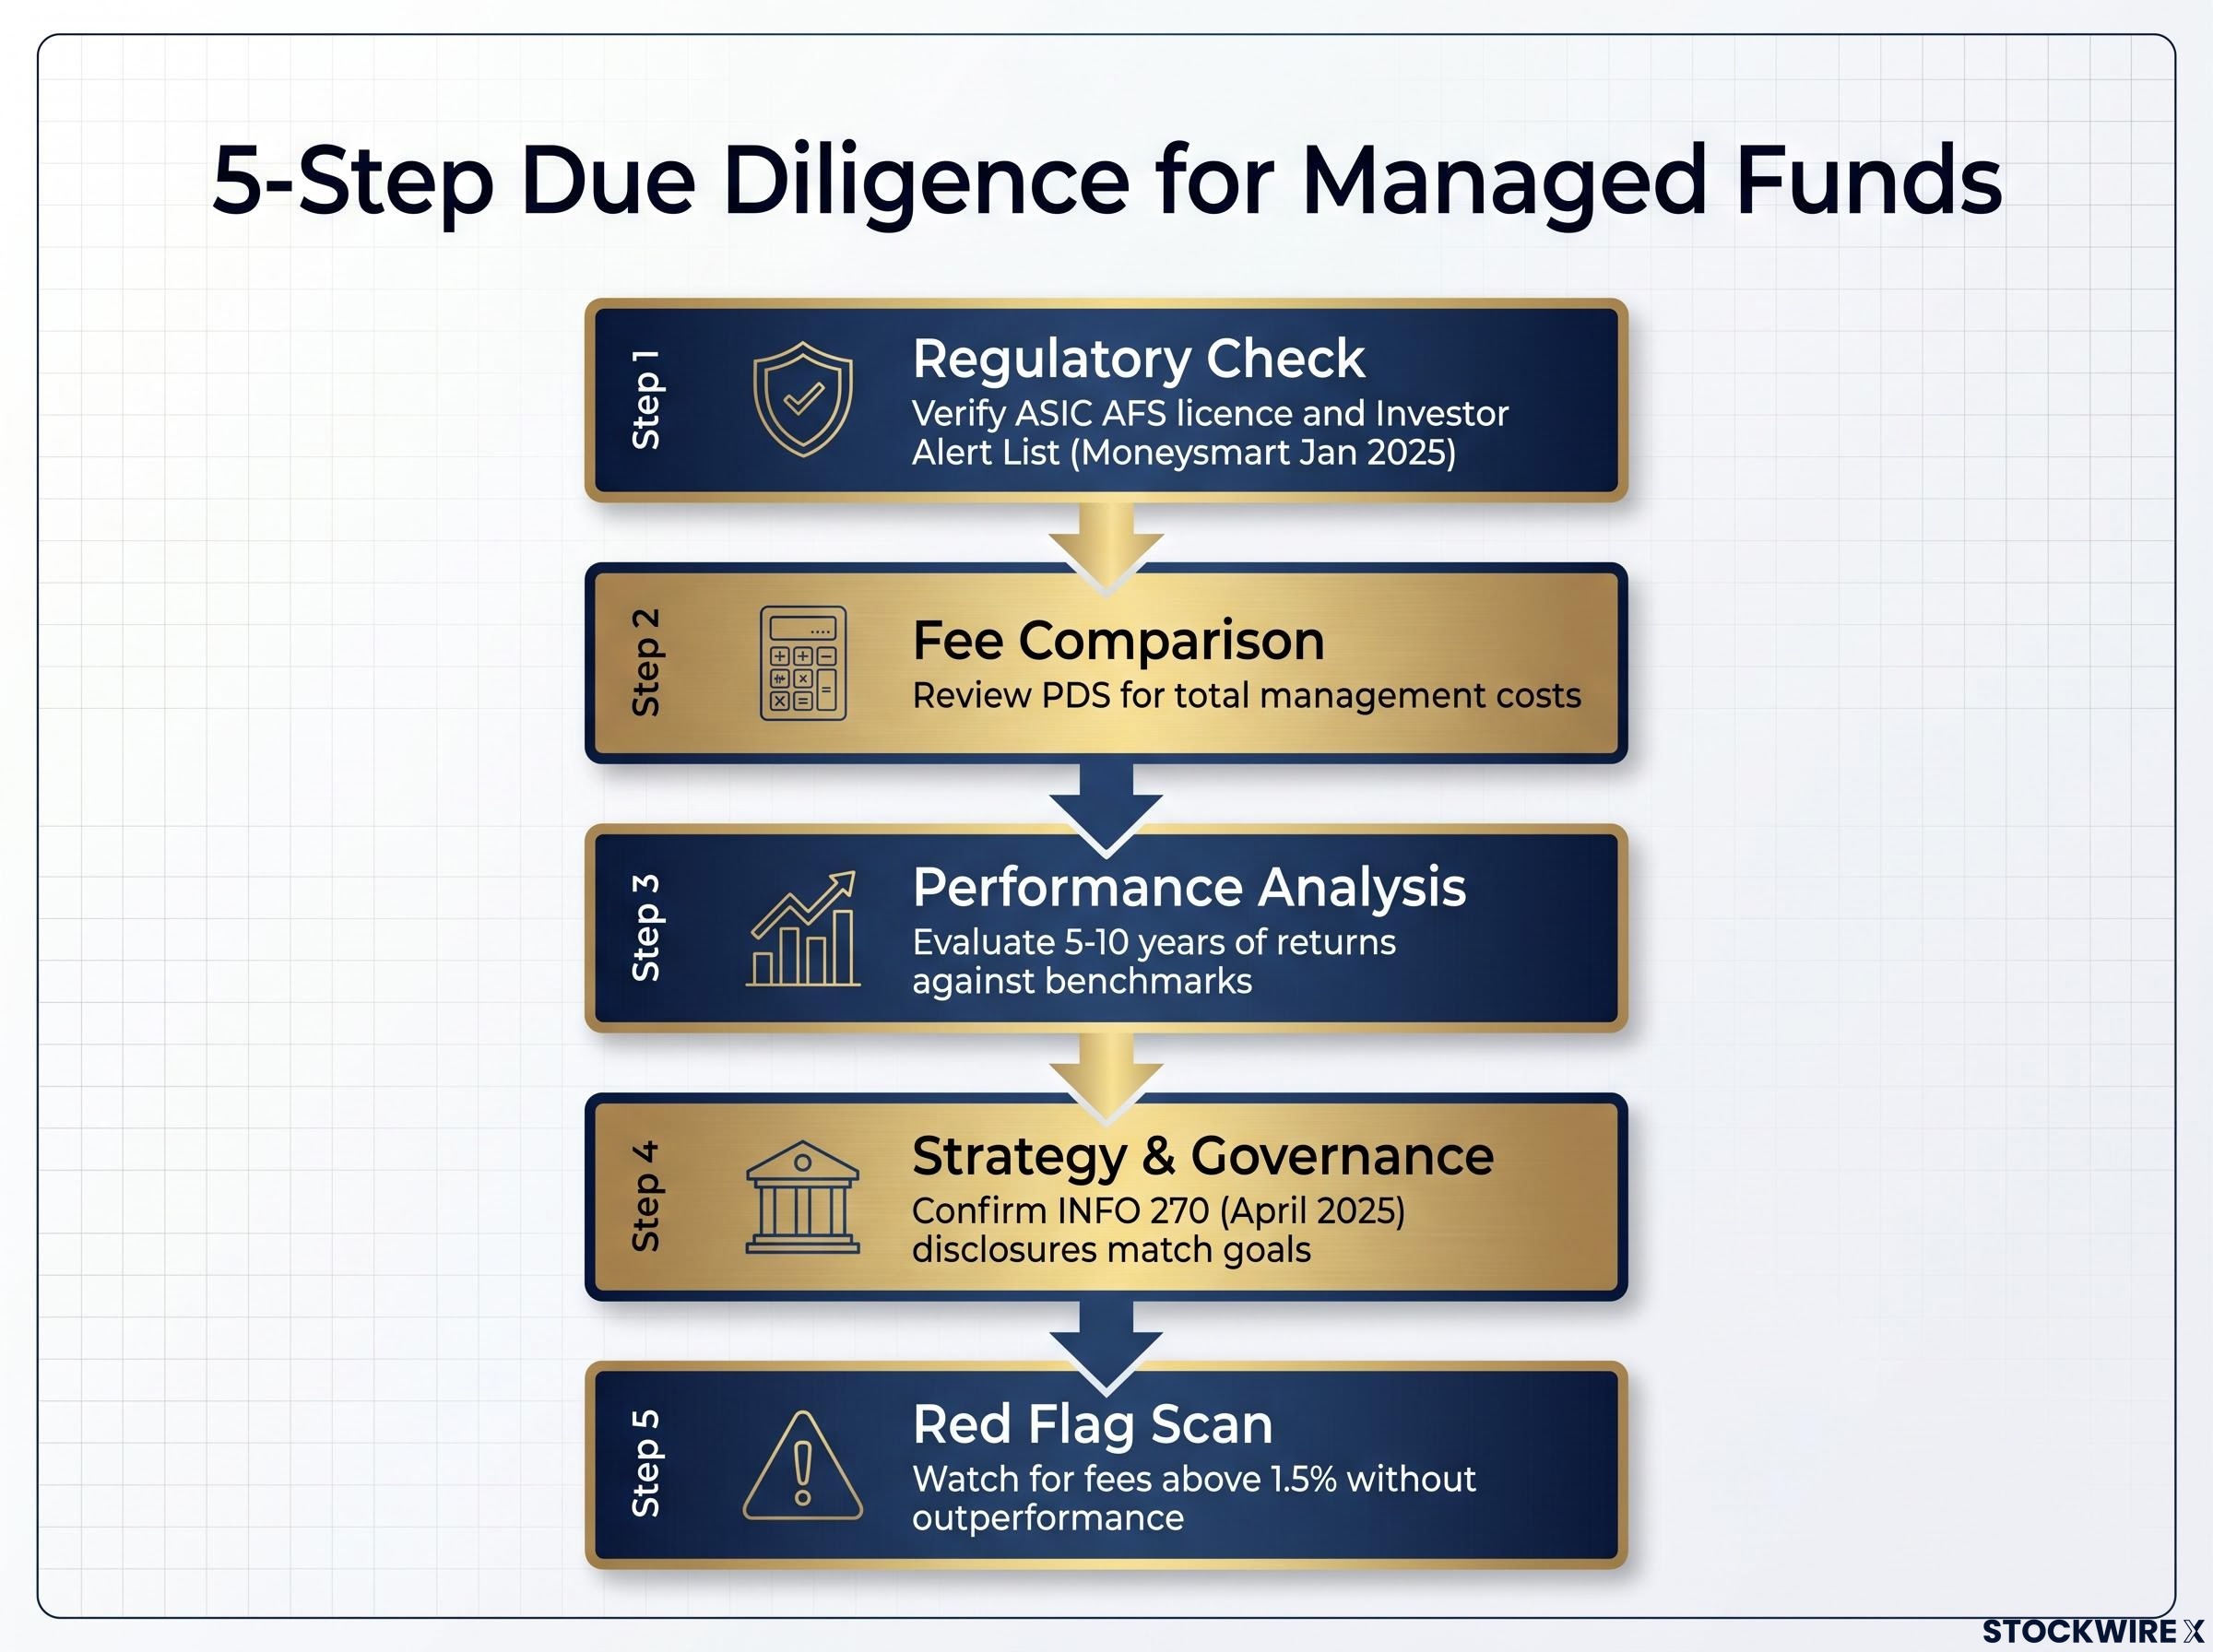
- Regulatory check: Verify the responsible entity’s AFS licence status on ASIC’s registers and cross-reference the fund against ASIC’s Investor Alert List. This step is non-negotiable. According to ASIC Moneysmart (updated January 2025), this is the foundational first step before any further analysis.
- Fee comparison: Review total management costs in the PDS, including performance fees and buy/sell spreads. Compare with similar funds in the same category. Funds in the top fee quartile without consistent outperformance warrant scrutiny.
- Performance analysis: Evaluate at least 5-10 years of returns against an appropriate benchmark. Check consistency over time rather than relying on a single strong year. Independent research such as Morningstar ratings provides a more reliable view than marketing documents.
- Strategy and governance review: Confirm the fund’s investment strategy, asset allocation, and risk level match the investor’s goals and timeframe. Review key personnel stability, style consistency, and whether the responsible entity, custodian, and auditor are clearly disclosed. ASIC’s updated INFO 270 (April 2025) now requires clear description of strategy, risks, liquidity, and any use of leverage or derivatives.
- Red flag scan: Screen for the warning signs listed below before proceeding.
Red flags that should make you pause or walk away
The following warning signs should prompt caution or further investigation before committing capital:
- Promised or implied guaranteed returns, or very high returns with low risk
- Complex or opaque strategies that are difficult to understand
- Pressure to invest quickly or outside normal channels
- Unsolicited promotion via social media or cold calls
- High fees above 1.5% per annum without demonstrated persistent outperformance
- Short manager track record or frequent portfolio manager changes
- Complex derivatives or leverage in funds labelled as conservative or balanced
- Misleading labelling (for example, a fund called “cash” that holds high-risk assets)
Investors wanting to apply the structured framework above to a specific fund selection decision will find our comprehensive walkthrough of managed fund due diligence covers the full three-layer process in detail, including real-world lessons from the 2024-2025 First Guardian and Shield Master Fund collapses that resulted in combined losses of approximately $1.1 billion across roughly 11,800 investors.
The shift every Australian investor should understand: why the market is moving toward passive funds
Active Australian equity funds experienced net outflows over FY2024 and continued redemptions in H1 FY2025. Over the same period, passive equity strategies, particularly ETFs, captured the bulk of net retail inflows. Australian-listed ETFs recorded record net inflows over FY2024, according to Morningstar Australia.
The numbers reflect a calculation that a growing number of investors have already made.
55% of Australian investors aged 18-34 now own ETFs, up from 45% in the prior ASX Investor Study, according to the ASX Australian Investor Study 2025 (published April 2025). Across all age groups, ETF ownership rose to 39%, up from 32%.
Three documented forces are driving the shift:
- Fee sensitivity: the compounding cost difference between active and passive strategies is increasingly well understood by retail investors.
- Benchmark underperformance: many active strategies have struggled to consistently outperform their benchmarks after fees over extended periods.
- Growth of digital brokerage platforms: younger investors are using brokerage apps to buy ETFs directly, bypassing traditional distribution channels.
Active strategies are not universally inferior. Some active global equity and alternative strategies continued attracting inflows during the same period. The shift is concentrated in core equity and diversified allocations, where passive alternatives offer broad market exposure at a fraction of the cost.
Building a sound starting point for managed fund investing in Australia
The decision sequence for a new investor follows the structure this guide has outlined. Understand what a managed fund is and how units work. Identify whether the fund’s asset mix matches the investor’s timeframe and risk tolerance. Read the PDS for total costs and investment objectives. Evaluate the fund manager using the structured due diligence process. Consider how the active-passive fee gap will affect long-term outcomes.
ASIC’s updated disclosure requirements under RG 97 and INFO 270 mean investors now have better comparison tools than in prior years. The PDS should be used as an active decision-making document, not filed away unread.
For regulatory verification of any fund, ASIC’s Moneysmart platform and ASIC’s registers are the starting point. Licensed financial advisers remain relevant for investors whose situations involve complexity beyond what a PDS and independent research can resolve.
For investors who have already committed capital to an active fund, our full explainer on fund manager style drift walks through the five-step detection framework covering PDS review, holdings comparison, personnel monitoring, and communication quality audits, along with the specific regulatory obligations SMSF trustees carry when mandate fidelity cannot be confirmed.
Managed funds carry no capital guarantee. Alignment between a fund’s risk profile and the investor’s own timeframe and tolerance is the foundational prerequisite before any commitment of capital.
This article is for informational purposes only and should not be considered financial advice. Investors should conduct their own research and consult with financial professionals before making investment decisions.