Eurozone inflation data for July lands within days, and the instinct most investors will feel is to treat the headline number as a verdict. If it ticks higher, the temptation is to read it as confirmation that inflation is reaccelerating. If energy prices are the reason, the temptation doubles.
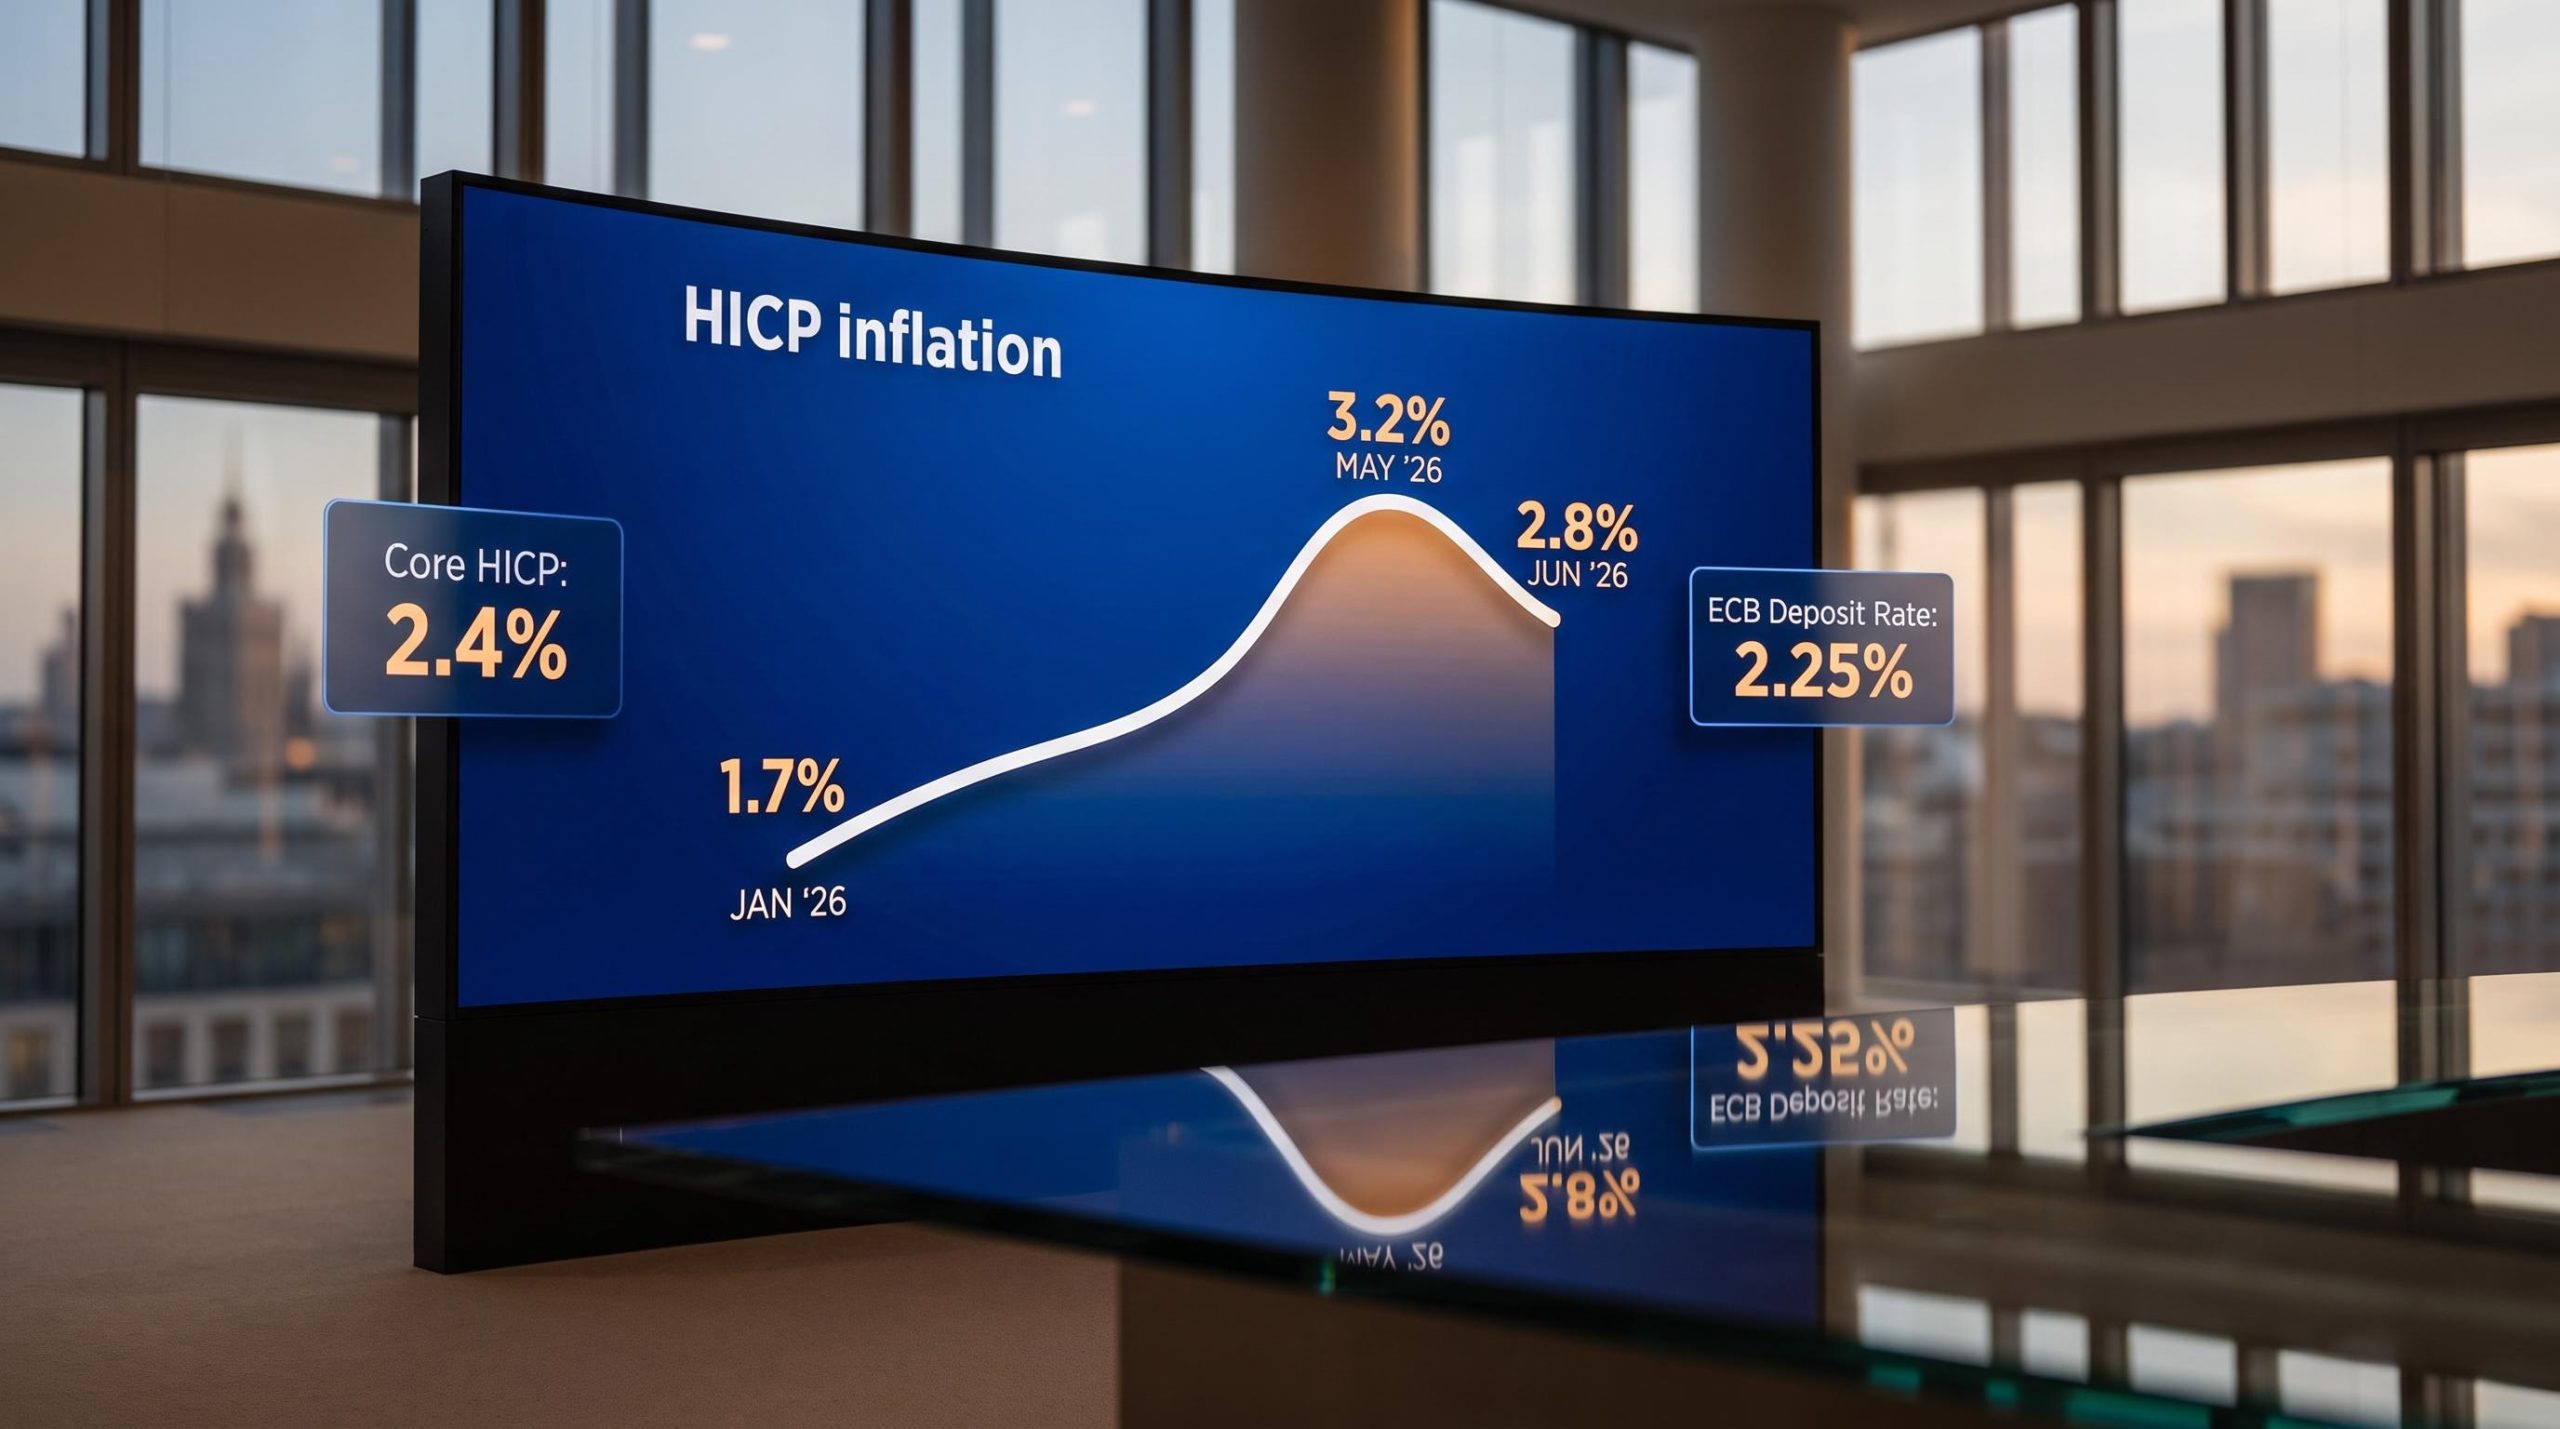
That instinct is about to be tested. Headline Harmonised Index of Consumer Prices (HICP), the eurozone’s primary inflation gauge, decelerated from 3.2% in May to 2.8% in June, the first monthly decline of 2026. Core HICP, which strips out volatile energy and food, fell to 2.4%. A potential July uptick driven by Middle East energy disruptions would arrive against that cooling backdrop, and the gap between the trend and any single-month spike is where the real analytical question lives.
Here is what this piece gives you: the specific numbers inside the July release worth watching, the ones worth weighting lightly, and the structural reasons why energy-driven headline moves are unlikely to change the long-term equity case. By the time Eurostat publishes, you will have a framework for reading the print in real time rather than reacting to it.
What June’s numbers tell you before you read July’s
The trajectory matters more than any single print, and June’s data established a trajectory worth anchoring to.
Eurozone headline HICP rose steadily from 1.7% in January to 3.2% in May. June broke the pattern, falling to 2.8%, the year’s first deceleration.
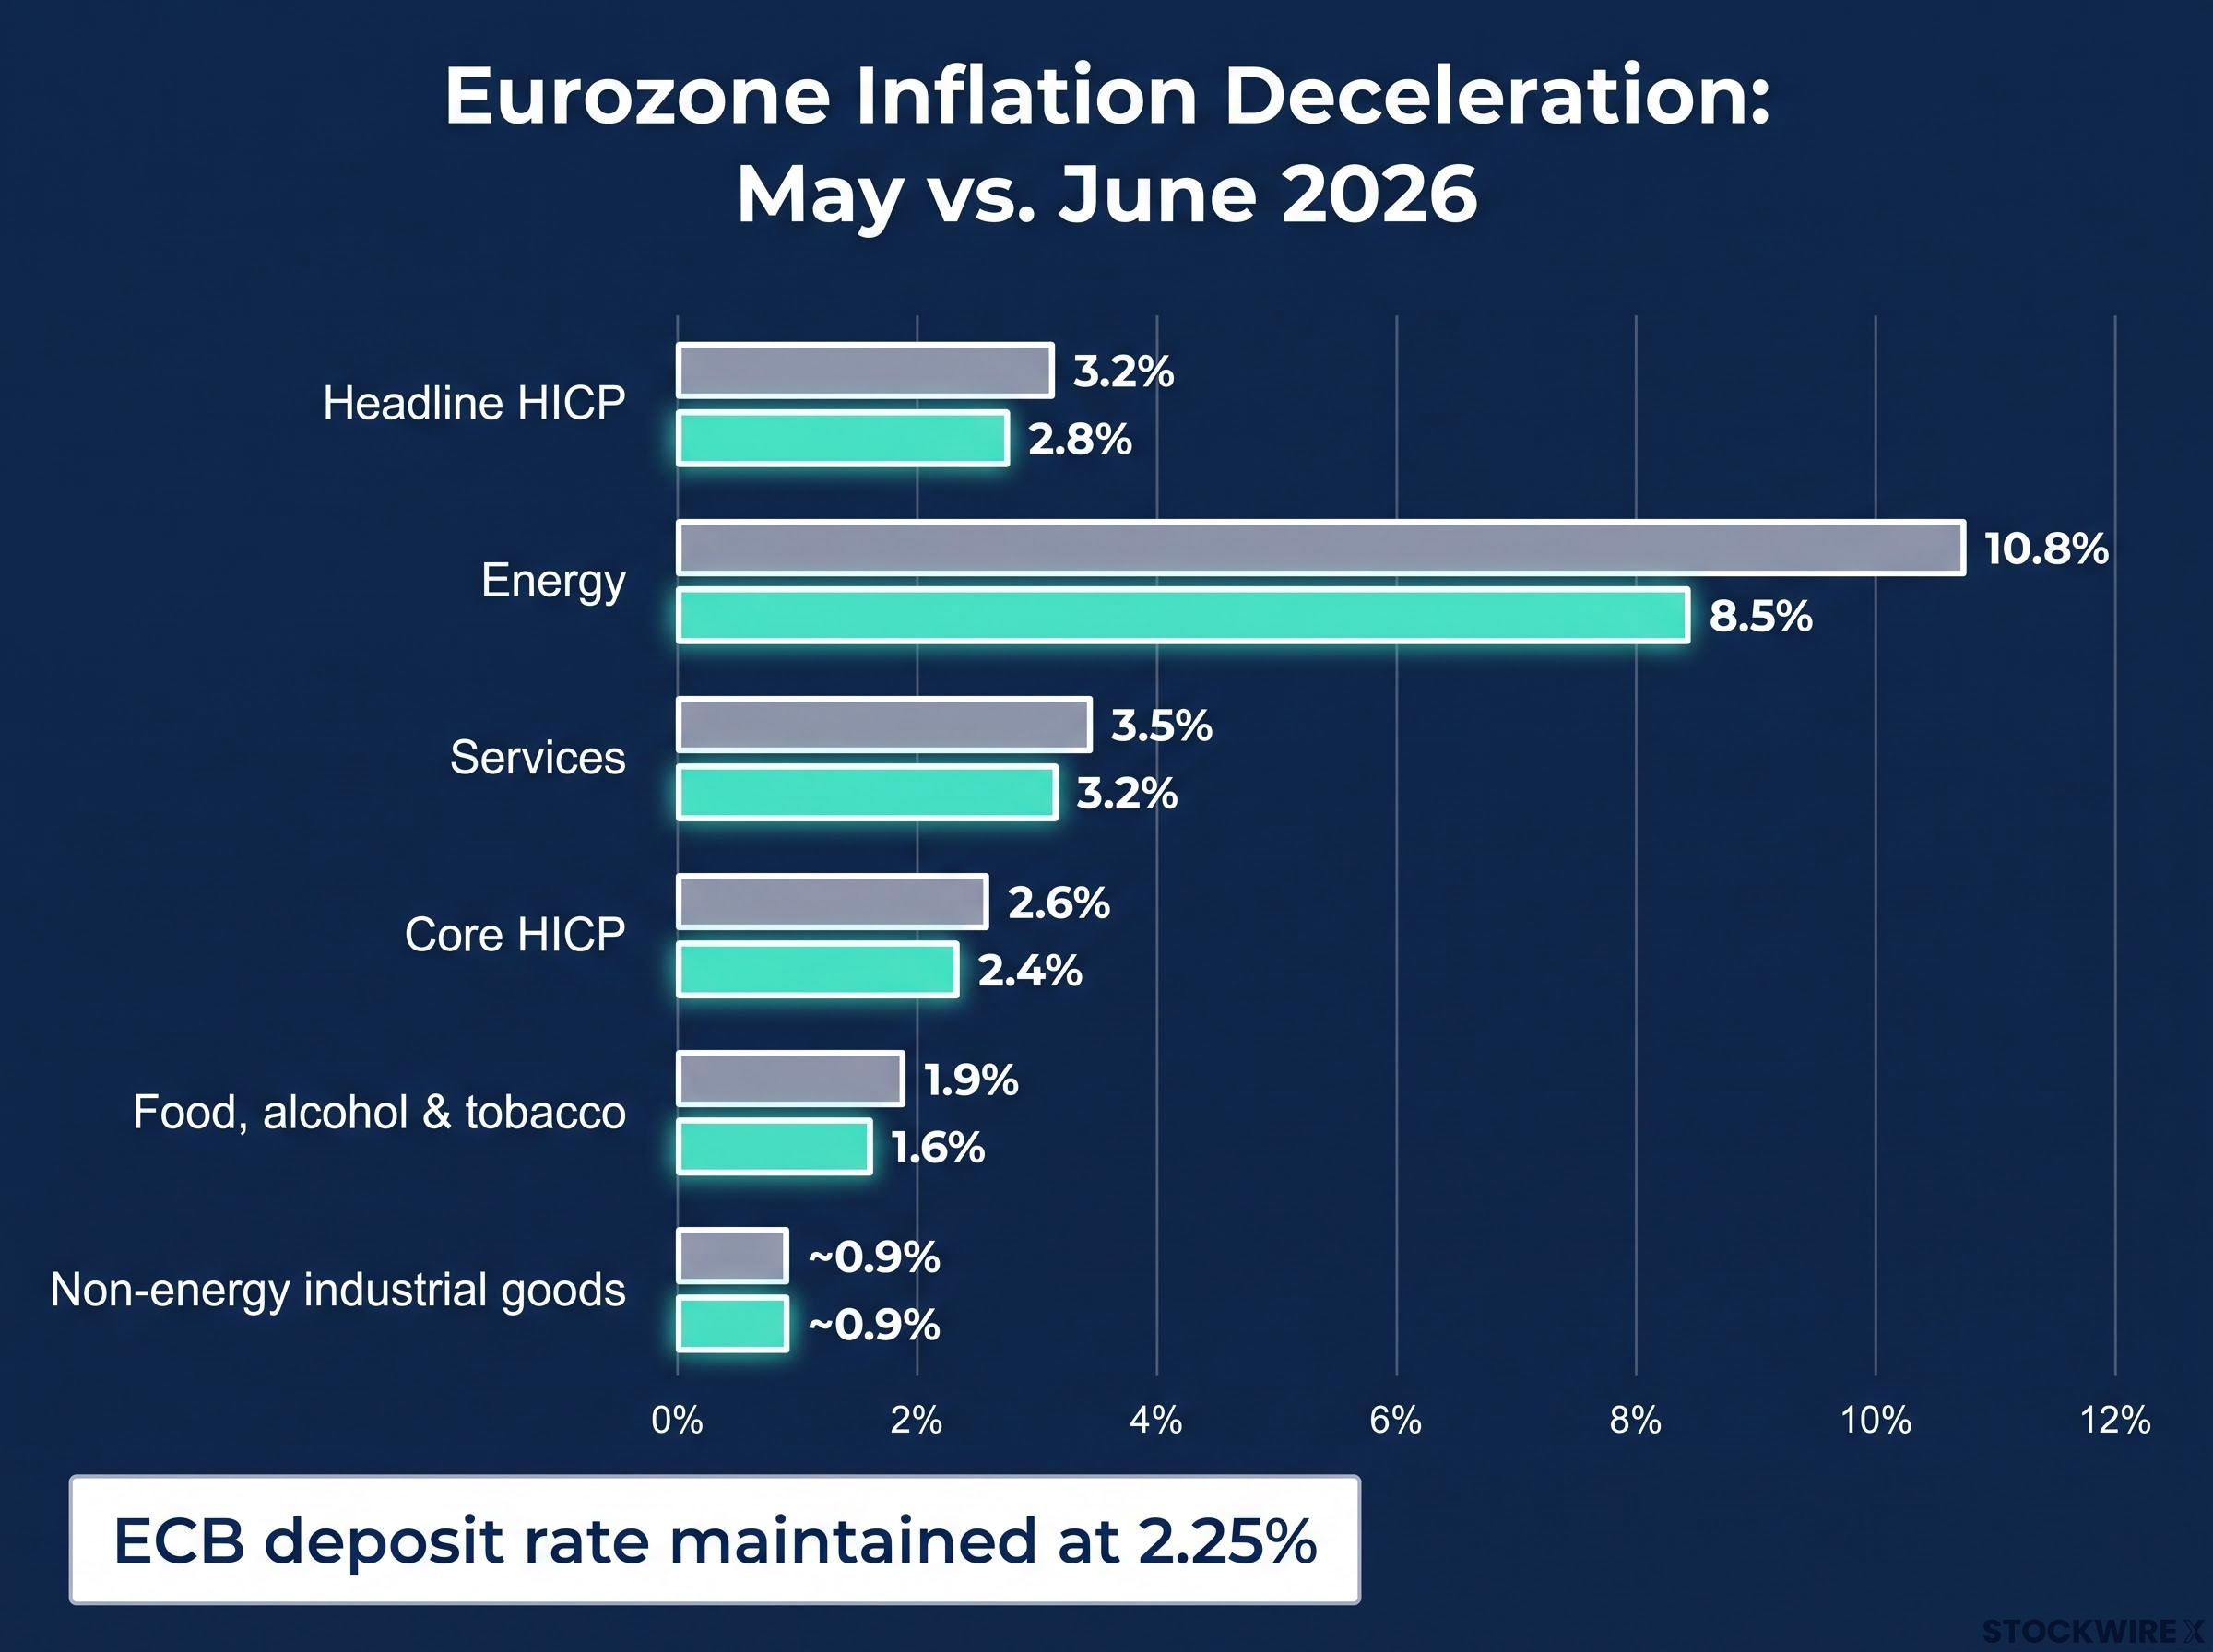
Eurozone inflation climbed from 1.7% in January 2026 to 3.2% in May, then reversed to 2.8% in June, marking the first monthly decline of the year.
The decline was broad-based. Energy inflation dropped from 10.8% to 8.5%. Services eased from 3.5% to 3.2%. Core HICP fell from 2.6% to 2.4%. Food, alcohol, and tobacco slowed from 1.9% to 1.6%. Non-energy industrial goods held steady near 0.9%.
| Indicator | May 2026 | June 2026 |
|---|---|---|
| Headline HICP (YoY) | 3.2% | 2.8% |
| Core HICP (ex-energy & food) | 2.6% | 2.4% |
| Energy | 10.8% | 8.5% |
| Services | 3.5% | 3.2% |
| Food, alcohol & tobacco | 1.9% | 1.6% |
| Non-energy industrial goods | ~0.9% | ~0.9% |
| ECB deposit rate | 2.25% | 2.25% |
The breadth of that deceleration is the detail that matters most heading into July. If the next print ticks higher and the driver is energy alone, you are looking at an interruption of a cooling trend, not confirmation of a new inflationary regime. That distinction should govern how you think about positioning.
Headline versus core divergence was also the central diagnostic in the US May 2026 print, where a 1.3 percentage-point gap between 4.2% headline CPI and 2.9% core confirmed a geopolitical energy spike rather than demand-driven overheating, a pattern that maps closely onto the eurozone’s own June configuration.
When big ASX news breaks, our subscribers know first
Why energy has a smaller grip on the inflation basket than it feels
Energy prices dominate headlines because they are visible every time you fill a car or open a utility bill. Their mathematical influence on the inflation reading is another matter entirely.
Energy accounts for approximately 9.0% of the eurozone HICP basket in 2026. That weight is smaller than most investors assume, and the arithmetic is worth working through slowly.
The Eurostat HICP methodology updates product weights annually, which means the energy basket share reflects current consumption patterns rather than a fixed historical estimate, making the 9.0% figure a live input into each month’s arithmetic rather than a static assumption.
- Energy’s basket weight: 9.0%
- Hypothetical year-on-year energy price surge: 20%
- Direct contribution to headline inflation: approximately 1.8 percentage points (20% x 9.0%)
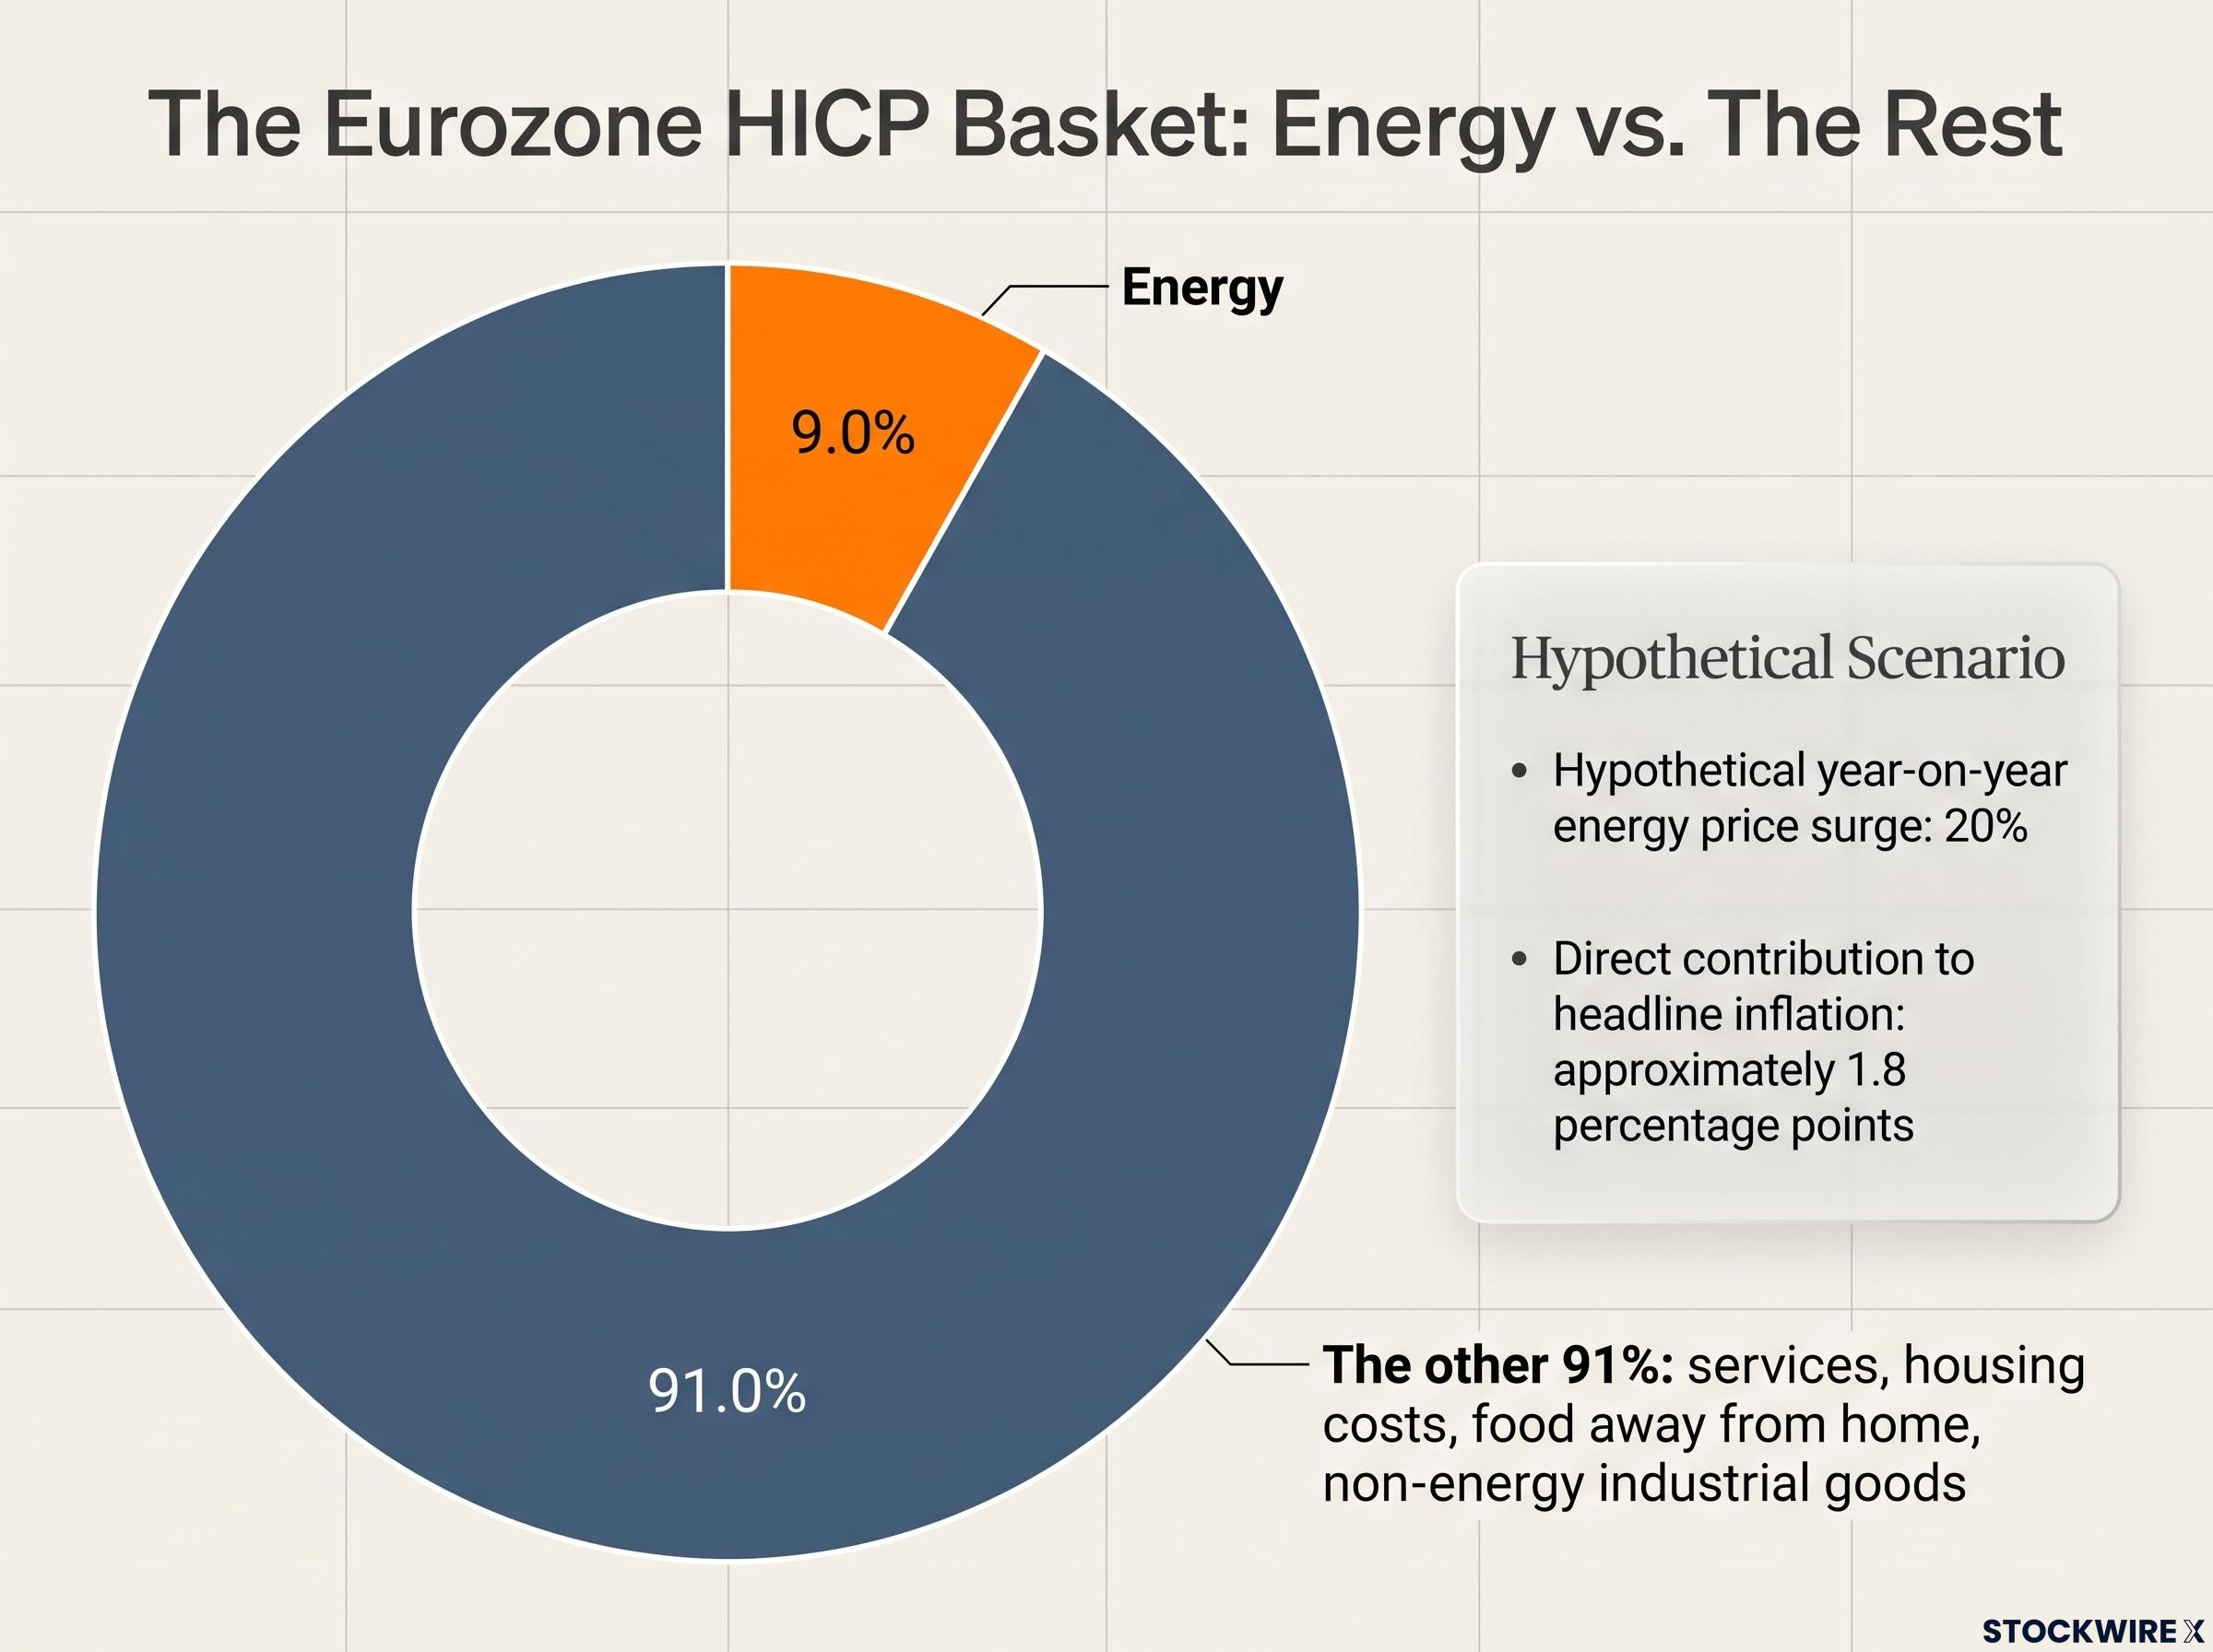
That is the ceiling of impact from a dramatic energy move, assuming everything else stays constant.
The other 91%
The remaining 91% of the basket, services, housing costs, food away from home, non-energy industrial goods, moves on a different clock. These components are driven by wages, rental contracts, and structural supply conditions. They do not spike overnight because a tanker route is disrupted.
June illustrated the point clearly. Energy inflation was still elevated in absolute terms at 8.5%, yet headline HICP fell because core and services were cooling. The slow-moving majority of the basket overwhelmed the fast-moving minority.
For you, this arithmetic means that even a sharp energy spike cannot manufacture broad inflation on its own. Understanding the weight structure is what separates a measured response to July’s print from a reflexive one.
The 2022 energy shock as the clearest historical template
The Russia-Ukraine conflict in 2022 produced one of the most severe energy supply shocks in modern European economic history. Crude prices surged to a peak of approximately $133 per barrel in the weeks following Russia’s invasion. European natural gas markets, which were particularly exposed to Russian supply disruptions, experienced an even more dramatic dislocation.
The normalisation arc is the part worth studying. Crude recovered to broadly pre-war price levels across roughly six months from that peak. European natural gas followed a comparable trajectory. By 2024, eurozone inflation was back near 2-3%, confirming that the energy spike, severe as it was, did not permanently reset the inflation regime.
Three structural features of energy markets explain why this pattern tends to repeat:
- Global market integration allows supply to reroute and substitute sources to enter within quarters, not years.
- Price-responsive new supply emerges as elevated prices make previously marginal production economically viable.
- Substitution and efficiency acceleration occurs as governments, businesses, and households respond to high prices by reducing energy intensity.
The 2022-to-2024 arc shows that energy shocks are time-limited disruptions rather than lasting resets to the inflation regime. A move that looked like a structural shift unwound within a handful of quarters.
The relevant question for any Middle East-driven energy disruption is not “how high does headline inflation go?” It is “how long until it normalises?” The historical answer is measured in quarters, not years. That changes how you should respond to a single elevated print.
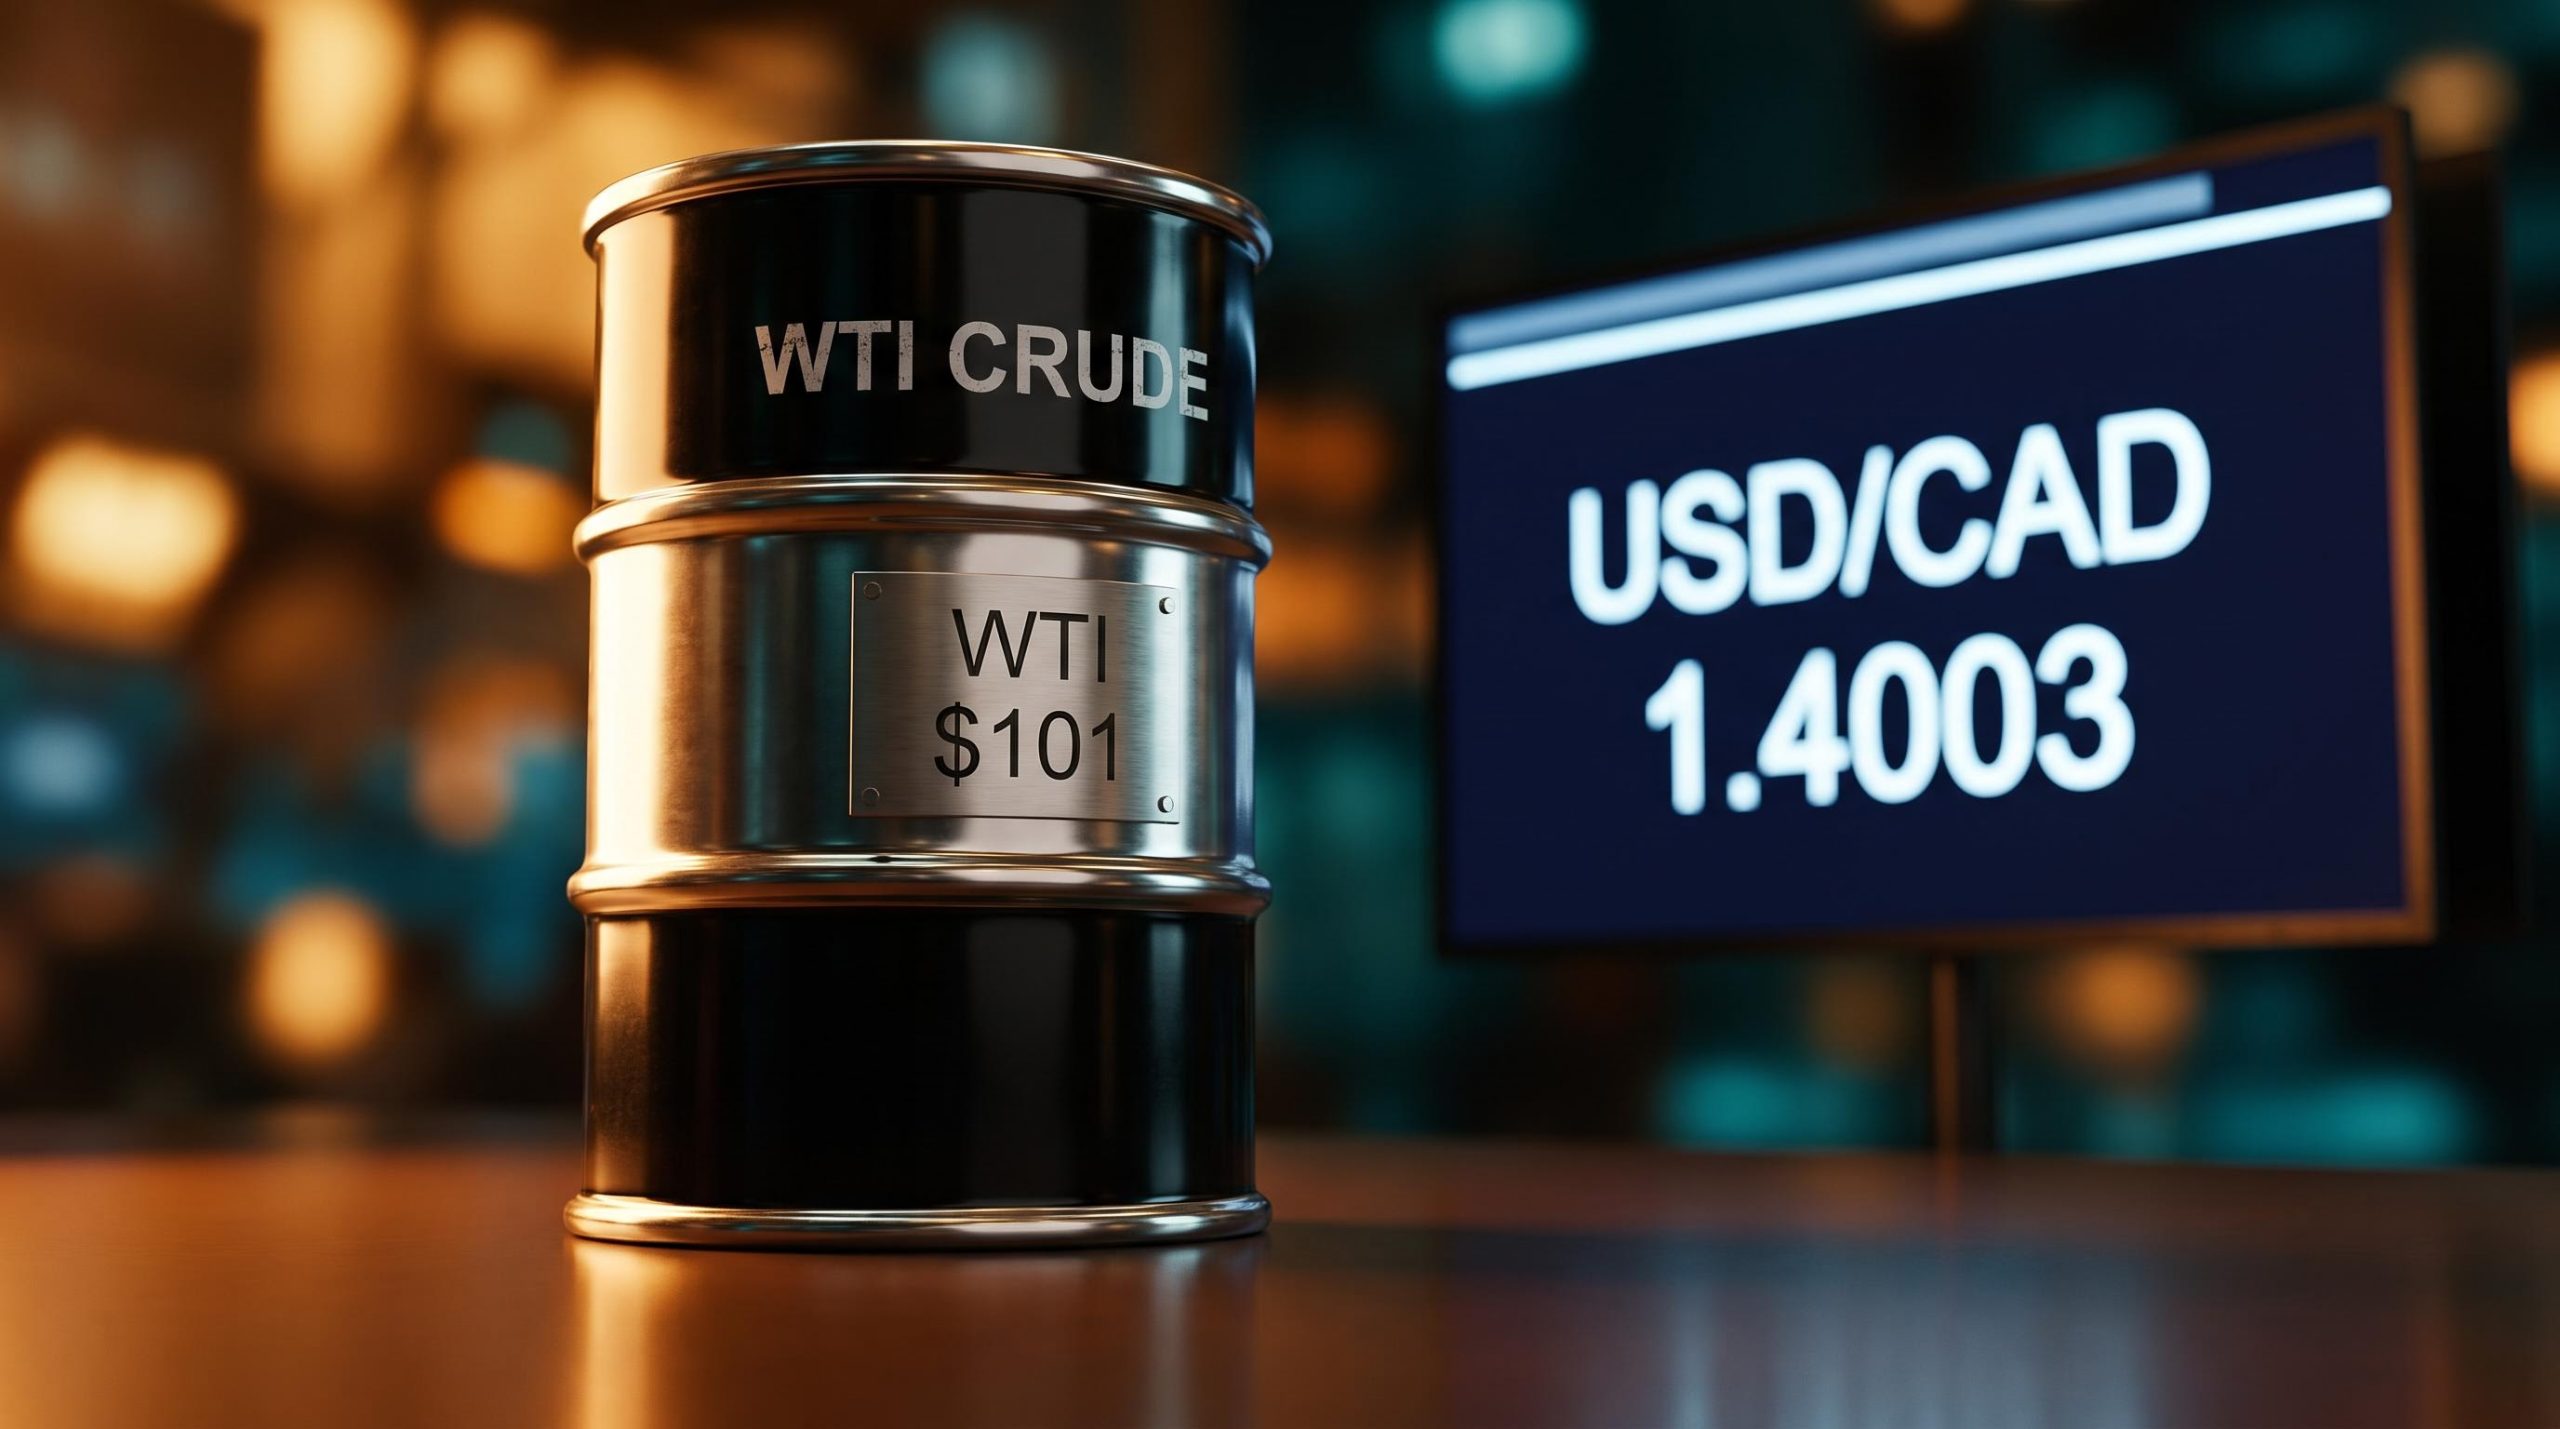
Hormuz supply disruption is the exogenous shock sitting behind any July energy reacceleration, with tanker crossings falling to as few as five per day in early July from a baseline of 80-100, a physical-market signal that often leads crude futures in confirming how severe the operational dislocation actually is.
What the data actually mean for equity investors over time
Across extended holding periods, broad equity markets have historically posted average annual nominal gains of around 10%, while inflation has typically run at roughly 3% per year. That gap, roughly 7 percentage points of real return per year, is the structural reward for equity ownership, and it has persisted through multiple inflation episodes.
Transitory versus structural: the distinction that matters
Not all inflation is equal from an equity perspective, and the current configuration points clearly toward the less threatening category.
Transitory, supply-driven inflation, the category that includes most energy shocks, affects headline readings for a few quarters before normalising. It does not change the discount rates that drive equity valuations in a durable way because central banks typically look through it.
Structural, demand-driven inflation, such as wage-price spirals or permanent shifts in monetary regimes, is the category that compresses equity valuations over time. It forces central banks to raise rates aggressively and hold them there, which reprices future earnings.
The current indicators point toward the transitory category:
- Core HICP at 2.4% in June and declining
- Services inflation easing from 3.5% to 3.2%
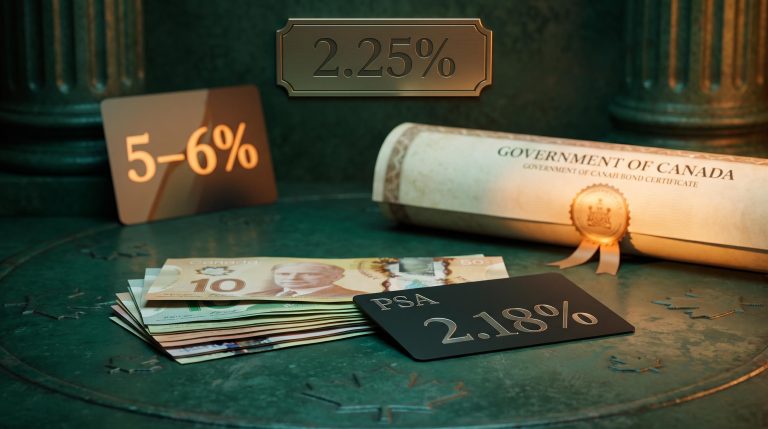
- The European Central Bank (ECB) holding its deposit rate at 2.25% with no signal of a hawkish pivot
- No evidence of a wage-price spiral in eurozone data
This distinction is not academic for your portfolio. It is the variable that determines whether a short-term adjustment is warranted or whether staying invested through the noise is the rational move. The evidence currently points firmly toward the latter.
The ECB September rate path is the variable that matters most for equity discount rates, and the 23 July statement’s language on second-round effects, specifically whether Lagarde signals that energy is staying contained within the headline rather than bleeding into services, carries more forward-rate information than the July HICP print itself.
This article is for informational purposes only and should not be considered financial advice. Investors should conduct their own research and consult with financial professionals before making investment decisions.
How to read the July release when it lands
Eurostat’s July flash estimate is due 31 July 2026, with the preliminary estimate expected 1 August 2026. Here is a three-step reading protocol you can apply the moment the numbers appear.
- Decompose the headline by component. Eurostat breaks the print into energy, food, services, and non-energy goods contributions. If most of any increase versus June’s 2.8% comes from energy, with other components stable or lower, you are looking at a narrow, supply-driven move, not renewed broad pressure.
- Check core HICP against the 2.4% baseline. June’s core reading of 2.4% is the anchor. If July core holds at that level or edges lower, the underlying inflation trend remains intact regardless of what the headline does.
- Assess the ECB reaction function. With the deposit rate at 2.25% and core already declining, a single energy-driven headline month is unlikely to shift the Governing Council’s medium-term assessment. If the ECB’s communication stays patient, the discount rate environment for equities does not change.
If energy is driving the headline higher and core is stable, this is not a signal to reposition. It is the inflation basket’s arithmetic doing exactly what history says it does.
| Indicator | Benign signal | Concerning signal |
|---|---|---|
| Headline move | Uptick driven primarily by energy | Uptick broad-based across components |
| Core direction | Stable at or below 2.4% | Re-acceleration above 2.6% |
| Services direction | Continued easing below 3.2% | Reversal back above 3.5% |
| ECB implication | Patient stance unchanged | Hawkish pivot signalled |
Within minutes of the release, this framework lets you categorise July’s print as signal or noise rather than waiting for financial media to tell you what to think.
What changes after July, and what does not
What does not change
Energy-driven headline moves update the short-run picture. They do not change the medium-term inflation trend, the ECB’s policy trajectory, or the structural case for equity ownership over long horizons. June’s data confirmed broad deceleration across core, services, and food. The 2022 energy shock confirmed that even severe supply disruptions normalise within quarters. The ECB’s 2.25% deposit rate reflects a central bank that watches core, not headline, when setting policy.
A single monthly print does not override any of that.
What to watch beyond July
Three variables would genuinely warrant a reassessment if they shifted:
- Middle East energy persistence: If elevated energy prices persist long enough to feed into transport costs, food production costs, and service sector pricing, second-round effects could push core higher. Duration matters more than the initial spike.
- Eurozone wage data: Renewed acceleration in negotiated wages would be the clearest signal that a supply shock is morphing into a demand-driven problem. Watch ECB wage tracker releases in Q3.
- ECB communication shift: If the Governing Council begins responding to headline rather than core in its forward guidance, the discount rate assumption changes, and that would matter for equity valuations.
Unless core and wages show simultaneous re-acceleration, the July release will change some numbers on your screen but is unlikely to change the decisions that matter for a long-horizon investor. Anchoring to time horizon remains the most reliable decision variable: earnings growth, structural valuations, and core inflation trajectory deserve far more weight than any single monthly headline print.
For investors wanting a concrete framework to act on the transitory versus structural distinction, our dedicated guide to inflation-era portfolio positioning covers specific asset class tilts, including TIPS, REITs, and quality equities, for the scenario where energy-driven headline inflation normalises without a demand spiral following.
Past performance does not guarantee future results. Financial projections are subject to market conditions and various risk factors.