Most Australian investors choose a managed fund by looking at past returns first. It is an intuitive instinct, but it misses the variable that compounds most reliably against them: fees. A 1% difference in annual management costs, left to compound over 20 years, can erode tens of thousands of dollars from a portfolio’s final value, regardless of how well the underlying assets perform.
The stakes of getting this decision wrong have sharpened. In 2024-2025, the collapses of the First Guardian Master Fund and the Shield Master Fund resulted in combined losses of approximately $1.1 billion, affecting roughly 11,800 investors. These were not obscure products. They were distributed through well-known superannuation platforms, and ASIC has since brought civil penalty proceedings against multiple trustees for governance and due diligence failures.
This guide walks through three practical evaluation layers for selecting a managed fund in Australia: understanding fees and their compounding impact, assessing a fund manager’s quality and credentials, and matching a fund to personal financial goals and risk tolerance. It also covers how to read a Product Disclosure Statement efficiently, how to spot red flags before committing capital, and provides a consolidated due diligence checklist. By the end, readers will have a structured framework for making a more informed decision.
This article is for informational purposes only and should not be considered financial advice. Investors should conduct their own research and consult with financial professionals before making investment decisions.
Why the cost of a managed fund matters more than most investors realise
Fees compound against investors in the same way returns compound for them. The difference is that fee compounding is guaranteed. Market returns are not.
The primary fee figure to compare across funds is the Management Expense Ratio (MER), which represents the annual cost of managing the fund expressed as a percentage of assets. It covers the fund manager’s fees, administrative costs, and other operational expenses deducted from the fund’s returns before they reach the investor.
The ranges vary significantly by fund type in Australia:
| Fund Type | Typical MER Range | Cost Driver |
|---|---|---|
| Passive / index funds | 0.03% – 0.50% | Minimal research and trading activity |
| Active equity funds | 0.50% – 1.50% | Research teams, active trading, specialist strategies |
| Multi-asset / diversified funds | 0.80% – 1.20% | Allocation across multiple asset classes |
Specific MER figures vary by fund and require individual PDS review. These ranges represent general benchmarks for 2025.
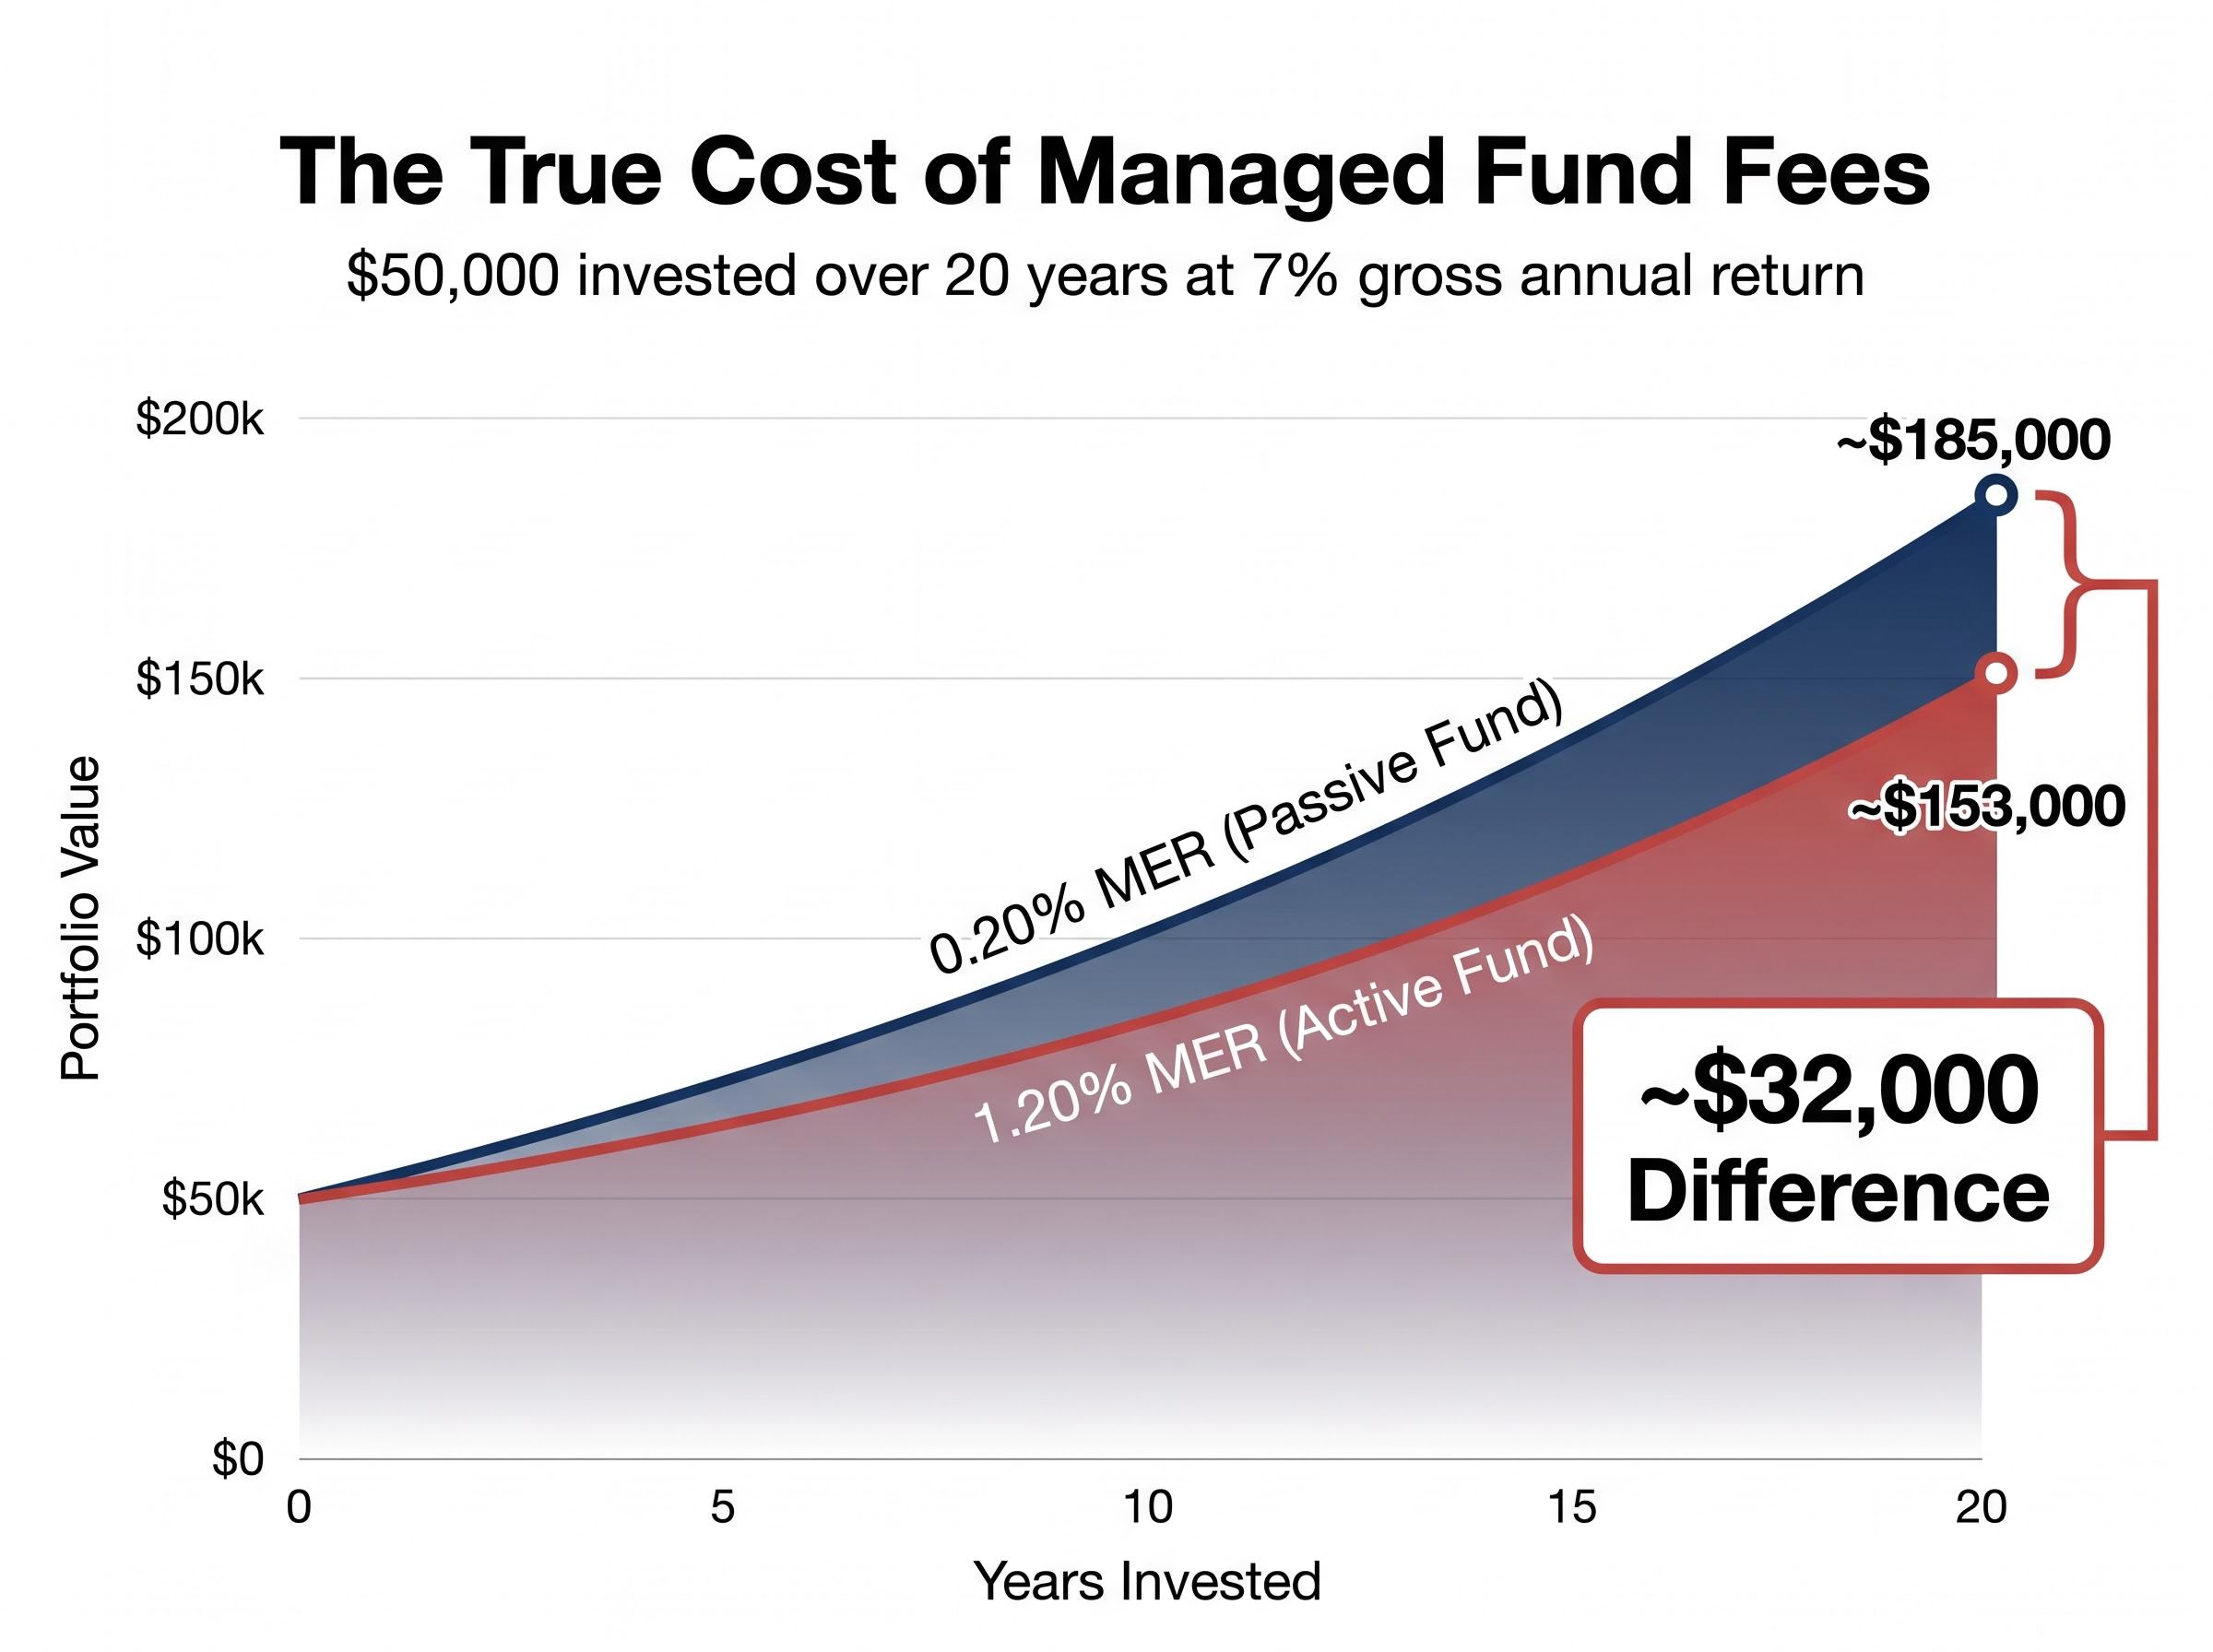
The gap between a low-cost and high-cost fund looks small in percentage terms. In dollar terms over time, it is not.
Consider a $50,000 investment held for 20 years at an identical gross return of 7% per annum. At a 0.20% MER (a low-cost passive fund), the net portfolio value after fees reaches approximately $185,000. At a 1.20% MER (a higher-cost active fund), the same investment reaches approximately $153,000. That is a difference of roughly $32,000, driven entirely by the fee gap, not by any difference in investment performance.
MERs are not the only cost. Buy/sell spreads (the difference between the price at which a fund buys and sells its units) and performance fees can add to the total cost of ownership. Under ASIC’s Regulatory Guide RG 168, all fees must be clearly disclosed in the Product Disclosure Statement. Investors should review the full fee schedule before committing.
Active versus passive fee trade-offs become concrete when comparing specific products: VanEck’s newly launched diversified ETFs charge 0.39% per annum against BetaShares DHHF at 0.19% and Vanguard’s passive range at 0.27%, a spread that must be recovered through consistent outperformance before the higher-cost active option produces a better net outcome for investors.
When big ASX news breaks, our subscribers know first
What a managed fund’s Product Disclosure Statement actually tells you
The PDS is a legally required document, and most investors treat it as one: something to acknowledge rather than read. That instinct is understandable. PDSs are dense, and the disclosure language can feel formulaic. But the PDS is also the single most information-rich document available before investing, and knowing which sections to prioritise turns it from a compliance exercise into a practical comparison tool.
ASIC’s Regulatory Guide RG 168 (updated December 2025) governs what a PDS must contain. The requirements are designed to ensure investors receive clear, concise, and effective disclosure before making a decision.
ASIC’s Regulatory Guide RG 168 sets the legal framework governing what a PDS must contain, requiring that all fees, risks, investment strategies, and redemption terms be disclosed in a clear, concise, and effective manner before an investor commits capital.
The four PDS sections that do the most work for investors
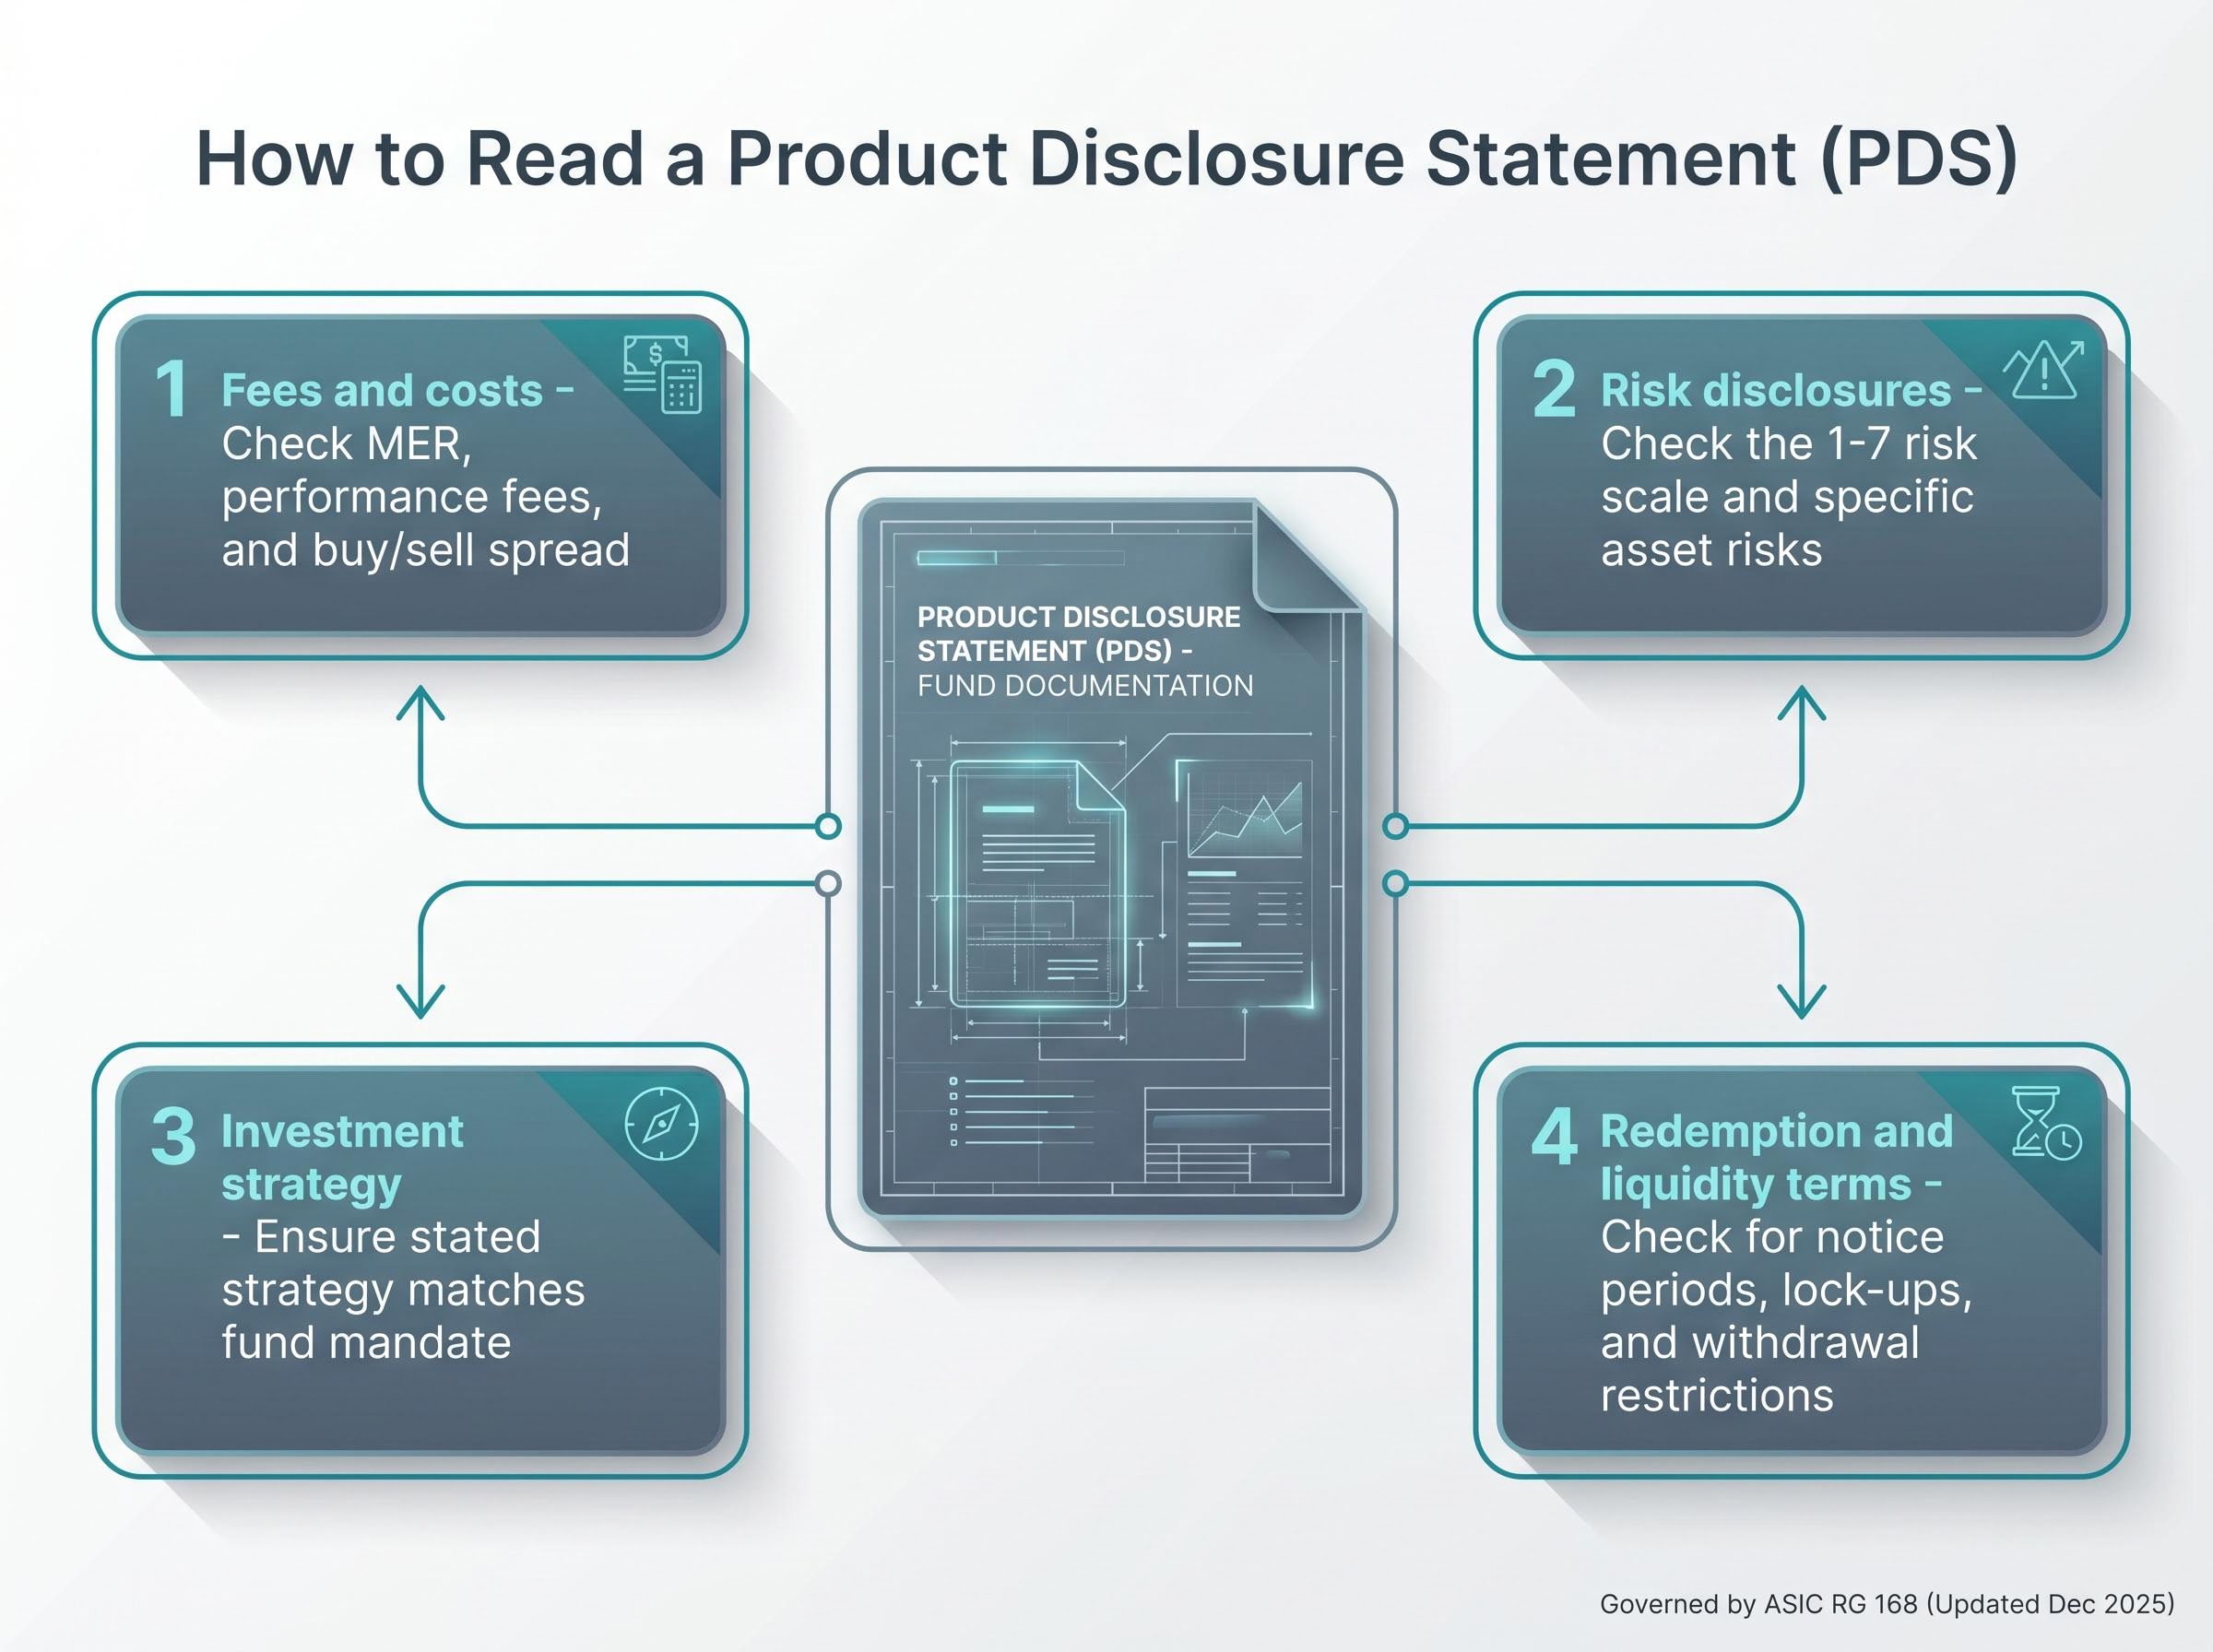
Not every page of a PDS carries equal decision weight. The following four sections, reviewed in this order, extract the most relevant information most efficiently:
- Fees and costs: Look for the MER, any performance fees, and the buy/sell spread. This section allows direct cost comparison across funds and feeds into the compounding analysis covered above.
- Risk disclosures: Check the fund’s own risk classification (typically a scale of 1-7, from very low to very high). This section should describe both general market risks and risks specific to the fund’s strategy or underlying assets.
- Investment strategy: Confirm that the stated strategy matches what the fund claims to do. If a fund markets itself as a conservative income fund, its strategy section should reflect that mandate, not reveal significant exposure to higher-risk growth assets.
- Redemption and liquidity terms: Note any notice periods or restrictions on withdrawals. Unlisted managed funds may require days or weeks to process redemptions, and some impose lock-up periods. This is particularly relevant for investors who may need access to their capital on shorter notice.
PDSs must be updated annually under ASIC’s RG 168 requirements. Investors should confirm they are reading the current version, not an outdated document from a previous year.
For investors unfamiliar with interpreting these documents, ASIC MoneySmart (moneysmart.gov.au) provides introductory guidance on reading a PDS and understanding managed fund disclosure.
How to assess a fund manager before you commit capital
A fund’s past performance figures are the first thing most investors look at and the last thing that should determine their decision. Performance data is backwards-looking. What investors are actually buying is the manager’s future execution of a stated strategy, and that requires evaluating the people and processes behind the numbers.
The assessment starts with the most basic verifiable credential. Before reviewing any performance data, check the fund manager’s Australian Financial Services (AFS) licence status on ASIC Connect (registers.asic.gov.au). An AFS licence is required to operate a managed fund in Australia. Any licence cancellation, suspension, or conditions imposed by ASIC is a disqualifying signal. ASIC cancelled the AFS licence of Financial Services Group Australia in June 2025 and MWL Financial Services in 2025, both following serious governance and compliance failures.
Once licence status is confirmed, the evaluation moves to less visible but more revealing indicators:
- AFS licence verification: Confirmed active on ASIC Connect, with no conditions or enforcement history
- Investment philosophy review: A clearly articulated strategy that has been applied consistently, not one that shifts with market trends
- Benchmark-relative performance: Multi-year returns measured against the fund’s stated benchmark across different market conditions, not headline absolute return figures
- Staff stability: Frequent departure of key investment personnel is a warning sign of internal instability or strategic disagreement
- Independent ratings: Morningstar (morningstar.com.au/funds) provides independent analyst ratings and star ratings for larger Australian funds
The SPIVA Australia Scorecard, published annually by S&P Global, provides independent data on how many active managers in each fund category actually outperform their benchmark after fees. It is a useful reference for testing any active manager’s claim of consistent outperformance against the broader evidence.
Performance history still matters, but it matters most when viewed through the lens of consistency. A manager who delivered strong returns in a rising market but significantly underperformed during downturns may be taking on more risk than the stated strategy suggests. Multi-cycle, benchmark-relative data is more informative than a single strong year.
Active manager accountability is structurally limited when fund communications describe tactical decisions in language that provides no testable prediction: AustralianSuper’s own outgoing CIO acknowledged in March 2026 that the fund’s underweight to AI and digital stocks from approximately 2022 cost members significant gains, illustrating the gap that can exist between a fund’s stated mandate and its actual execution.
Matching a managed fund to your financial goals and risk tolerance
A well-managed fund with strong credentials can still produce a poor outcome for a specific investor if it does not align with their goals, time horizon, or liquidity needs. The alignment step is where general due diligence becomes a personally relevant decision.
The process works in two steps. First, define the investment objective: growth (capital appreciation over time), income (regular distributions), capital preservation (protecting the original investment), or a blend of these. Pair this with the investment horizon, which is the period before the capital is likely needed.
Asset class risk profiles sit in a clear hierarchy in Australia, with cash, bonds, property, and shares arranged in ascending order of both potential return and outcome volatility; the appropriate position on that spectrum is determined by time horizon and financial objectives, not by whichever asset class is posting the strongest recent numbers.
Second, match those parameters against the fund’s stated objective and recommended minimum holding period, both disclosed in the PDS. A fund designed for long-term capital growth with a recommended holding period of seven years is poorly suited to an investor who may need access to the capital within two years.
The distinction between growth and defensive assets helps frame this alignment:
| Fund Type | Asset Focus | Typical Risk Level | Suitable Horizon | Liquidity |
|---|---|---|---|---|
| Australian equity fund | Growth (shares) | Medium to high | 5+ years | Varies (listed ETFs: intraday; unlisted: days to weeks) |
| International equity fund | Growth (global shares) | Medium to high | 5+ years | Varies by structure |
| Fixed income fund | Defensive (bonds) | Low to medium | 2-5 years | Generally higher |
| Multi-asset / diversified fund | Blend (growth + defensive) | Medium | 3-7 years | Varies by structure |
Liquidity alignment deserves specific attention. Unlisted managed funds may have redemption notice periods or end-of-day pricing only, while listed ETFs offer intraday liquidity on the ASX. Investors with shorter horizons or uncertain cash flow needs should factor this into their selection.
Minimum investment amounts for unlisted managed funds are often $5,000 or more, which may also influence the decision for investors starting with smaller allocations.
For context, FY2024-2025 performance data showed international equities (large cap) delivering a median return of 16.6%, while Australian equities (mid/small cap) returned 13.2%. These figures illustrate how different asset classes can perform in varying conditions, but past performance does not guarantee future results. Diversified or multi-asset funds, which blend growth and defensive assets, are a common starting point for investors who want a single fund to handle allocation across multiple asset classes.
Investors wanting to understand how portfolio construction decisions are shifting across the market will find our deep-dive into Australian investor trends and home bias, which examines why international ETFs overtook domestic funds as the most purchased category on Selfwealth by Syfe in Q1 2026 and what that structural break means for diversification decisions.
Red flags that should stop you from investing in a managed fund
The warning signs covered in this section are not hypothetical. In 2024-2025, two Australian managed fund collapses demonstrated precisely what happens when governance and due diligence break down.
The First Guardian Master Fund was suspended in May 2024, with assets frozen in February 2025. Approximately 6,000 investors were affected, including superannuation members invested through platforms such as Netwealth and Diversa. ASIC brought civil penalty proceedings against Netwealth Superannuation Services and Netwealth Investments in December 2025 for failing to assess investment risks, and against Diversa Trustees for inadequate due diligence and monitoring, including failure to enforce a 50% holding limit.
The Shield Master Fund had its assets frozen in June 2024, affecting approximately 5,800 investors who had invested $480 million since February 2022. ASIC brought civil penalty proceedings against Equity Trustees in August 2025 for due diligence failures. Combined losses across both funds totalled approximately $1.1 billion.
The patterns ASIC’s enforcement actions identified are specific and recognisable:
- Unrealistically high return promises not consistent with asset class benchmarks
- Opaque or complex fee structures not clearly disclosed in the PDS
- Inadequate due diligence by trustees before onboarding fund investments
- Failure to monitor investments against stated fund mandates
- Undisclosed conflicts of interest between responsible entities and underlying investments
- Frequent departure of key investment staff
- Illiquid underlying assets not appropriately flagged in disclosure documents
How to verify a fund manager’s regulatory standing in Australia
Three steps can materially reduce exposure to governance risk before any capital is committed:
- Check AFS licence status on ASIC Connect (registers.asic.gov.au). Confirm the licence is current, with no conditions, suspensions, or cancellations recorded.
- Search the fund manager’s name in ASIC’s enforcement actions register (asic.gov.au/enforcement). Review any proceedings, outcomes, or infringement notices associated with the entity or its key personnel.
- Confirm the PDS is current and lodged with ASIC. An outdated or missing PDS is a red flag in itself.
For investors who have already been affected by a fund failure, the Australian Financial Complaints Authority (AFCA, afca.org.au) is available to lodge complaints and seek resolution. As of February 2026, fewer than 2,000 of approximately 11,000 investors affected by the First Guardian and Shield Master Fund collapses had lodged AFCA complaints.
A practical due diligence checklist before you invest
The evaluation layers covered in this guide, fees, PDS interpretation, manager assessment, goal alignment, and red flag screening, are most effective when applied in sequence. The following checklist consolidates them into a single actionable process:
- Define your investment objective and time horizon. Clarify whether the goal is growth, income, capital preservation, or a blend, and identify when the capital is likely to be needed.
- Review the fund’s fee structure. Compare the MER against category benchmarks. Account for buy/sell spreads and any performance fees disclosed in the PDS.
- Read the PDS strategically. Prioritise the four sections that carry the most decision weight: fees, risk disclosures, investment strategy, and redemption terms. Confirm the PDS is the current version.
- Verify the fund manager’s AFS licence. Use ASIC Connect (registers.asic.gov.au) to confirm active licence status with no conditions or enforcement history.
- Screen for red flags. Search the fund manager’s name in ASIC’s enforcement actions register. Look for unrealistic return claims, opaque fee structures, or evidence of mandate drift.
- Check independent ratings and benchmark data. Review Morningstar ratings (morningstar.com.au/funds) and the SPIVA Australia Scorecard for independent performance context.
- Assess alignment. Confirm the fund’s stated objective, risk level, recommended holding period, and liquidity terms match the personal parameters defined in step one.
For investors who are uncertain about suitability alignment, ASIC MoneySmart (moneysmart.gov.au) offers risk assessment tools and introductory resources that serve as a useful starting point before seeking licensed financial advice. InvestSMART (investsmart.com.au/managed-funds) provides fund comparison and screening tools for side-by-side evaluation.
No single data point makes or breaks a fund selection decision. The checklist works because it triangulates across multiple layers of evidence, reducing the risk that strong performance numbers obscure a fee problem, a governance issue, or a fundamental mismatch with the investor’s own goals.
The investment decisions you can control start here
In managed fund investing, the variables investors cannot control are numerous: market returns, manager decisions on individual positions, interest rate movements, and macroeconomic conditions. What investors can control is more limited but more reliable. Fees, suitability alignment, and pre-investment verification are entirely within the investor’s power to get right.
The three evaluation layers covered in this guide, understanding fee structures and their compounding impact, assessing a fund manager’s credentials and consistency, and matching a fund’s profile to personal financial goals, form a framework that applies to every fund an investor considers, regardless of asset class or market conditions.
The practical next step is straightforward. Use the due diligence checklist from the previous section, review the PDS of any fund under consideration, and for additional guidance on suitability, consider engaging a licensed financial adviser through ASIC MoneySmart’s financial adviser finder (moneysmart.gov.au). The framework is structured. The decision is the investor’s.
Past performance does not guarantee future results. Financial projections are subject to market conditions and various risk factors.