Jefferies issued a pointed warning in recent weeks: the chip stock rally will not be smooth, and the trading decisions investors make during volatile stretches can damage returns weeks or months afterward. For anyone currently holding Samsung Electronics or SK Hynix, that warning lands with force. The rally in memory and AI chip stocks has already delivered exceptional gains for those who stayed the course, and Barclays’ price target revisions on 2 June 2026, underpinned by a constructive average selling price (ASP) outlook through 2027, confirm the thesis is not finished. The forward challenge is behavioural, not analytical. The volatility is coming, the gains are real, and the question is how to stay in the game without letting reactive decisions erode what patience has built.
This guide explains what late-stage rally volatility actually looks like in practice, why active trading tends to destroy the returns it claims to protect, and what specific rules-based tools retail investors can use to hold positions through turbulence without constant reactive decision-making.
Why the final stretch of a chip rally is the most dangerous for your returns
The phase that looks like the most exciting opportunity to trade is precisely the phase where trading is most likely to hurt. Jefferies has been explicit: price turbulence intensifies during the advanced stages of comparable market runs, with elevated volatility already observed during March 2026 and further episodes anticipated. The problem is not the volatility itself. It is the reactive decisions volatility triggers. Jefferies noted that choices made during volatile stretches negatively influence returns experienced weeks or months afterward.
The link between cognitive bias and permanent loss is most visible at market extremes, where the same volatility that creates recovery opportunities also triggers the panic selling that converts temporary drawdowns into locked-in losses that compounding cannot repair.
This is not a quirk specific to Samsung or SK Hynix. It is a structural feature of late-stage momentum rallies, and the major asset managers have converged on the same conclusion:
- BlackRock materials emphasise that frequent trading around volatility spikes in momentum-driven AI-related tech tends to produce lower realised returns than simple buy-and-hold exposure via diversified vehicles.
- Vanguard highlights that the strongest days in momentum rallies often follow the worst days; missing a small number of best days can materially reduce long-term returns in technology and growth sectors.
- J.P. Morgan Asset Management notes that retail flows into AI and semiconductor names surge after strong performance, then reverse after drawdowns, creating performance gaps versus buy-and-hold investors.
- Morningstar equity analysts showed that investors who traded actively around big swings lagged a simple hold strategy in the same stocks or ETFs over multi-year periods.
- Bank of America Global Research cautions that heavy active trading in late-cycle AI semis is more likely to add volatility than alpha for non-professional investors.
Vanguard’s research shows that missing a small number of the best trading days can materially reduce long-term returns in technology and growth sectors. In momentum rallies, those best days typically follow the worst ones, meaning investors who sell during drawdowns are statistically likely to miss the recovery sessions that drive compounding.
The numbers make the pattern concrete. Samsung recorded single-day moves exceeding 4-5% during March 2026 sessions. SK Hynix swung in a 30% peak-to-trough band in under two months in early 2026. These are not anomalies. They are the environment Jefferies warned about, and the environment where reactive trading does the most damage.
When big ASX news breaks, our subscribers know first
What passive and rules-based strategies actually mean in practice
A rules-based approach does not mean ignoring the portfolio. It means pre-committed decision-making that removes discretion from high-emotion moments. For a retail investor holding volatile single stocks like Samsung or SK Hynix, this translates to specific thresholds and limits set before the next volatile session, not calibrated in real time during a drawdown.
The distinction matters because it addresses the two dominant failure modes that destroy returns in chip stocks.
The two behavioural traps that destroy chip stock returns
- Panic selling: Exiting after a 15-30% pullback when underlying fundamentals have not changed. The impulse feels like risk management; the outcome is locking in losses at the worst possible moment and missing the recovery that institutional research consistently shows follows.
- FOMO-driven overconcentration: Adding heavily near the top after strong performance streaks, increasing exposure precisely when gap-down risk is highest.
Both traps share a common trigger: discretionary decision-making during high-volatility periods. Rules eliminate the discretion.
Morningstar research confirmed this directly. Investors who traded actively around big up-and-down swings in AI-linked chip and software names lagged a simple hold strategy over multi-year periods. The underperformance was attributed to systematic buy-high, sell-low behaviour during volatility spikes. BlackRock reached the same conclusion: consistent allocations outperformed reactive trading around short-term moves. Bank of America framed it bluntly: heavy active trading in late-cycle AI semiconductors is more likely to add volatility to a portfolio than alpha for non-professional investors.
Retail investors often assume that doing something during a drawdown is better than doing nothing. The evidence says otherwise.
The specific behavioural biases that make chip stocks uniquely risky
Knowing that reactive trading hurts returns is different from recognising the impulse in real time. The biases that drive poor decisions in semiconductor rallies have specific names, and naming them gives investors a diagnostic framework for the moment they feel the urge to act.
- Recency bias and earnings extrapolation: CFA Institute analysis identifies this as a dominant behaviour in the 2023-2024 semiconductor and AI rallies. Investors assume current AI-driven demand and HBM pricing trends will continue indefinitely, extrapolating earnings growth far into the future, then react with disproportionate shock when a single quarter deviates. In chip stocks, this manifests as outsized buying after strong earnings and outsized selling after any miss.
- Herding and FOMO: Retail investors follow flows into crowded chip names at the tail end of rallies, then react with panic selling when volatility surges. J.P. Morgan has documented that retail flows into AI and semiconductor names surge after strong performance and reverse after drawdowns.
- Disposition effect: Morningstar flags the tendency to sell recent winners too early after small pullbacks while holding losers. In a rally like the current one, this means trimming SK Hynix after a modest dip while holding underperforming names, the opposite of what the fundamental thesis supports.
- Attention-driven trading on HBM headlines: Retail investors overreact to High Bandwidth Memory supply, pricing, and qualification announcements, producing intraday volatility spikes beyond what fundamentals alone would justify. HBM-related announcements have been associated with 10%+ multi-day swings, with retail trading volumes spiking in tandem.
Bloomberg commentary describes a “gold rush mentality” among Korean and global retail investors piling into perceived HBM leaders like SK Hynix, a dynamic that amplifies both the upside runs and the subsequent drawdowns.
The Korean market dimension intensifies these patterns. Retail investors on Korea’s KRX exhibit what Korean financial press describes as “panic dumping after rapid ascents,” combined with heavy margin use that exacerbates intraday volatility in Samsung and SK Hynix specifically. IOSCO (the International Organization of Securities Commissions) highlights that in turbulent markets, retail investors show heightened trading frequency, short-term loss aversion, and susceptibility to social-media-driven narratives.
When the next HBM headline arrives, the investor who can identify the bias driving the impulse to trade is better positioned to apply a pre-committed rule instead of acting on it.
For investors who want to quantify the specific cost of acting on these impulses, our dedicated guide to loss aversion and portfolio returns walks through Morningstar’s ‘Mind the Gap’ research, the implementation intentions framework for building pre-written if-then trading rules, and the case for reducing portfolio check frequency to quarterly intervals.
A practical rebalancing and position-sizing framework for volatile chip holdings
Understanding the problem is necessary. Having specific rules to follow is what makes the understanding actionable. Three tools, each with concrete thresholds drawn from institutional sources, form the core of a rules-based framework for holding through turbulence.
Rebalancing thresholds
Vanguard recommends band rebalancing: trim or add when an asset drifts more than 5 percentage points from its target weight. Applied to chip stocks, this means trimming Samsung or SK Hynix when they grow significantly beyond their planned portfolio share, and adding when a drawdown pushes them below target.
Morningstar suggests annual rebalancing plus intra-year adjustments when positions deviate by 20-25% from their target weight. For high-momentum semiconductors, the recommendation is small, mechanical trims after outsized gains rather than wholesale exits.
Both approaches share the same principle: the trigger is mathematical, not emotional.
Position sizing and concentration limits
CFA Institute research proposes a maximum of 5% per single stock and 10-15% per high-volatility theme (such as AI semiconductors) for typical retail investors. Late-stage momentum phases heighten gap-down risk, making concentration control more valuable than chasing the rally.
Schwab Center for Financial Research advises keeping single-stock exposure generally under 10% of total portfolio, with systematic trimming above that level.
J.P. Morgan Asset Management adds a theme-level dimension: define maximum drawdown tolerance (for example, 20-25%) at the theme level and size positions so that even a worst-case sector drawdown stays within overall portfolio risk limits.
Barclays’ constructive ASP outlook through end of 2027 supports a longer-horizon thesis for both Samsung and SK Hynix, which means these rules are designed to keep investors in the trade, not to exit it prematurely.
| Tool | Threshold or Limit | Source | What triggers the action |
|---|---|---|---|
| Band rebalancing | 5 percentage point drift from target weight | Vanguard | Position grows or shrinks beyond planned share; trim or add mechanically |
| Single-stock cap | 5-10% of total portfolio | CFA Institute, Schwab | Any single chip stock exceeding cap; systematic trim above threshold |
| Theme-level concentration | 10-15% of total portfolio | CFA Institute | Combined AI/semiconductor exposure exceeding limit; rebalance across theme |
| Maximum drawdown tolerance | 20-25% at theme level | J.P. Morgan Asset Management | Size positions so worst-case sector drawdown stays within portfolio risk limits |
These rules must be set before the next volatile session. Calibrating them during a drawdown defeats their purpose.
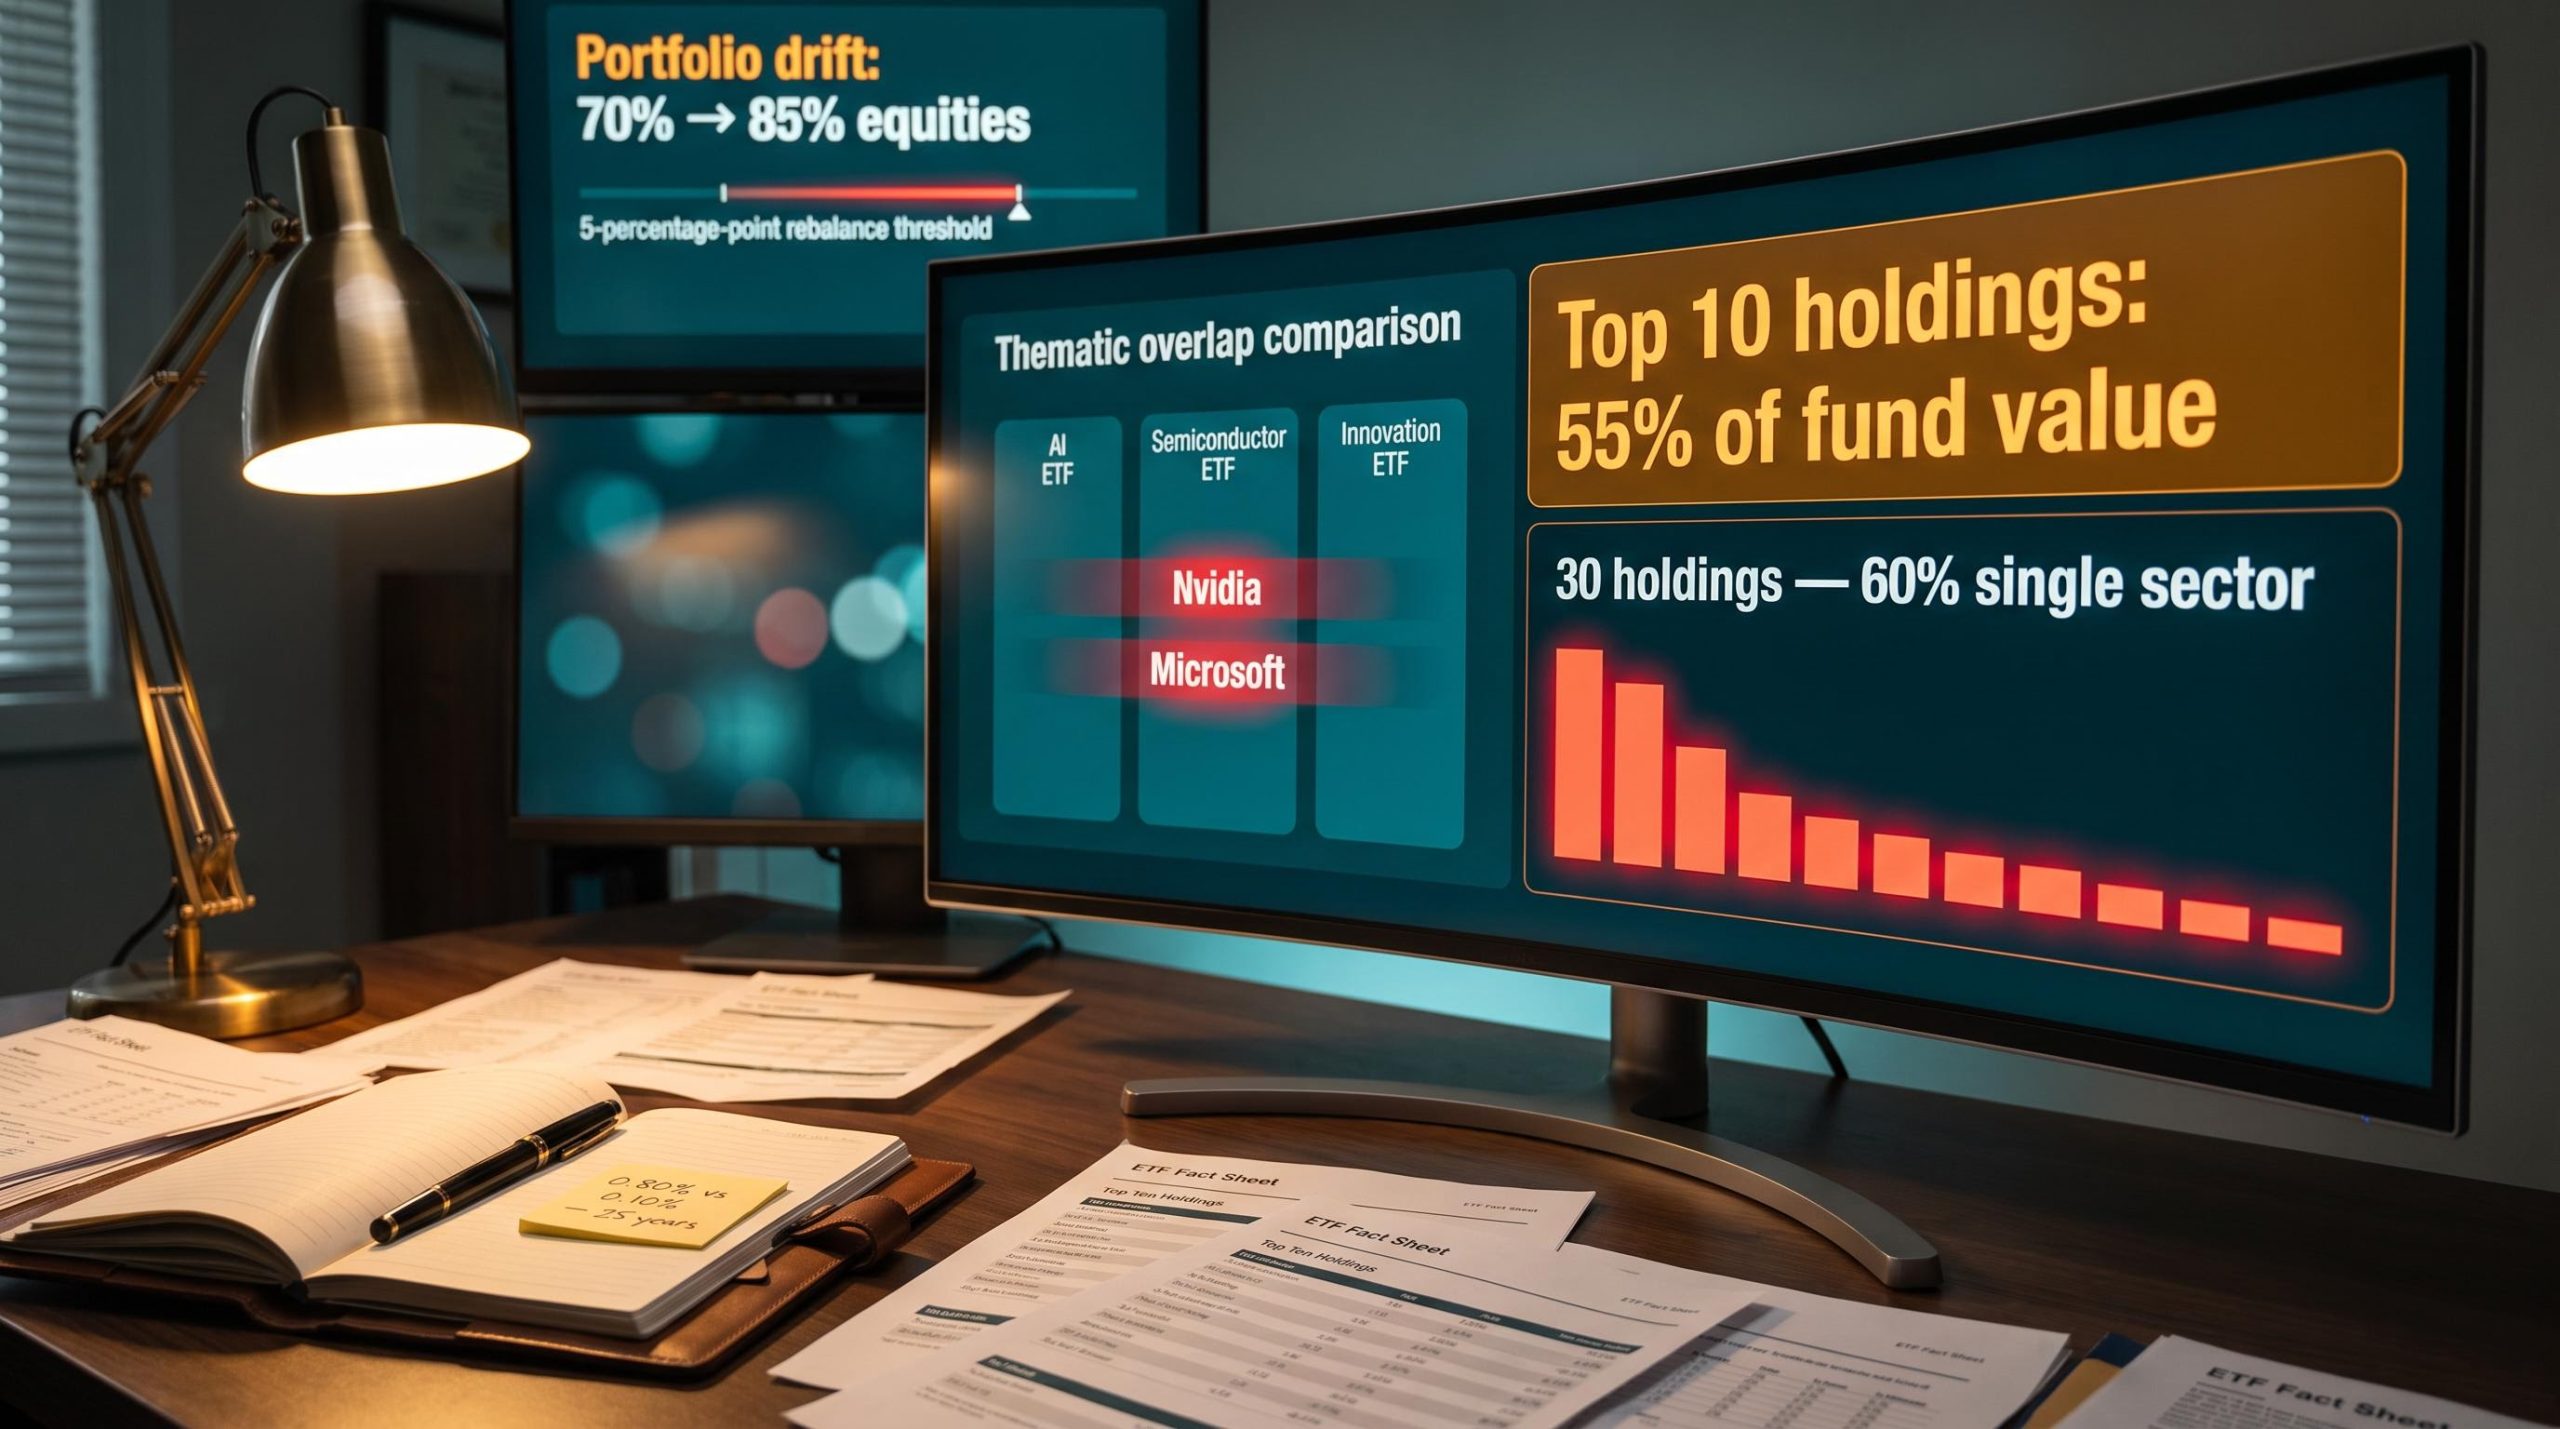
Investors wanting to apply these thresholds across a broader multi-asset portfolio will find our comprehensive walkthrough of portfolio rebalancing execution, which covers tax-efficient sequencing (new contributions first, dividend redirection second, taxable account sales only as a last resort), how to identify drift in a 60/40 portfolio after a prolonged equity rally, and when a 5-percentage-point overshoot triggers a rebalance.
How to stay invested without watching every tick: behavioural safeguards that work
Rules are only as effective as the investor’s ability to follow them when the pressure is highest. Three practical safeguards address the implementation challenge directly.
The “sleep-at-night” rule: Set exposure to highly volatile holdings at a level where large swings do not cause constant monitoring or insomnia, directly reducing the temptation to overtrade. If a 5% daily move in SK Hynix keeps an investor checking their portfolio every hour, the position is too large for their temperament, regardless of what the concentration limits allow.
FINRA recommends that investors in volatile names deploy a pre-trade checklist before any reactive trade. The three questions function as a decision-slowing mechanism:
FINRA’s market volatility research documents how elevated trading frequency during turbulent periods correlates with deteriorating risk-adjusted outcomes for retail participants, a pattern that maps directly onto the reactive selling and FOMO-driven buying cycles observed in semiconductor names during volatility shocks.
- What percentage of my portfolio will this trade represent?
- Am I using margin or options to execute it?
- What is my time horizon for this position?
If the answers do not align with the pre-committed rules, the trade should not happen.
FINRA also specifically recommends putting investment decisions in writing in advance to reduce emotion-driven trading. Korean financial press commentary echoes this approach: during sharp swings in Samsung and SK Hynix, long-term holders have been warned specifically against headline-driven trading in favour of pre-set allocation rules.
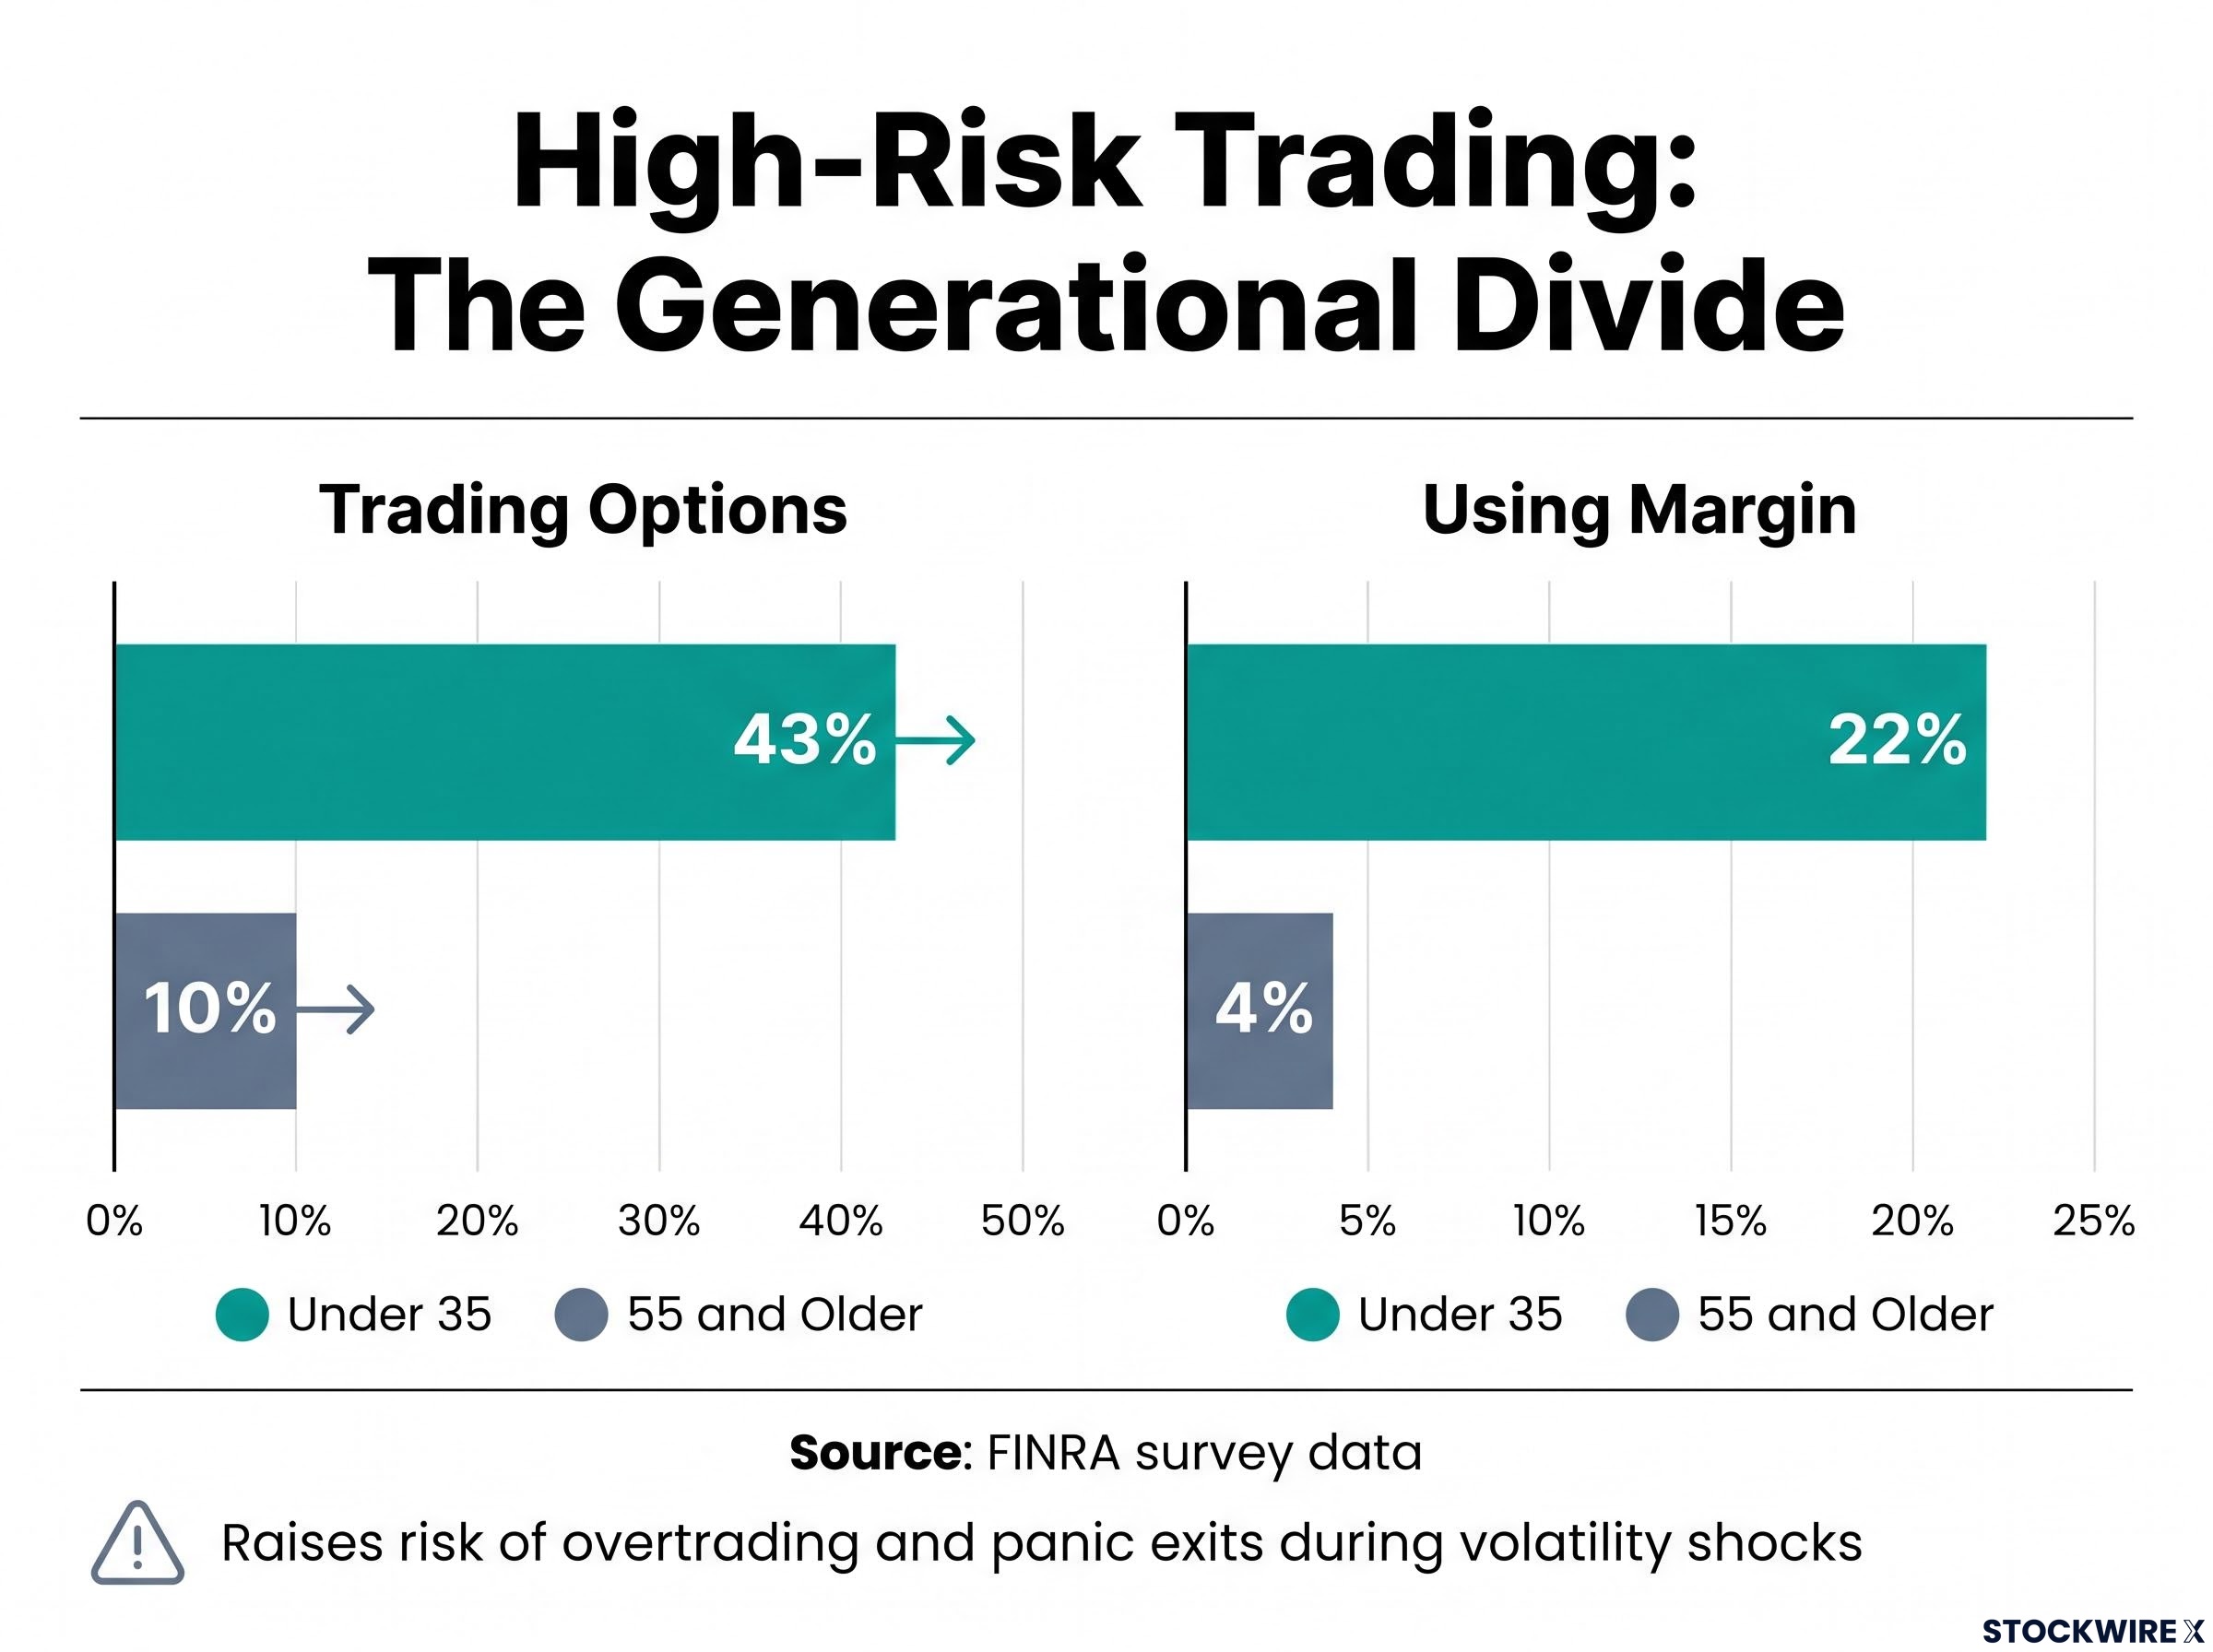
Younger investors face heightened risk. FINRA survey data indicates that 43% of investors under 35 traded options versus 10% of those 55 and older, and 22% of younger investors used margin versus 4% of older investors. Regulatory bodies warn these patterns raise the risk of overtrading and panic exits during volatility shocks. Writing down the rules before the next volatile session is the simplest safeguard against acting on impulse.
The Barclays case and what a longer horizon actually buys you
Behavioural discipline is easier to maintain when anchored in a specific thesis with a defined timeline. Barclays’ price target revisions for both Samsung and SK Hynix, announced on 2 June 2026, provide that anchor.
The fundamental case rests on three drivers:
- ASP firmness through end of 2027: Barclays expects memory ASPs to remain firm, underpinned by persistent supply-demand tightness in the HBM and conventional DRAM markets.
- HBM pricing uplift: A meaningful pricing uplift for HBM in the following year was flagged as an additional positive driver beyond current levels.
- Long-term agreement stabilisation: LTAs (long-term supply agreements between memory producers and AI chip customers) are receiving growing attention as a factor that could reduce near-term valuation volatility.
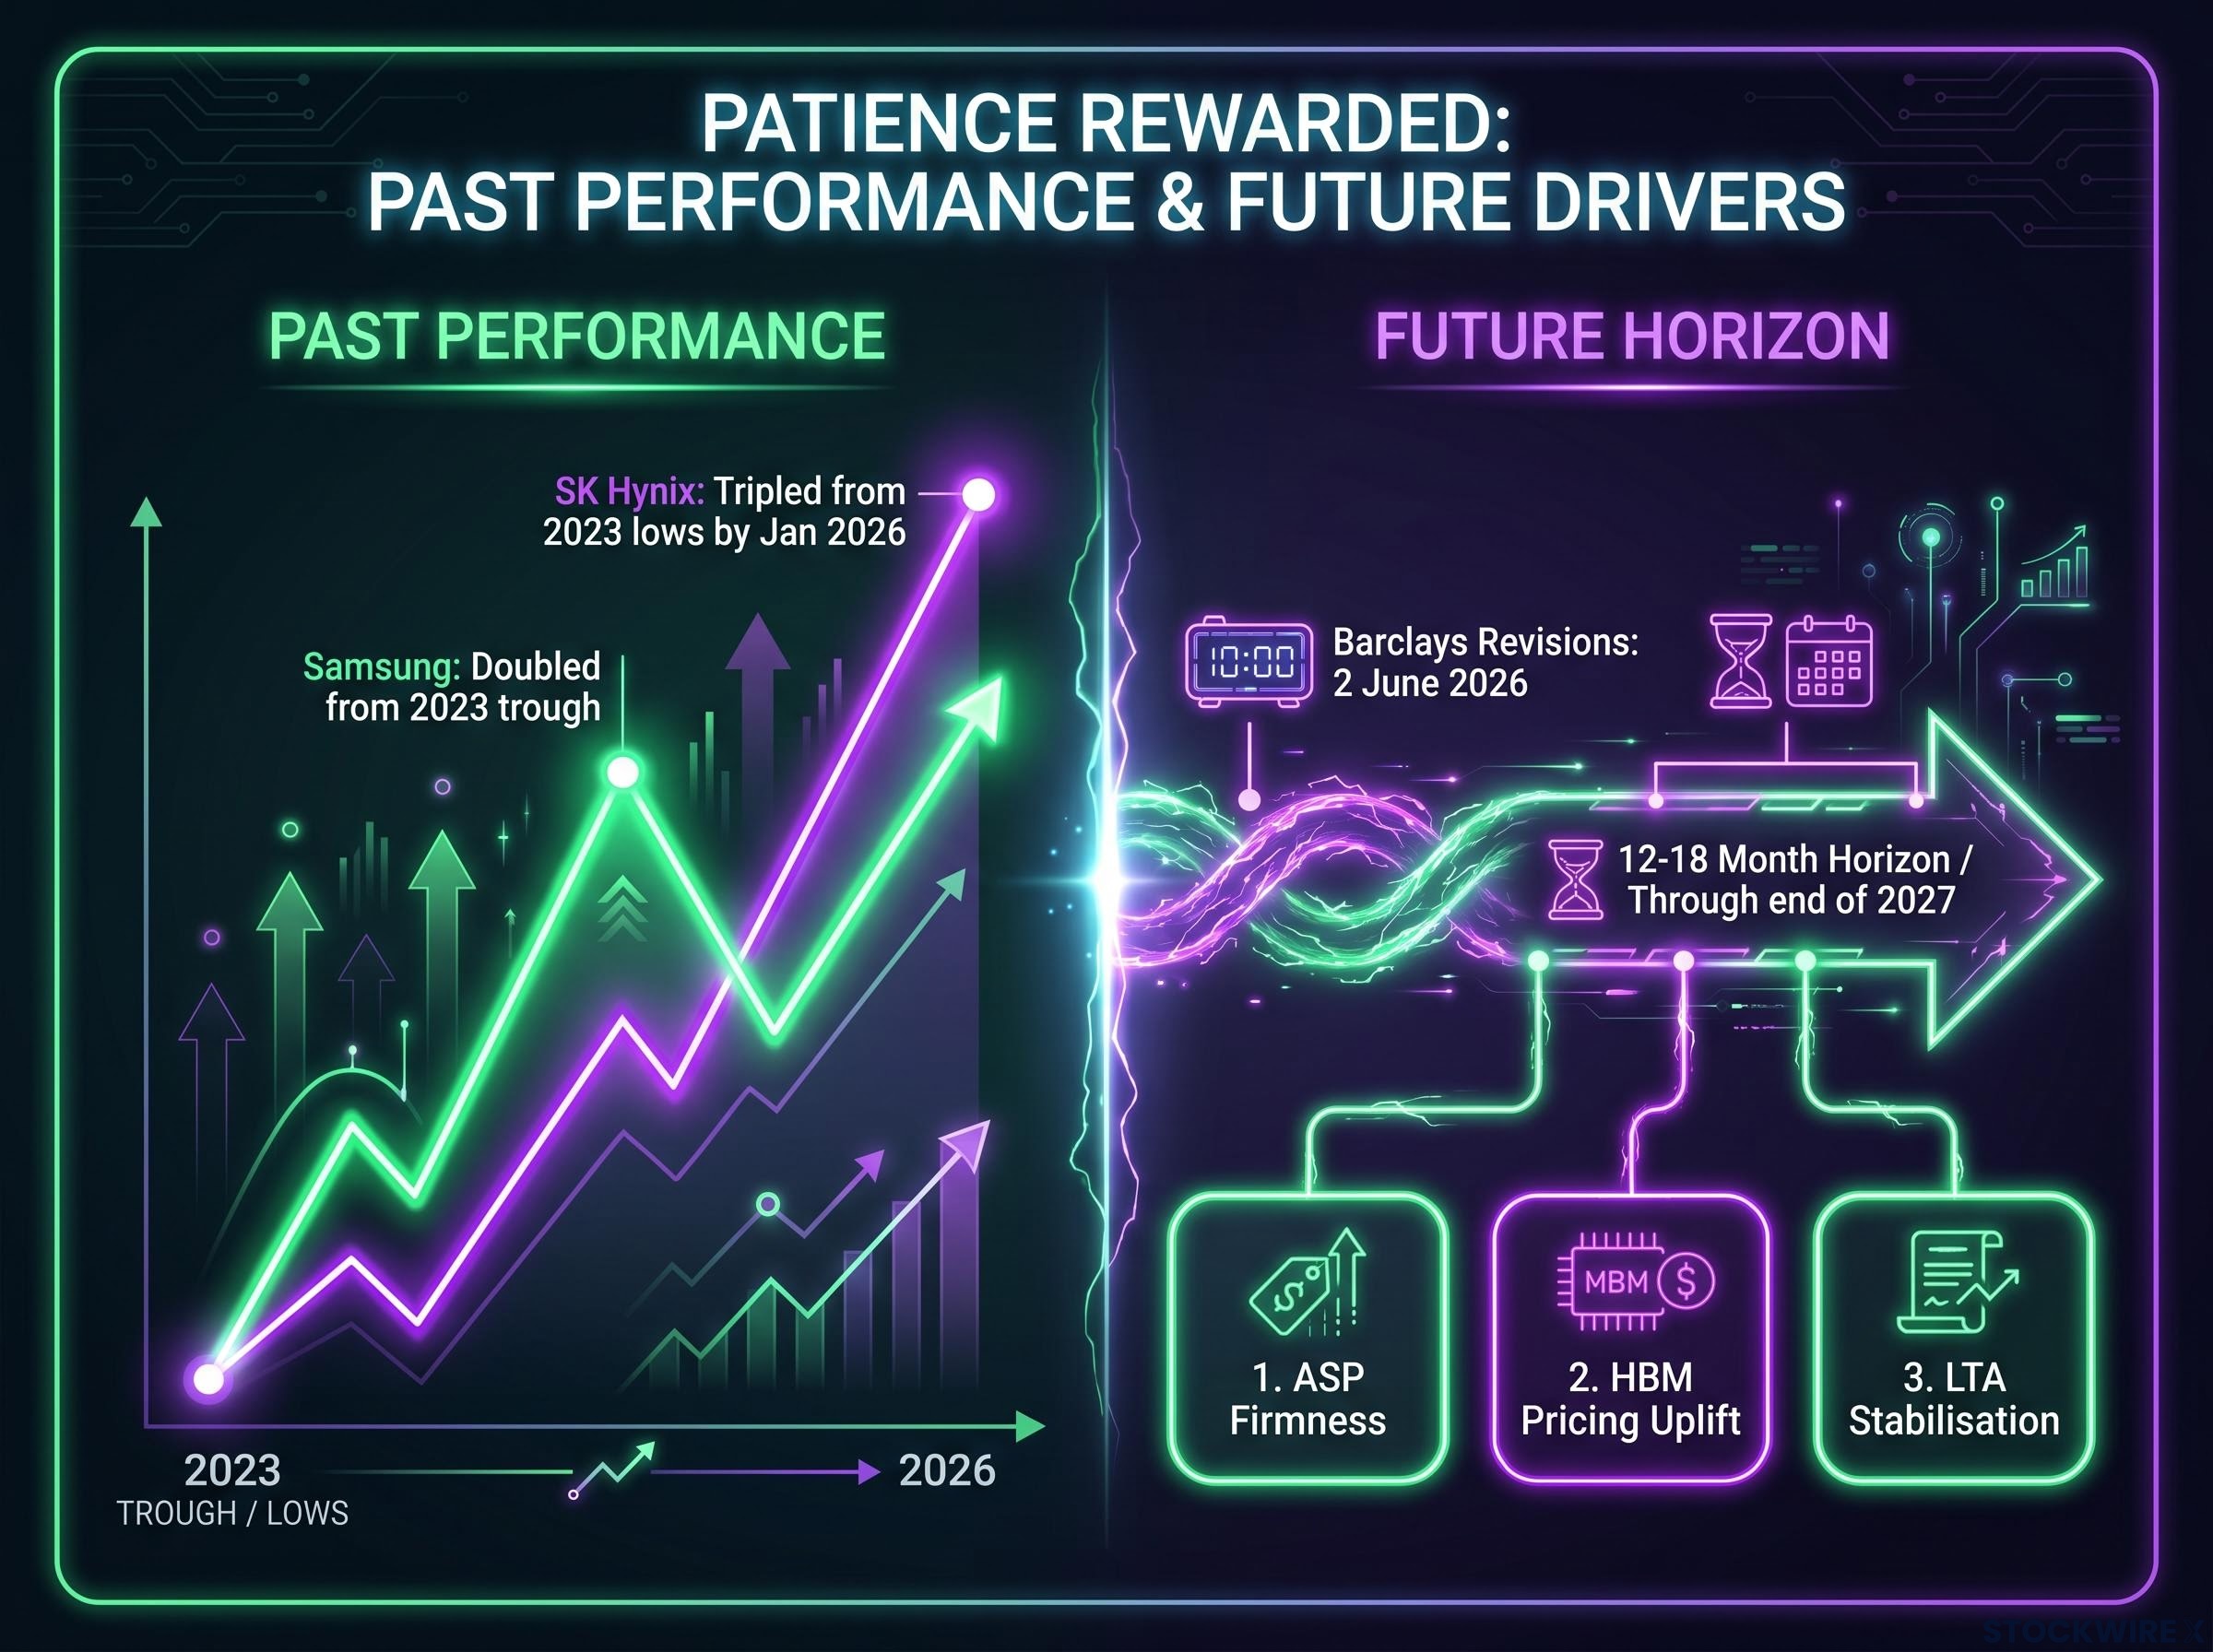
The performance history underscores what patience has already delivered. Samsung shares have roughly doubled from their 2023 trough, while SK Hynix tripled from 2023 lows by January 2026. Conventional DRAM ASP trends remain a key metric to monitor, according to Barclays.
What the analyst thesis means for your holding timeline
A 12-18 month fundamental thesis requires a matching behavioural commitment. The rules-based approach outlined in this guide is not a permanent philosophy but a strategy calibrated to the duration of the thesis itself. Barclays’ constructive outlook extends through end of 2027, which is precisely the time horizon over which institutional research consistently shows passive holding outperforming reactive trading.
The investors best positioned to capture that thesis are those whose rebalancing rules and concentration limits allow them to absorb the drawdowns Jefferies warned about without making the discretionary decisions that destroy returns.
Volatile rallies reward patience, not precision timing
Across Jefferies, Barclays, and the full institutional consensus from BlackRock, Vanguard, Morningstar, J.P. Morgan, and Bank of America, the evidence for late-stage chip rallies points in the same direction: rules-based passive holding outperforms active tactical trading for non-professional investors.
Late-cycle bull market dynamics in 2026 are characterised by a widening divergence between institutional positioning and retail behaviour: five major asset managers including BlackRock, Fidelity, and J.P. Morgan maintained overweight or constructive equity stances as of mid-May 2026, while retail flows continued the buy-high, sell-low pattern that the institutional consensus consistently identifies as the primary driver of performance shortfalls.
The practical toolkit is straightforward. Pre-committed rebalancing thresholds, single-stock and theme-level concentration caps, FINRA’s pre-trade checklist, and the “sleep-at-night” sizing rule together form a complete behavioural framework. None of these tools require professional advice or real-time market analysis to implement.
The volatility Jefferies warned about is already under way as of June 2026. The Barclays ASP and HBM thesis extends through 2027. The investors best positioned for what comes next are those who build their rules now rather than after the next sharp drawdown. Review current Samsung and SK Hynix (or broader semiconductor) exposure against the specific thresholds in this guide before the next volatile session. Write down the rebalancing rules and maximum drawdown tolerance in advance. The rules only work if they exist before the pressure arrives.
This article is for informational purposes only and should not be considered financial advice. Investors should conduct their own research and consult with financial professionals before making investment decisions. Past performance does not guarantee future results. Financial projections are subject to market conditions and various risk factors.