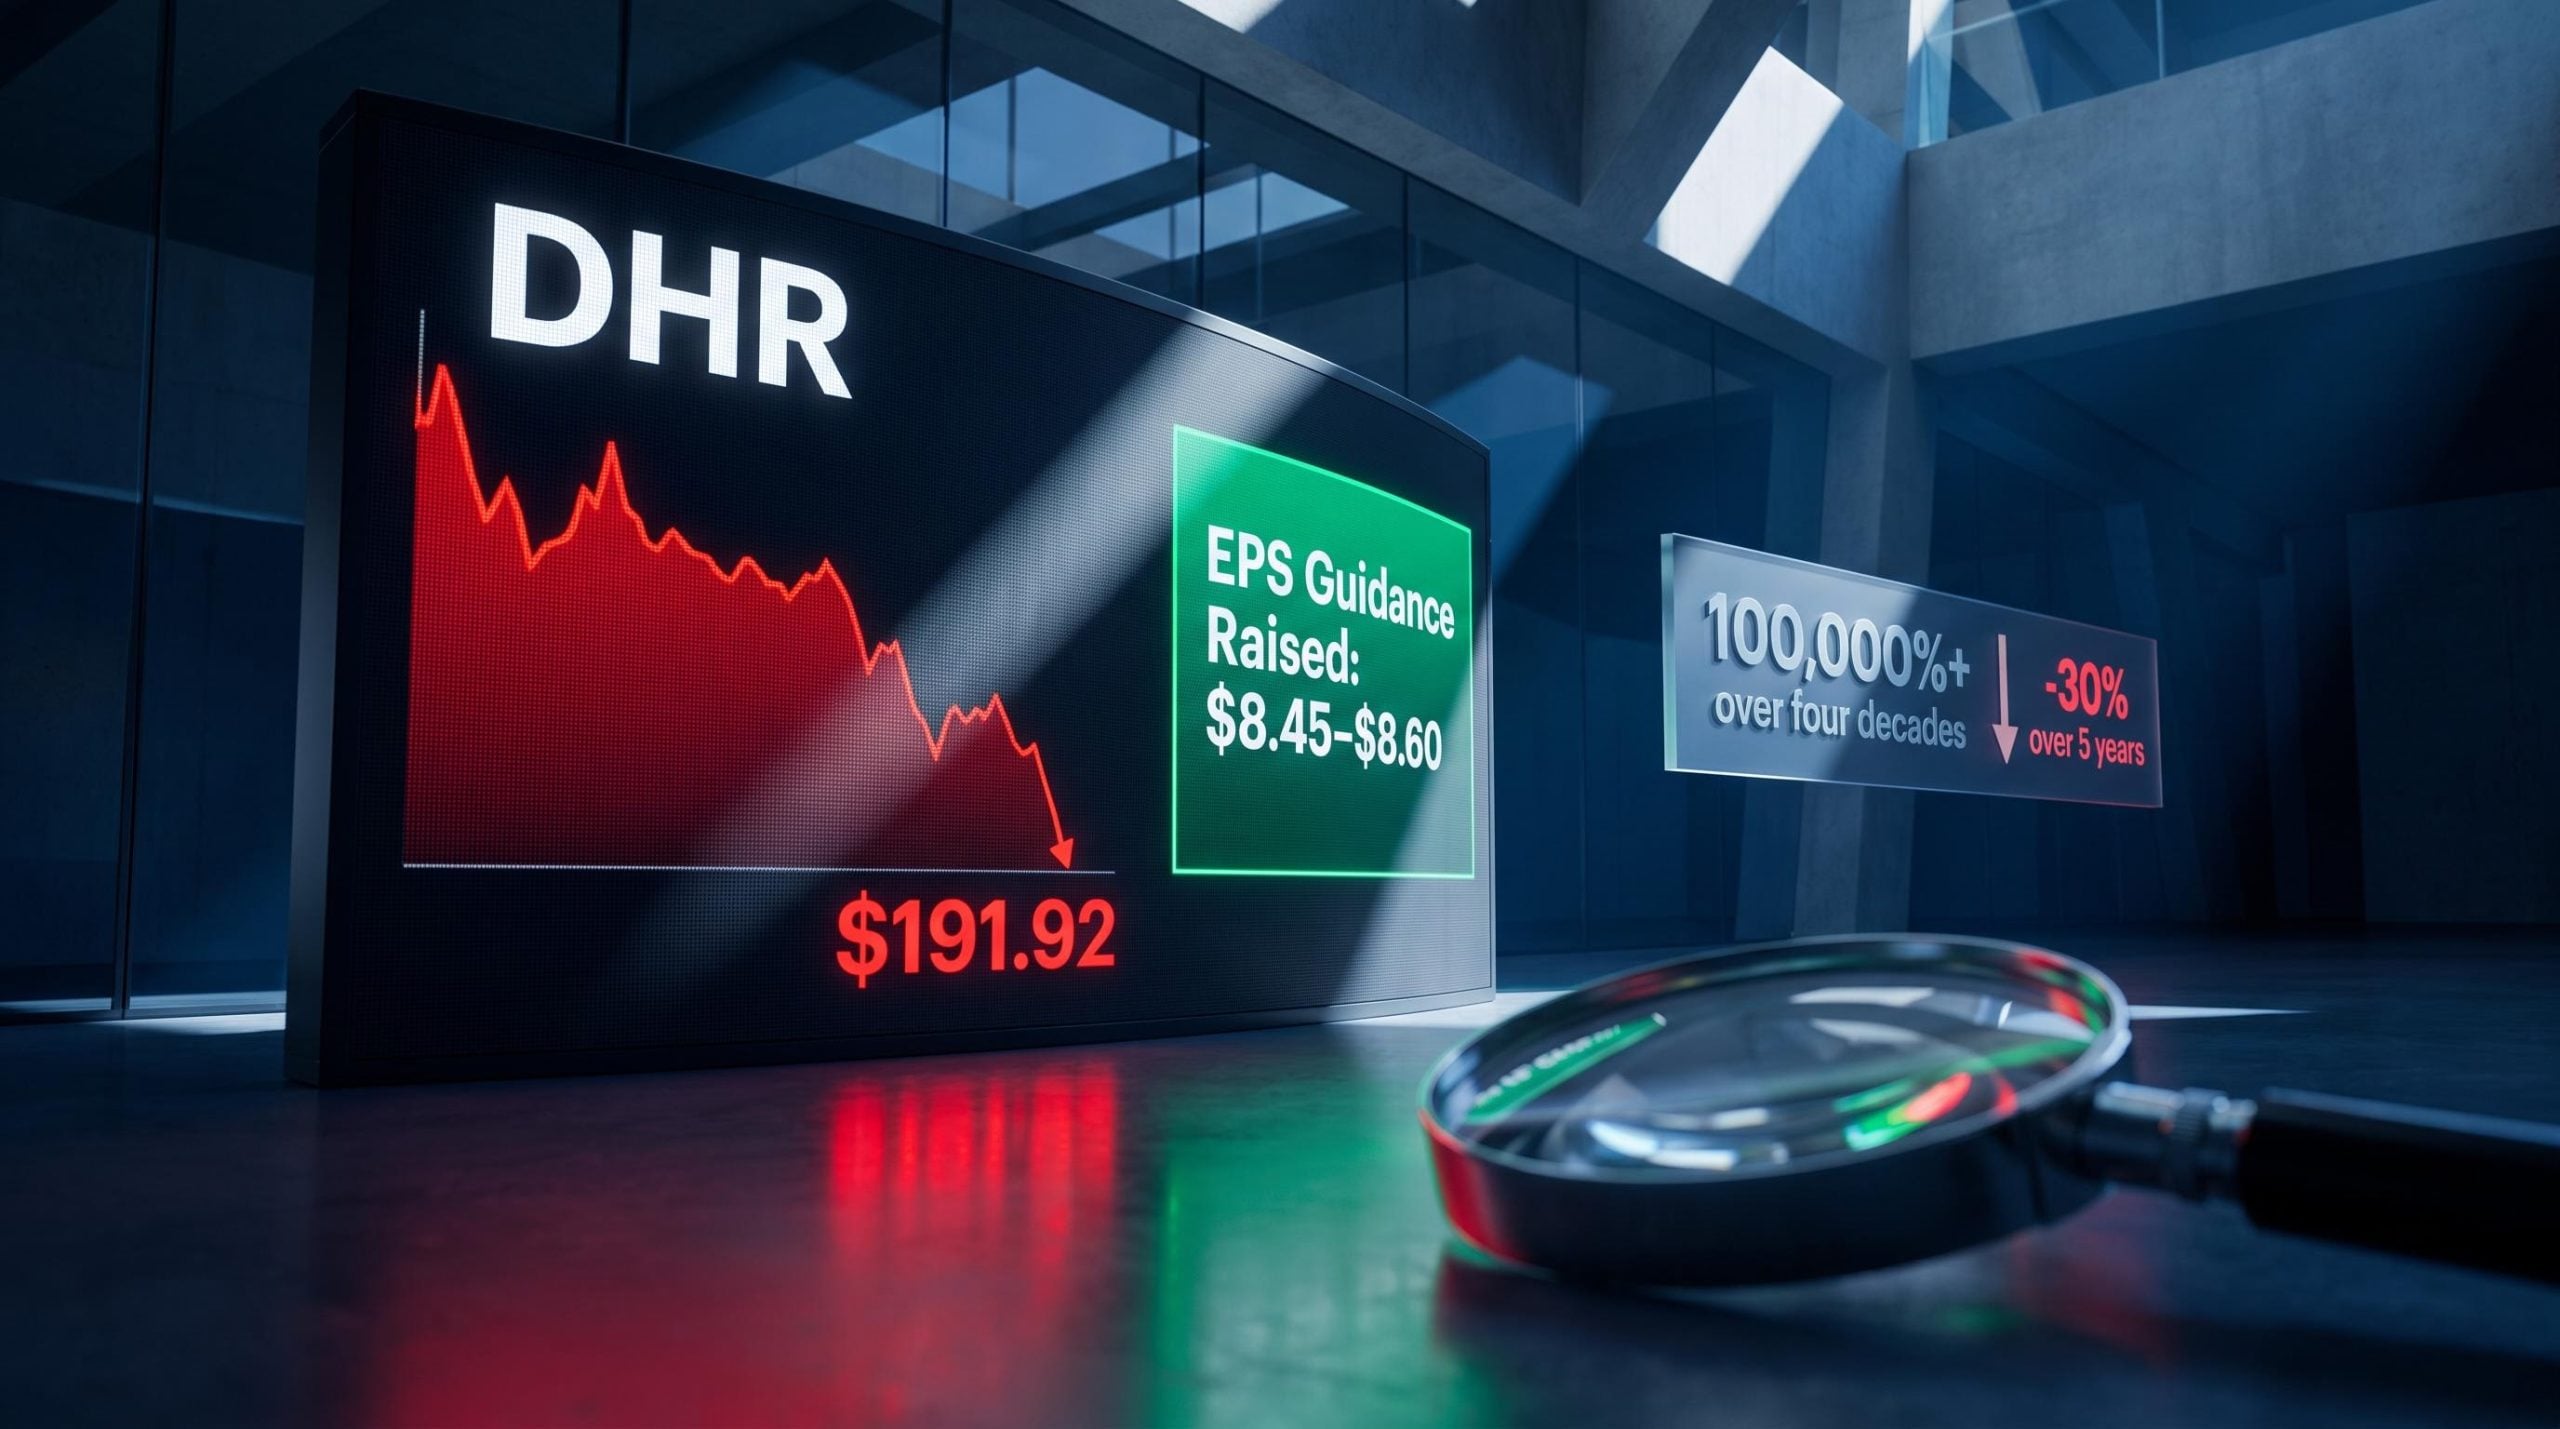
Danaher has returned more than 100,000% over four decades. Last week, the stock fell more than 10% in a single session. The quarter that triggered the selloff? A beat on earnings, a beat on revenue, and a raise to full-year guidance.
That paradox carries more weight than it might in isolation. Danaher shares have declined approximately 30-34% over the past five years, a stretch of underperformance that has tested the patience of even the most committed quality-growth investors. A bad day during a strong run is noise. A bad day after five years of underperformance forces a harder question about what the market is actually telling you.
Here is a structured way to work through the most important question in quality-growth investing right now: when does a great business at a fair price become a genuine buying opportunity, and when does the same setup signal a value trap? The framework applied here is not specific to Danaher. It is a repeatable lens you can use any time a high-quality compounder stumbles.
What the post-earnings selloff was actually pricing in
Danaher beat Q2 2026 estimates on both revenue and earnings per share. Management raised full-year adjusted EPS guidance to $8.45-$8.60. The stock dropped approximately 11-15% in a single session, pushing shares roughly 25-30% below a 52-week high of approximately $242.80.
The selloff was not a verdict on the reported quarter. It was a forward-looking vote on growth trajectory. Three guidance metrics told the story:
- Full-year FY2026 core revenue growth: 3.0%-4.0%
- Q3 2026 core revenue growth: 2%-3%
- Full-year adjusted EPS: $8.45-$8.60 (raised)
Management described bioprocessing sales as “surprisingly soft,” the phrase that anchored the market’s concern about the pace of recovery.
The EPS guidance raise carried less weight than it might otherwise have, given that management linked a portion of the improvement to the deal timing of the Masimo acquisition closing ahead of schedule and to currency tailwinds, rather than to an underlying acceleration in operations. Investors who had been positioning for a clear re-acceleration in core growth found something slower instead.
What this tells you is that the current price is less a reaction to bad news than a recalibration of how fast the rebound actually arrives. The market had already priced in recovery. It found the pace insufficient.
When big ASX news breaks, our subscribers know first
Categorising Danaher’s headwinds: cyclical vs. structural
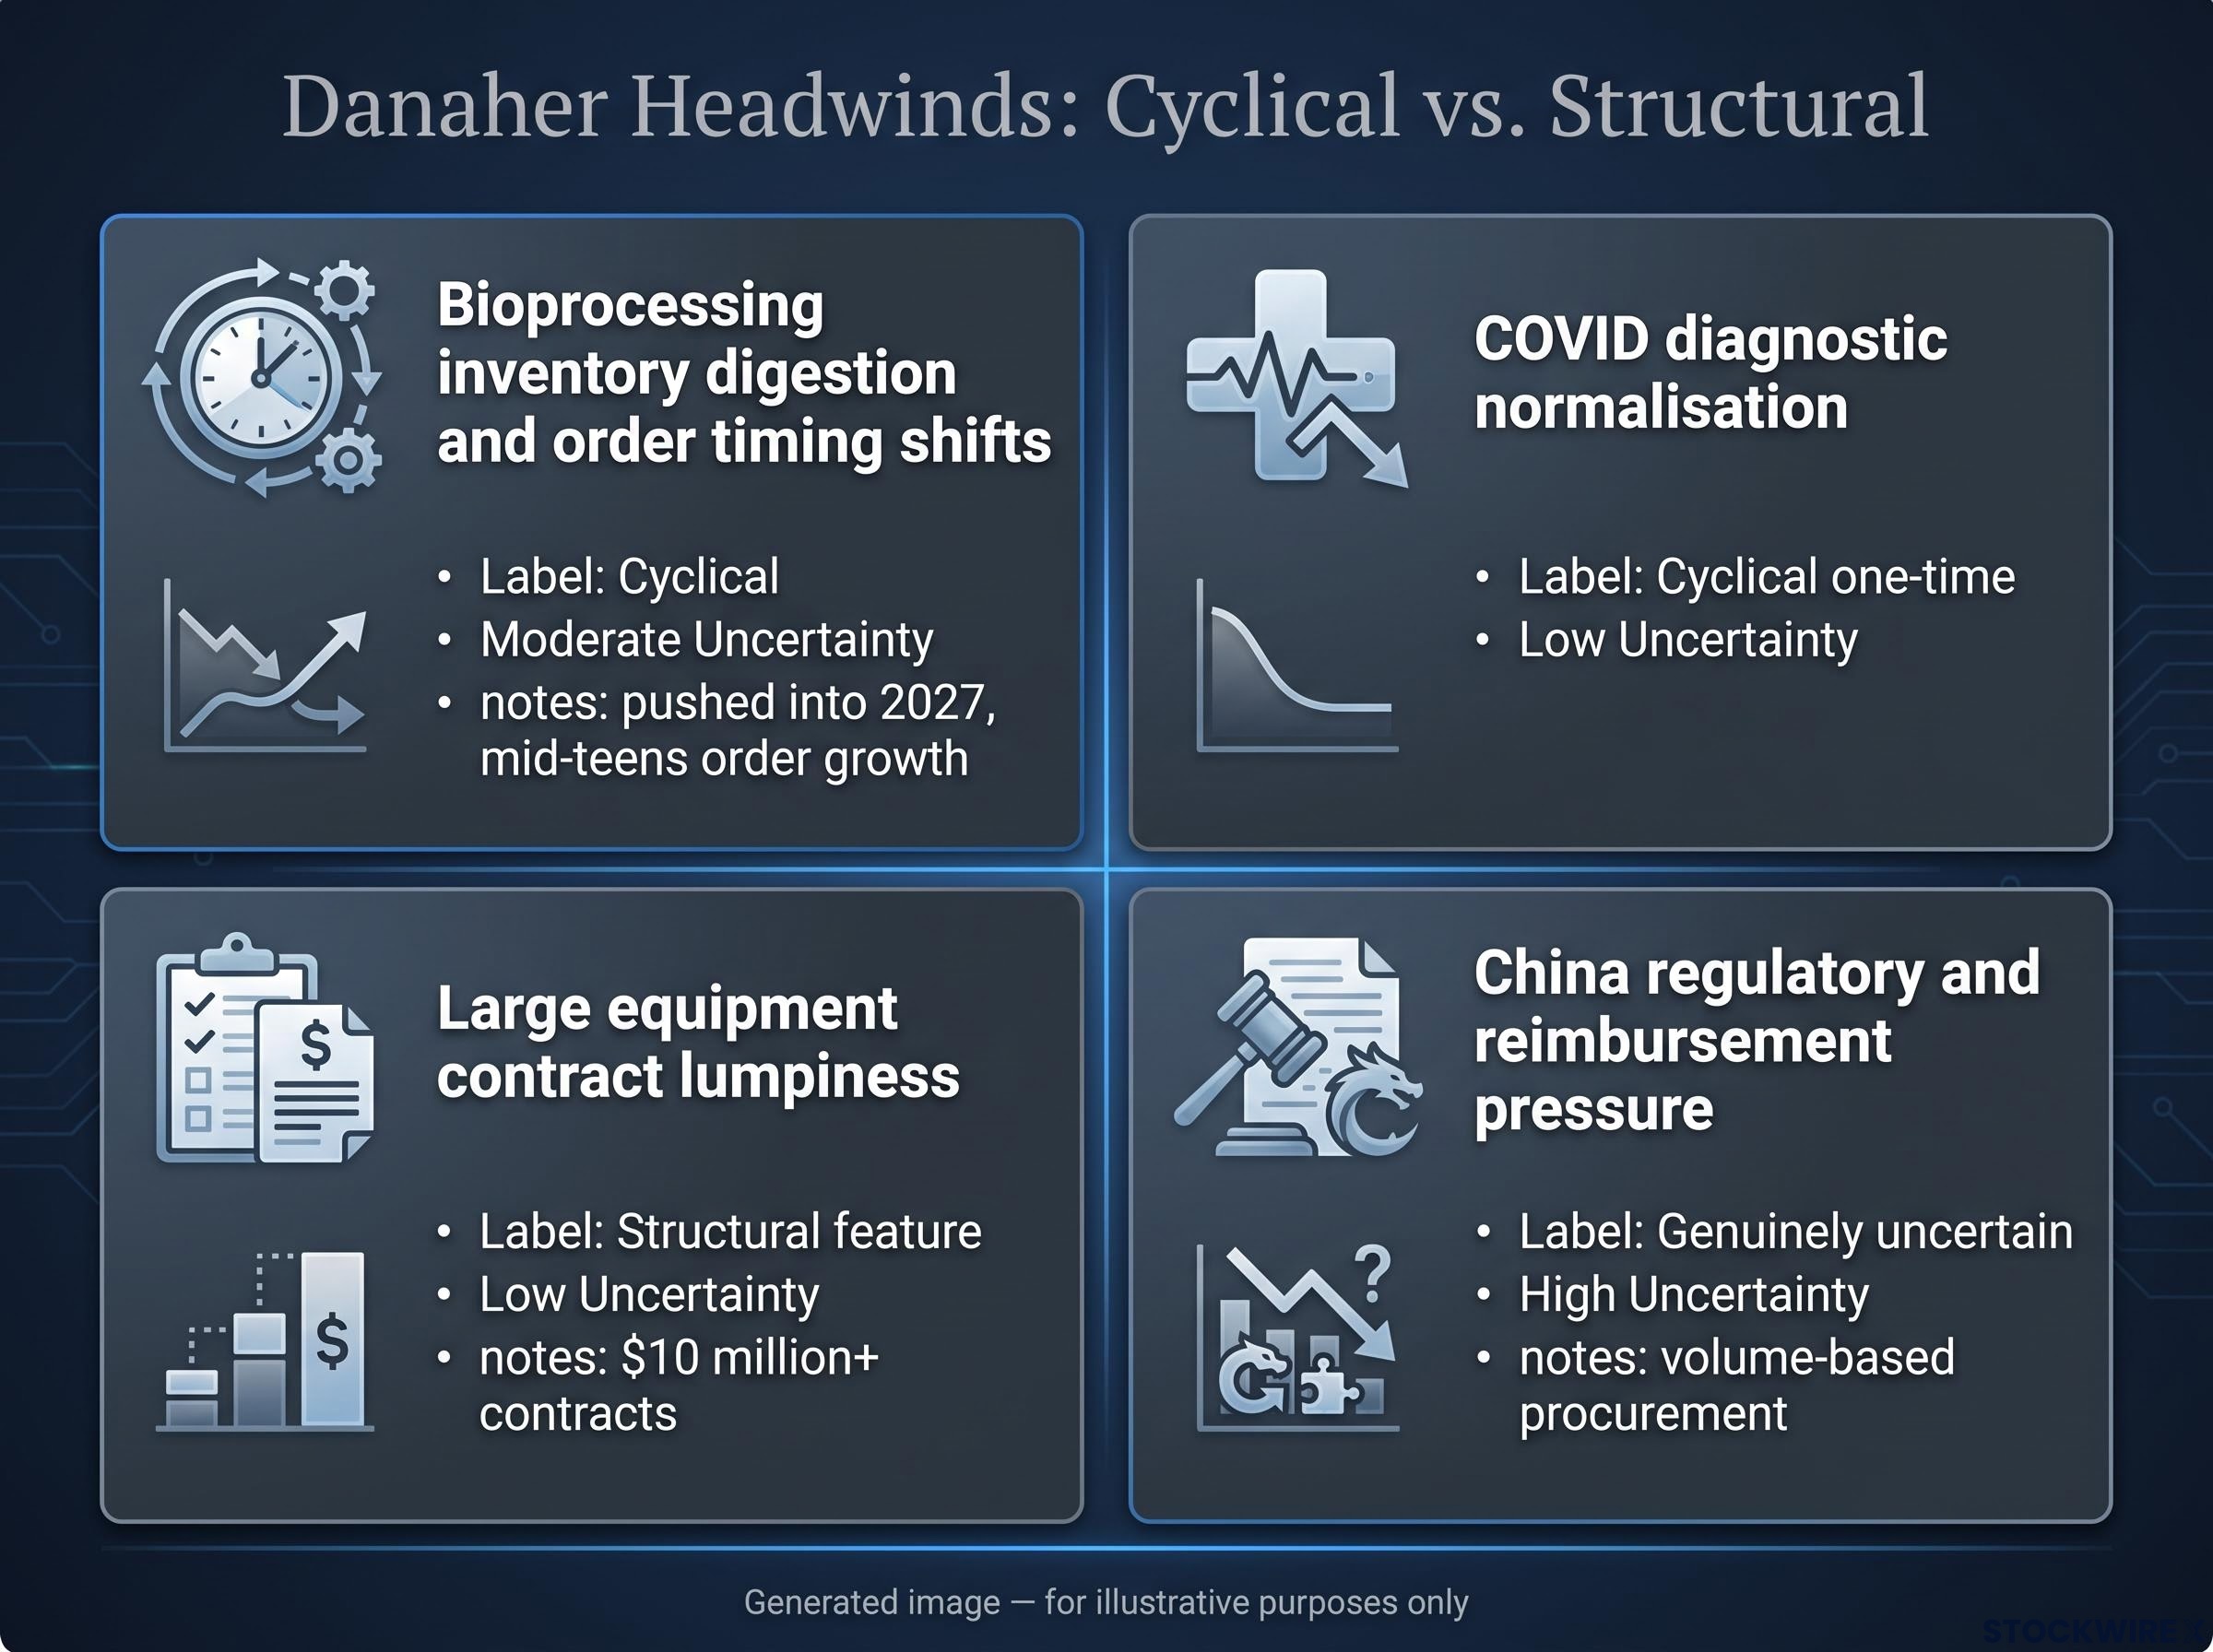
Four headwinds explain most of the five-year underperformance. Understanding which ones are temporary and which carry genuine structural ambiguity is the analytical work that separates opportunity from trap.
Value trap identification hinges on distinguishing structurally declining businesses from temporarily mispriced ones, a distinction that requires evaluating whether headwinds have traceable causes and plausible endpoints rather than simply observing that a stock has fallen.
| Headwind | Classification | Key Evidence | Uncertainty Level |
|---|---|---|---|
| Bioprocessing inventory digestion and order timing shifts | Cyclical | Orders growing mid-teens even as revenue conversion lags; shipments pushed into 2027 | Moderate |
| COVID diagnostic normalisation | Cyclical (one-time) | Pandemic-era testing demand returning to baseline; does not indicate lost market relevance | Low |
| Large equipment contract lumpiness | Structural feature (not demand loss) | Large contracts worth $10 million or above slipping between reporting periods | Low |
| China regulatory and reimbursement pressure | Genuinely uncertain | Volume-based procurement baked into guidance; could be permanent regime shift | High |
The first three headwinds have traceable causes and plausible end points. Bioprocessing softness is an inventory and timing issue. COVID revenue unwind is a one-time normalisation. Equipment lumpiness is how the business model works, not a signal that demand is disappearing.
Where the structural risk case lives
Two genuine unknowns remain unresolved. China’s volume-based procurement could be a permanent regime shift rather than a transitional policy, capping growth in an important geography indefinitely. And if bioprocessing softness reflects customers shifting to competing platforms rather than digesting pandemic-era inventory, the assumed recovery simply does not arrive.
China regulatory pressure on healthcare and diagnostics companies sits within a broader structural shift in the Chinese economy, where volume-based procurement and reimbursement reform reflect a deliberate policy orientation toward cost containment that institutional research teams now classify as a persistent condition rather than a transitional phase.
These are live risks. Resolving them prematurely would sacrifice the intellectual honesty that makes the rest of this analysis credible. The note on approximately $100 million in postponed bioprocessing shipments should be treated as directional context only; the specific figure has not been independently verified.
How the Danaher Business System creates durable recurring revenue
The headwinds discussed above need to be evaluated against the right baseline, and Danaher’s baseline is structurally different from a typical industrial company.
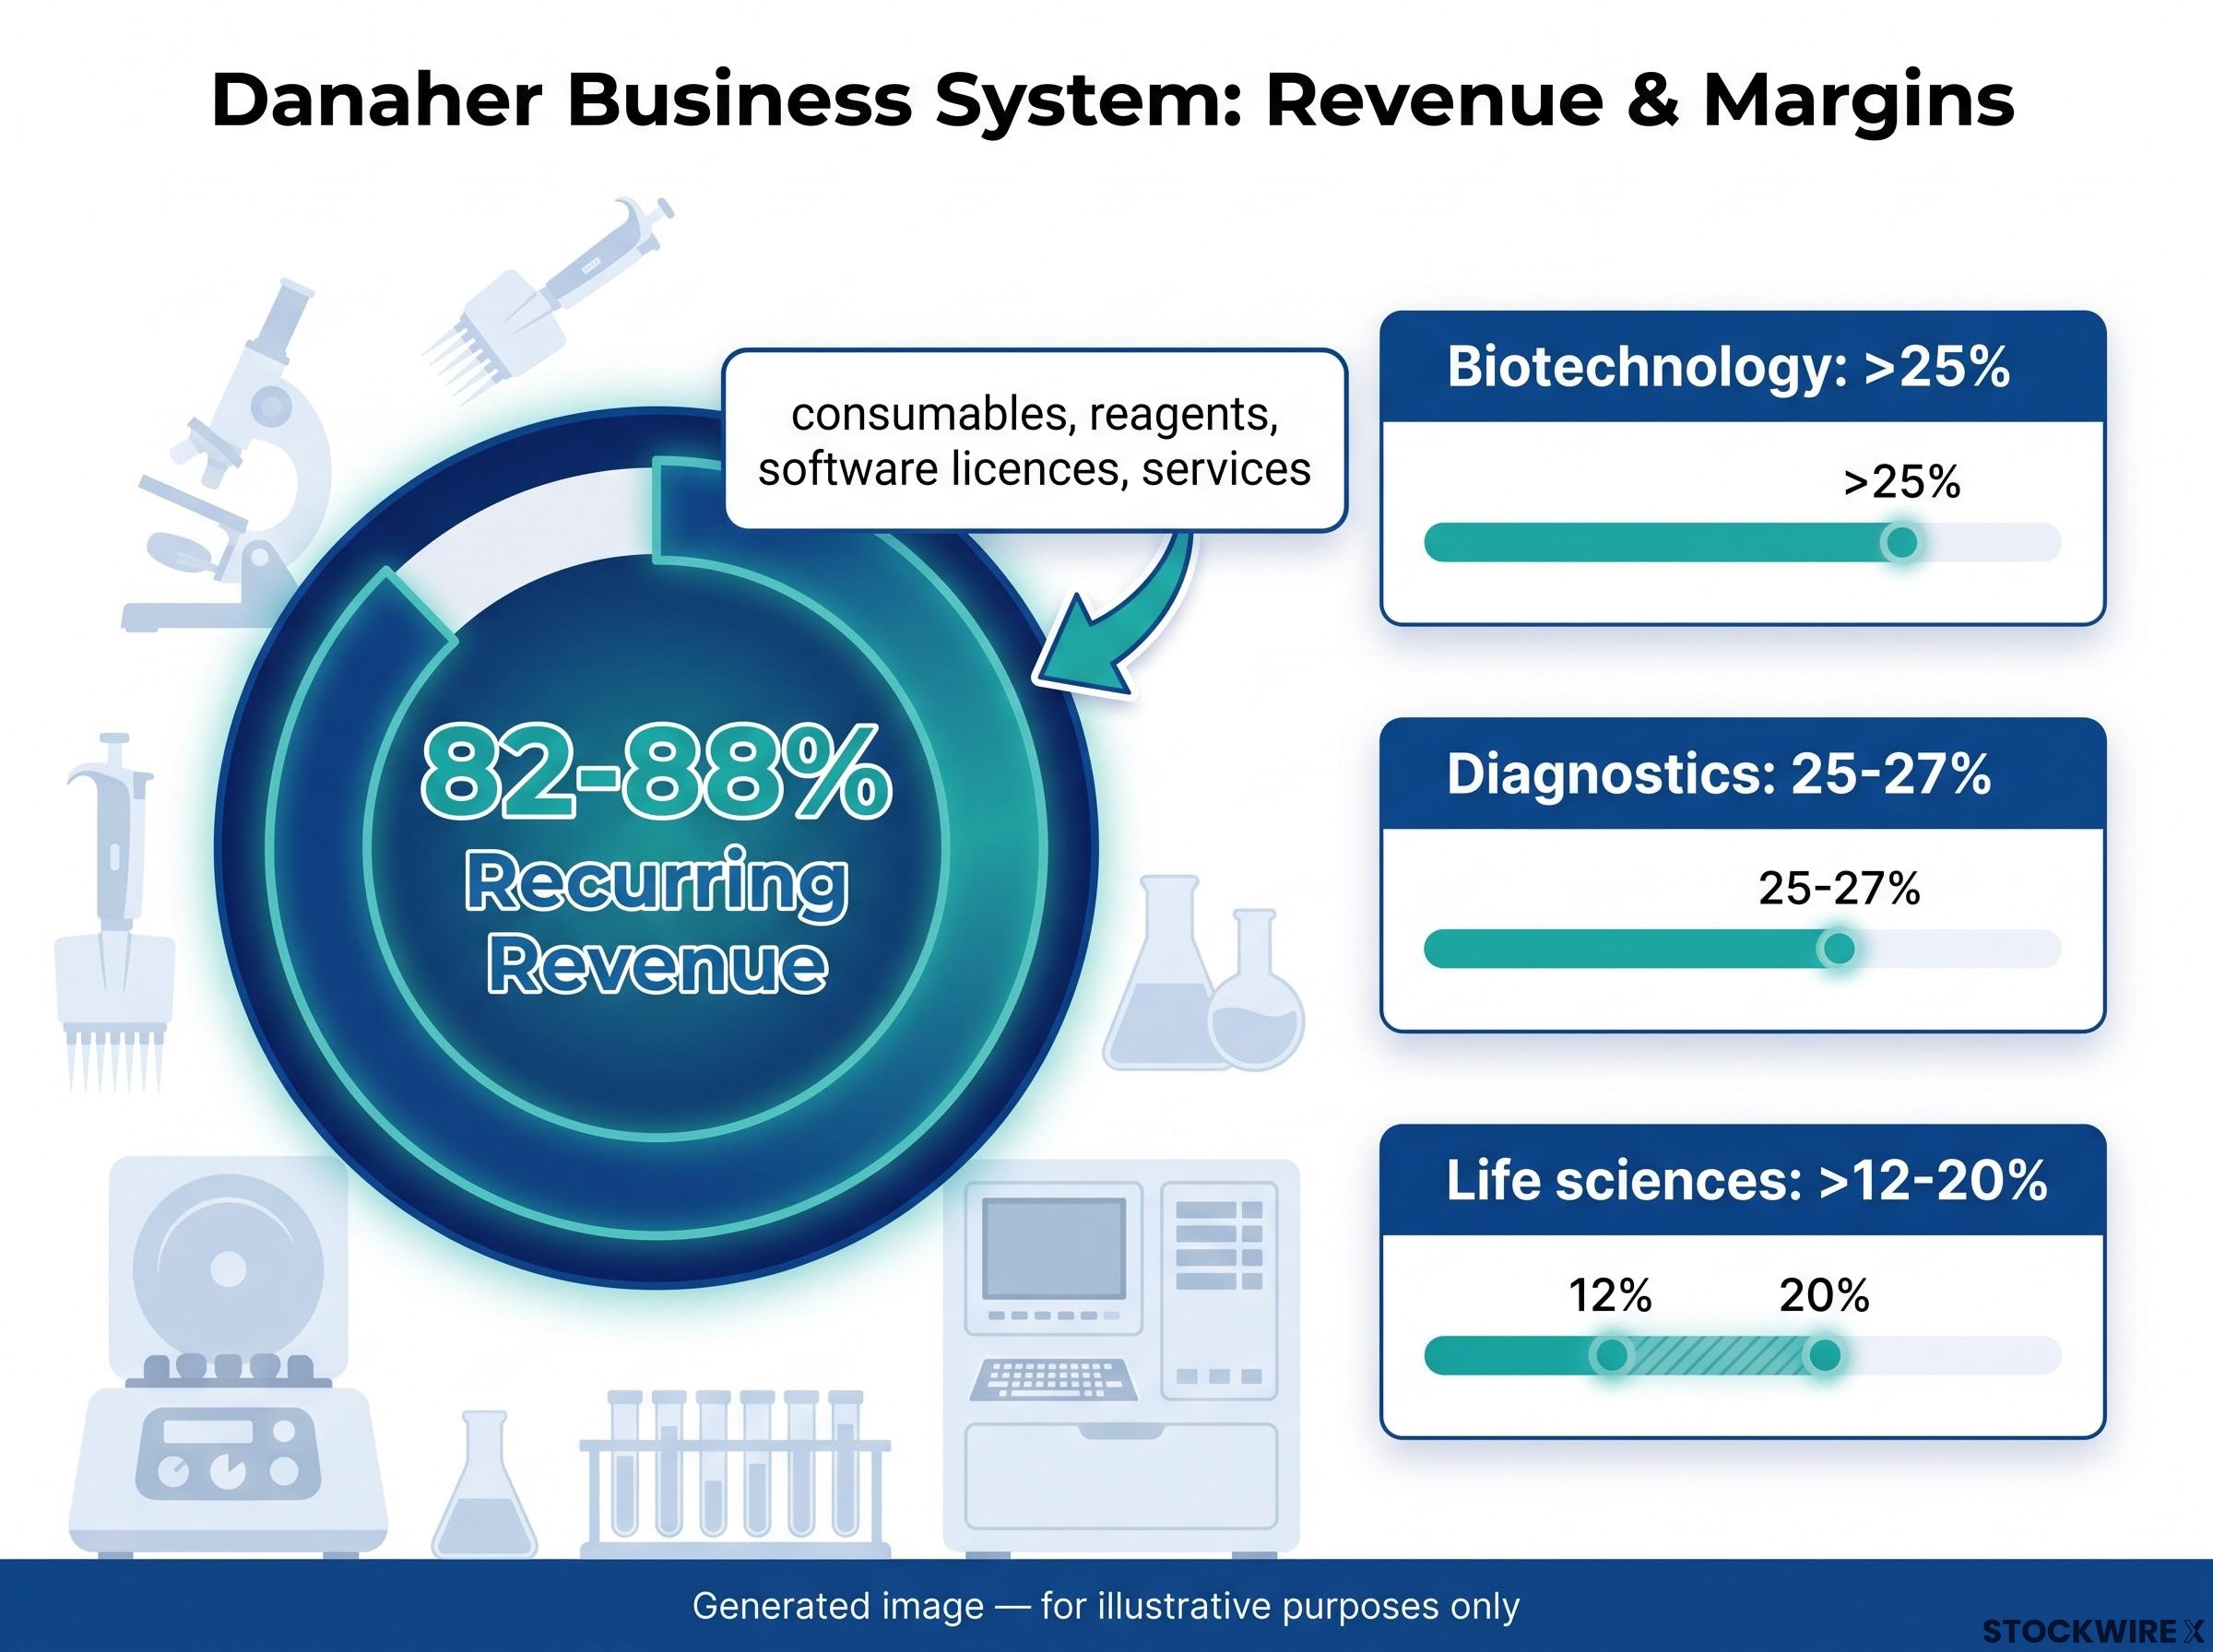
Approximately 82-88% of Danaher’s revenue is recurring. That figure comes from consumables, reagents, software licences, and services embedded so deeply into customer workflows that switching vendors is expensive, time-consuming, and operationally risky.
The deepest retention advantage sits in bioprocessing: pharmaceutical manufacturers who gain regulatory approval for a production process built around specific Danaher equipment face a re-approval requirement if they change suppliers. This approval-driven dependency creates switching costs that are structurally resistant to competitive pressure.
This recurring revenue architecture is why Danaher generates durable margins even during periods of slow top-line growth. Across its three segments:
- Biotechnology: adjusted margins above 25%
- Diagnostics: margins of approximately 25-27%
- Life sciences: margins above 12-20%
The 82-88% recurring revenue figure is not just a business quality metric. It tells you that even in a slow-growth year, a large majority of revenue renews without requiring new customer acquisition. Revenue disappoints; margins hold. That is the pattern the Danaher Business System, the company’s internal operational framework for acquiring businesses and improving their performance, has sustained across a shareholder return record spanning more than 100,000% over four decades.
What the valuation actually says at $191-192
At a recent price near $191-192, Danaher trades at approximately 21-23x current-year EPS on guidance of $8.45-$8.60. Inverting that multiple produces an earnings yield in the region of 4-5%, representing the baseline return the business delivers before any growth is layered on top.
| Return Component | Low Scenario | Base Scenario | High Scenario |
|---|---|---|---|
| Earnings yield | ~4% | ~4.5% | ~5% |
| Long-term EPS growth (annual) | ~3% | ~7-8% | ~10% |
| Implied total annual return | ~7% | ~11-12% | ~15% |
Combining the earnings yield with realistic growth assumptions, the base case points to an annual return in the 7-12% range before any change in valuation multiple is considered. That is attractive for a durable business, but it is not the kind of 15%+ fat pitch that strict value investors demand.
The mechanics of valuing slowing growth stocks shift the relevant tool from revenue multiples toward earnings-anchored frameworks, a transition that matters here because Danaher’s near-term core growth of 3.0%-4.0% puts it squarely in the zone where P/E ratios and scenario analysis replace TAM projections as the primary valuation inputs.
Independent equity research describes Danaher as “a wonderful compounder, finally at a fair price,” with a blended fair value near $200-$205.
The consensus 12-month analyst target sits at approximately $240-$242. A more detailed scenario analysis pegs potential value near $245 by end-2028. On the other end, a deeper value entry would require roughly 15-16x earnings, corresponding to the mid-$160s to mid-$170s range (specific figures not independently verified).
The gap between the current price and the fair-value cluster near $200-$205 tells you this is not a distressed asset trading at a steep discount. It is a quality business where the reward is time and compounding rather than a sharp mean reversion. That changes who this is right for.
Management alignment and institutional conviction signals
Management and institutional signals are secondary evidence, not the thesis itself. They either corroborate the cyclical reading or fail to, and in Danaher’s case they mostly corroborate.
- Rales family ownership: Founding brother Steven Rales retains a stake of approximately 6.1% of shares outstanding, providing continued skin in the game at an ownership level consistent with a long-term steward rather than an active founder. That is a constructive signal, though not one that independently drives a conviction decision.
- CEO equity concentration: The bulk of CEO Rainer Blair’s remuneration is delivered in equity, with total compensation of approximately $20-$23 million dwarfing annual cash pay of approximately $1.3-$1.4 million. A portion of his option grants carry exercise prices in the $200-$250 range, meaning those awards only become valuable if the share price moves materially higher.
- Institutional accumulation: Capital Group and D1 Capital have been identified as having added to positions during the recent period of price weakness, based on the most recently available filing data covering Q1 2026.
What institutional accumulation does and does not tell you
Institutions are wrong at scale regularly, and filing data is backward-looking by the time it becomes public. What the Capital Group and D1 Capital purchases tell you is that people with large amounts of capital and long time horizons are reading the same headwinds as temporary rather than permanent. That is one consistent data point within a larger analytical picture, not a standalone buy signal.
Buying opportunity or value trap: the decision framework
The evidence does not point to a value trap. Core franchises remain embedded infrastructure for biopharma manufacturing and clinical diagnostics. Bioprocessing orders are growing mid-teens in certain metrics even as revenue conversion lags. No current data suggests permanent demand destruction.
But “not a trap” is different from “a screaming bargain.” At 21-23x earnings with low single-digit near-term core growth and real execution risk, the opportunity is good, not great.
Three variables would change the verdict from cyclical opportunity to genuine trap:
- Bioprocessing revenue failing to recover through 2027, suggesting platform-shift rather than inventory digestion
- China diagnostics pressure proving permanent rather than transitional, capping growth in a geography already baked into guidance
- Acquisition integration, including Masimo, disappointing on margin targets and weakening the high-return compounder story
The honest conclusion is that “good, not great” is a precise and useful answer at $191-192: it tells a long-term quality investor this is worth owning gradually, and it tells a strict value investor to wait or size small and add lower.
For existing holders or long-term quality investors comfortable with 7-12% expected annual returns and meaningful short-term volatility, the current price represents a reasonable hold or gradual add. For strict value investors requiring a true margin of safety, the mid-$160s to mid-$170s entry range is a more compelling zone (specific figures not independently verified). That distinction matters more than a binary buy or sell call.
What patient investors should watch through the rest of 2026
Two near-term data points carry the most weight for confirming or undermining the cyclical thesis:
- Q3 2026 earnings: Management guided Q3 core revenue growth to 2%-3%. Whether the reported figure meets, beats, or misses that range is the first real test of whether the post-earnings selloff was a rational recalibration or an overreaction.
- Bioprocessing shipment conversion: The timing-shifted orders that were pushed into 2027 need to begin flowing through to revenue in Q4 2026 and early 2027. Confirmation here is the most direct evidence that the cyclical thesis is correct.
If both milestones confirm, the full-year FY2026 core revenue growth target of 3.0%-4.0% is validated, and the conviction to hold or add grows materially. If they do not, the three-variable checklist from the prior section tells you when to reconsider.
The AI market dichotomy and what it means for re-rating timing
Danaher’s underperformance reflects a broader market dynamic, not just company-specific execution. Investor capital has concentrated heavily in AI-linked names, leaving high-quality businesses outside that theme facing valuation pressure that has little to do with their underlying fundamentals. A re-rating for Danaher may depend on core growth visibly reaccelerating or on broader market leadership rotating away from the AI complex, rather than on patience alone.
AI market concentration has drawn institutional capital heavily toward semiconductor and cloud infrastructure names, with investors at BlackRock, Goldman Sachs, and Vanguard treating non-AI quality compounders as holding pattern positions until broader market leadership rotates, a dynamic that directly constrains Danaher’s re-rating timeline regardless of underlying operational progress.
The verdict a long-term quality investor can act on
The six analytical layers point to the same conclusion. Danaher’s post-earnings drop is a legitimate buying opportunity for patient quality investors, but only a “good, not great” one. The business fundamentals remain intact. The headwinds are primarily cyclical. The 7-12% base-case annual return is attractive for a durable compounder with 82-88% recurring revenue and regulatory lock-in.
The post-earnings drop is a legitimate buying opportunity for patient quality investors, but only a “good, not great” one.
The valuation at $191-192 offers a fair price, not a deep discount, against a consensus 12-month target of approximately $240-$242 and independent fair value near $200-$205. Quality investors building positions in durable compounders can act gradually at current prices. Strict value investors should wait for the mid-$160s or size conservatively and add on weakness.
The cyclical-versus-structural checklist applied here, categorise each headwind, test the revenue architecture, run the return arithmetic, check the alignment signals, and identify the three failure-mode variables, is the same framework applicable to any quality compounder that underperforms through a period of industry headwinds. Danaher is the case study. The analytical lens is the takeaway.
This article is for informational purposes only and should not be considered financial advice. Investors should conduct their own research and consult with financial professionals before making investment decisions. Past performance does not guarantee future results. Financial projections are subject to market conditions and various risk factors.
—