In a single day in May 2024, GameStop’s share price more than doubled. Nothing had changed about the company’s business. No new product, no earnings surprise, no leadership announcement. A few weeks later, a single consumer price index (CPI) data release pushed the S&P 500 up 1.2% in hours. Neither event was predictable. Both moved real money.
For investors encountering market volatility for the first time, stock price movements can appear random, even irrational. Understanding the actual forces behind those movements transforms that anxiety into clarity, and clarity into better decision-making. This article explains the mechanics behind stock price changes: the supply-and-demand engine underneath every trade, the external triggers that send prices lurching in either direction, and why human psychology amplifies both the rises and the falls. It then connects that understanding to the practical question every investor eventually faces: what to actually do with this knowledge.
The engine underneath every price: supply, demand, and what a share actually represents
A share of stock is a claim on a fraction of a company’s assets and future earnings. It represents partial ownership. That much is straightforward. What is less obvious is how the price of that ownership claim gets set from one moment to the next.
At any given moment, a stock’s price is simply the most recent price at which a willing buyer and a willing seller agreed to transact. Nothing more. No algorithm decrees the “correct” value; two parties agree, and that agreement becomes the new price. This auction runs continuously during trading hours, which is why prices move tick by tick throughout the day rather than updating once at the close.
The price discovery mechanics underlying every trade involve a live order book where passive limit orders, sitting unexecuted until a counterparty arrives, contribute nearly as much to price formation as completed trades do, which explains why a sudden wave of market orders can move a price sharply even when overall trading volume looks modest.
The direction of those ticks depends on the balance between buyers and sellers:
- More buyers than sellers: competition among buyers pushes the price up.
- More sellers than buyers: competition among sellers pushes the price down.
- Balanced interest: the price holds roughly steady.
When rising demand pushes a company’s share price higher, it raises the company’s total market valuation. That higher valuation, in turn, can strengthen the company’s ability to raise capital, attract talent, and fund new initiatives. The reverse is also true: declining demand can reduce a company’s market standing and make future fundraising more expensive.
This supply-and-demand mechanism is the foundation underneath every price movement described in the rest of this article. Earnings, economic data, geopolitics, and crowd psychology all move prices through the same channel: by shifting the balance between willing buyers and willing sellers.
When big ASX news breaks, our subscribers know first
What actually triggers a price move on any given day
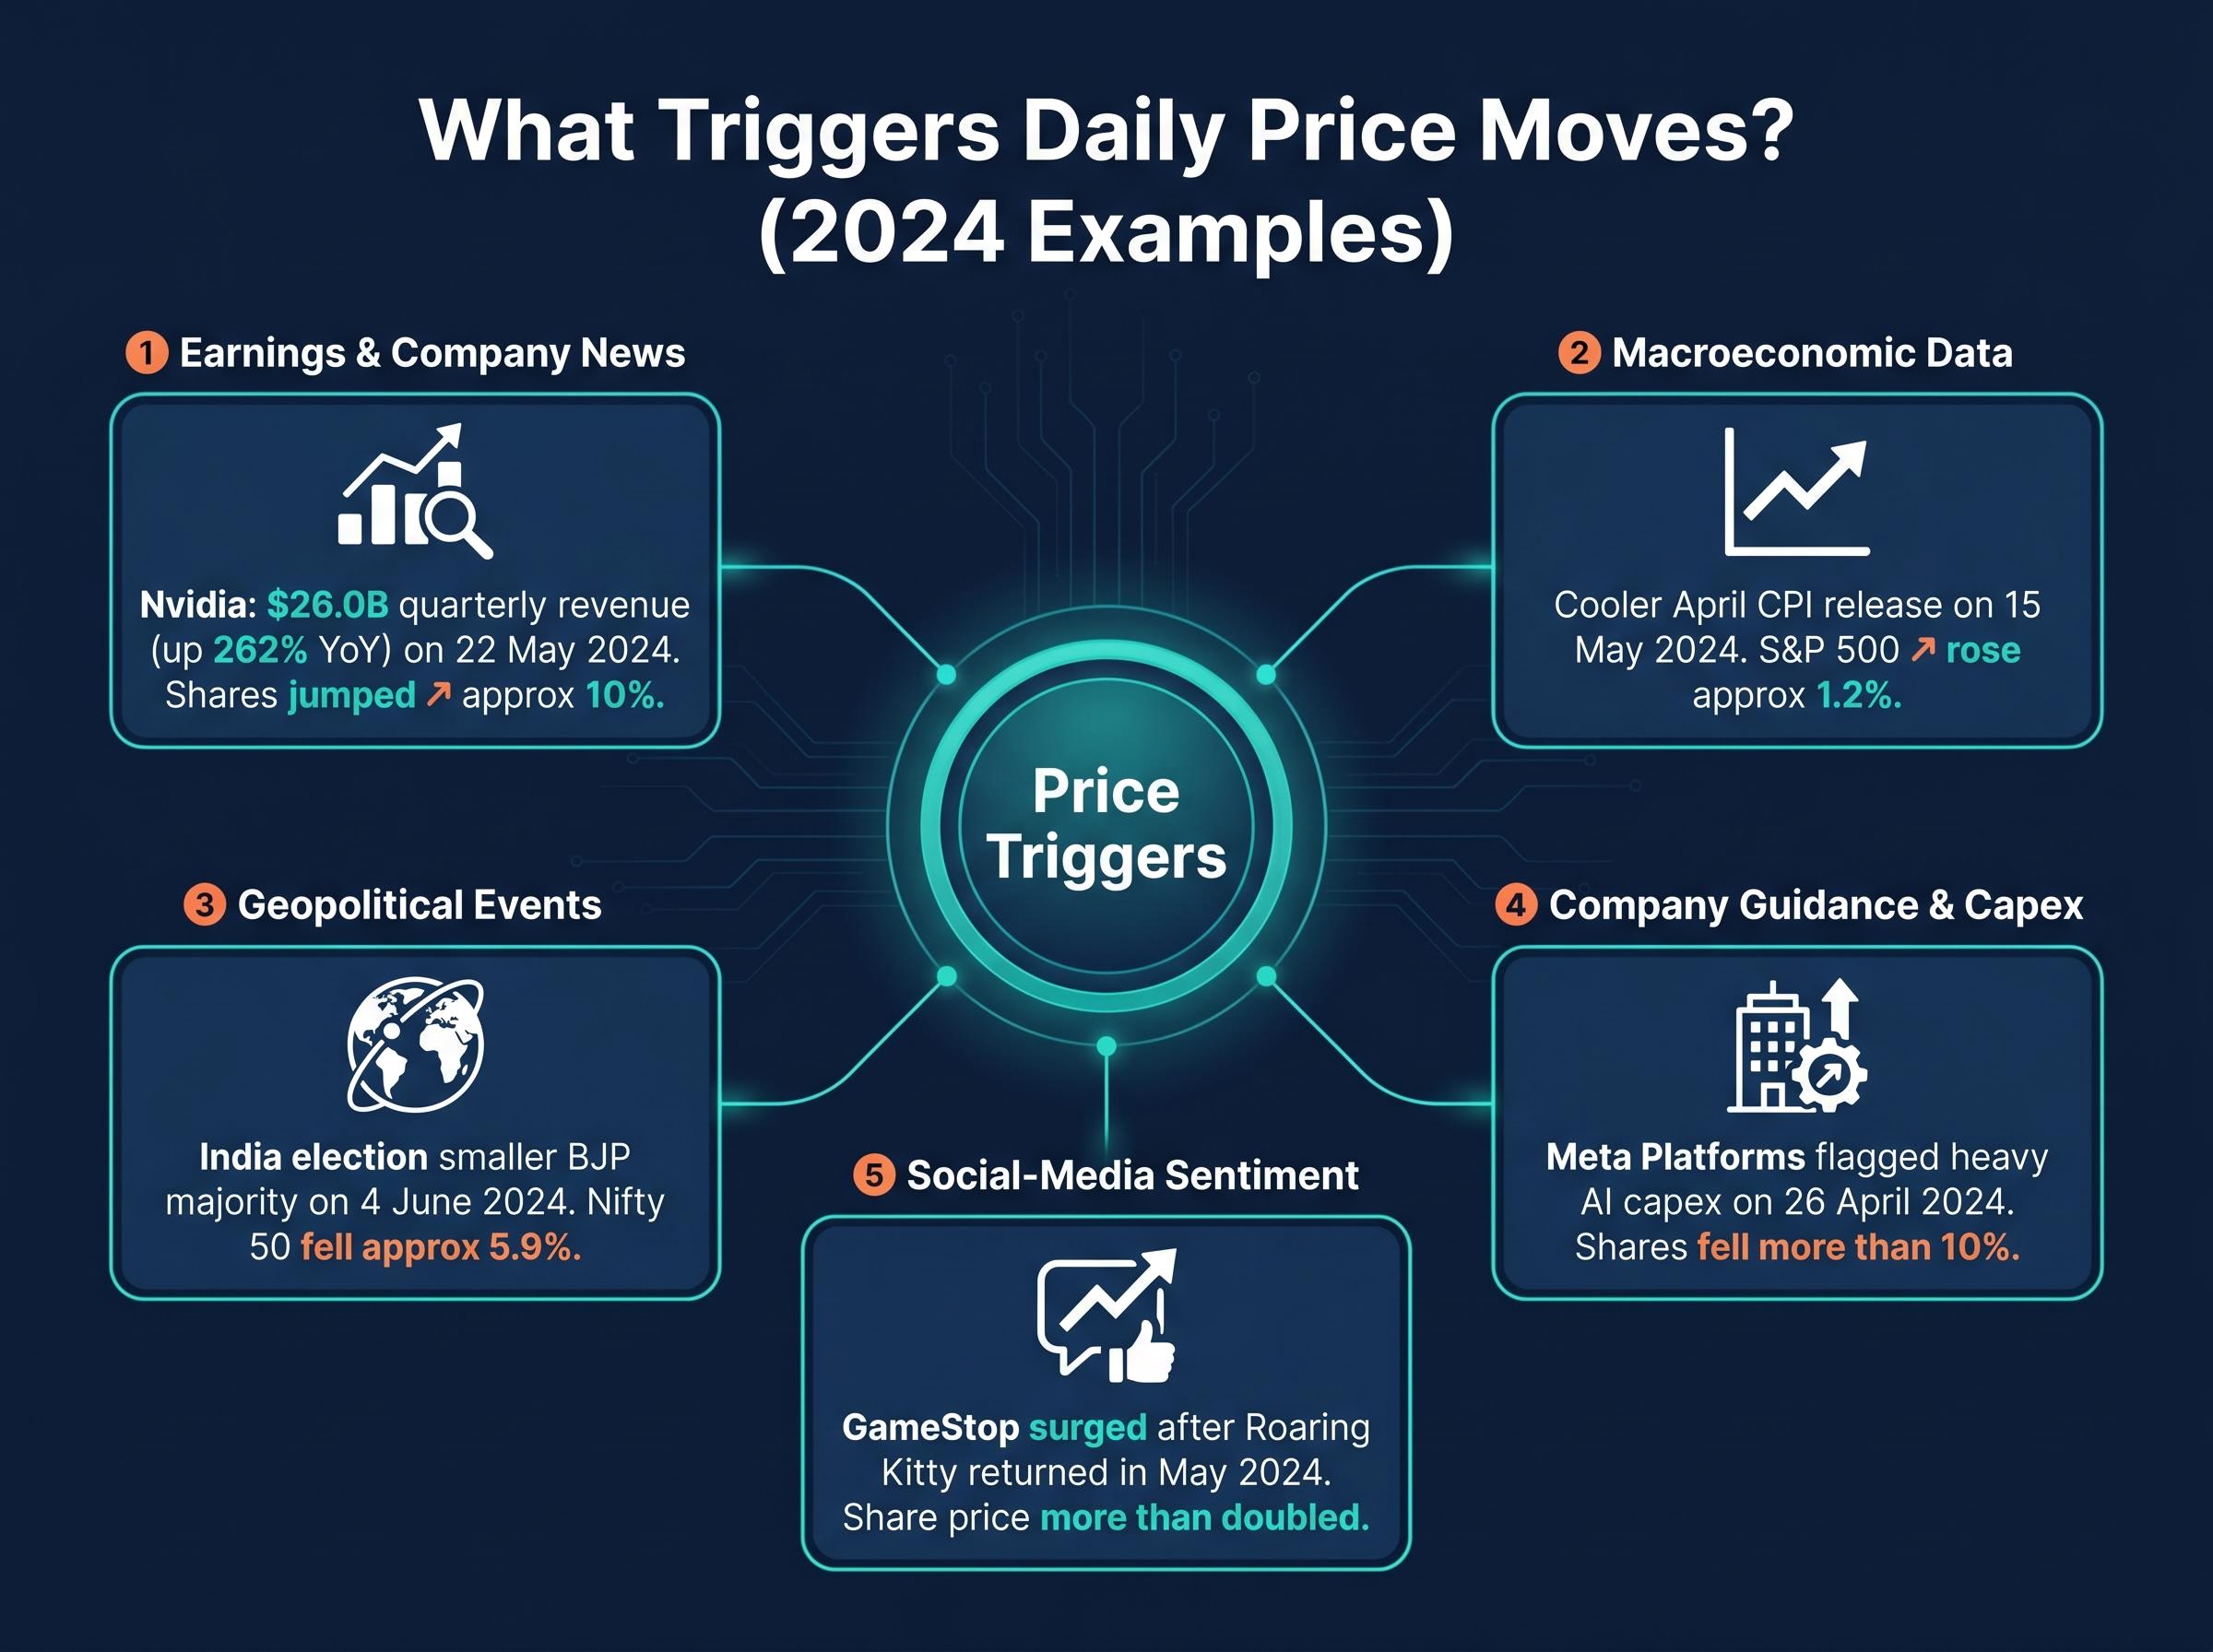
If supply and demand explain how prices move, the next question is what tips the balance. The answer, in practice, is almost everything. Five broad categories of triggers account for most daily price movement, and 2024 provided a precise illustration of each.
| Trigger Type | 2024 Example | Market Reaction | Mechanism |
|---|---|---|---|
| Earnings / company news | Nvidia reported $26.0 billion quarterly revenue (up 262% year-on-year) on 22 May 2024 | Shares jumped approximately 10% after hours | Revenue far exceeded expectations, attracting a wave of new buyers |
| Macroeconomic data | Cooler-than-expected April CPI release, 15 May 2024 | S&P 500 rose approximately 1.2% | Lower inflation raised expectations for rate cuts, boosting valuations |
| Geopolitical events | India’s election produced a smaller-than-expected BJP majority, 4 June 2024 | Nifty 50 fell approximately 5.9% intraday | Political uncertainty triggered rapid selling by domestic and foreign investors |
| Company guidance / capex | Meta Platforms flagged heavy AI capital expenditure, 26 April 2024 | Shares fell more than 10% in one session | Forward spending plans reduced expected near-term profitability |
| Social-media sentiment | GameStop surged after “Roaring Kitty” returned to social media, May 2024 | Share price more than doubled in days | Retail order flow driven by viral narrative, with no change in fundamentals |
One pattern deserves particular attention. The same data type, CPI, produced opposite market reactions depending on whether the surprise ran hot or cold.
On 14 February 2024, a stronger-than-expected January CPI print pushed the S&P 500 down roughly 1.4%. Three months later, on 15 May 2024, a cooler-than-expected April CPI reading pushed the same index up approximately 1.2%. Same report, opposite surprise direction, opposite market reaction of comparable magnitude.
The breadth of triggers here is the point. Prices respond to information across entirely different domains simultaneously, which is why no single indicator reliably predicts short-term price direction.
Why prices sometimes move on nothing at all: the psychology of markets
The triggers above share a common feature: they involve new information entering the market. But prices sometimes move without any identifiable news at all. The force behind those moves is investor psychology, a variable that is difficult to measure and even harder to predict.
At the individual level, the most powerful bias is loss aversion. Richard Thaler, the behavioural economist, reiterated in a 2024 Financial Times interview that investors tend to feel losses approximately twice as strongly as equivalent gains.
Losses feel approximately twice as painful as equivalent gains of the same size, according to behavioural economics research. This imbalance helps explain why investors so frequently sell at market lows.
That asymmetry has a measurable cost. A 2024 study published in the Journal of Behavioral and Experimental Finance (Vol. 32) found that investors who check their portfolios more frequently during volatile periods exhibit higher trading frequency and lower risk-adjusted returns. The more often investors look, the more often they encounter losses, and the more likely they are to act on the discomfort.
When individual bias becomes collective market movement
Individual loss aversion, aggregated across millions of investors, produces the herd-selling episodes that cause market declines to overshoot what company fundamentals would justify. Falling prices deter new buyers, which causes further falls, independent of underlying business value. Collective sentiment carries enough influence to drive outcomes ranging from economic expansions to financial crises, as the TED-Ed educational series on stock markets has noted.
Herd-selling episodes tend to overshoot what fundamentals justify because loss aversion, overconfidence, recency bias, and anchoring interact in a self-reinforcing loop, with each bias amplifying the others as prices fall and emotional pressure builds across a broad investor base.
Social-media platforms have accelerated this dynamic. The GameStop episode in May 2024 remains the clearest illustration: the share price more than doubled in days with analysts confirming no material change in the company’s fundamentals. The rally was driven almost entirely by retail order flow responding to a viral social-media narrative. Refinitiv/LSEG’s MarketPsych sentiment indices found that extreme positive sentiment readings were often followed by higher next-day volatility and, in some cases, short-term price reversals, suggesting that sentiment-driven rallies frequently contain the seeds of their own reversal.
The implication is uncomfortable but clarifying. Psychology does not just react to market events; it can create them.
The evidence that short-term reactions tend to cost investors money
If prices are driven by this many simultaneous forces, does reacting to them make financial sense? The performance data, accumulated across decades and geographies, points consistently in one direction.
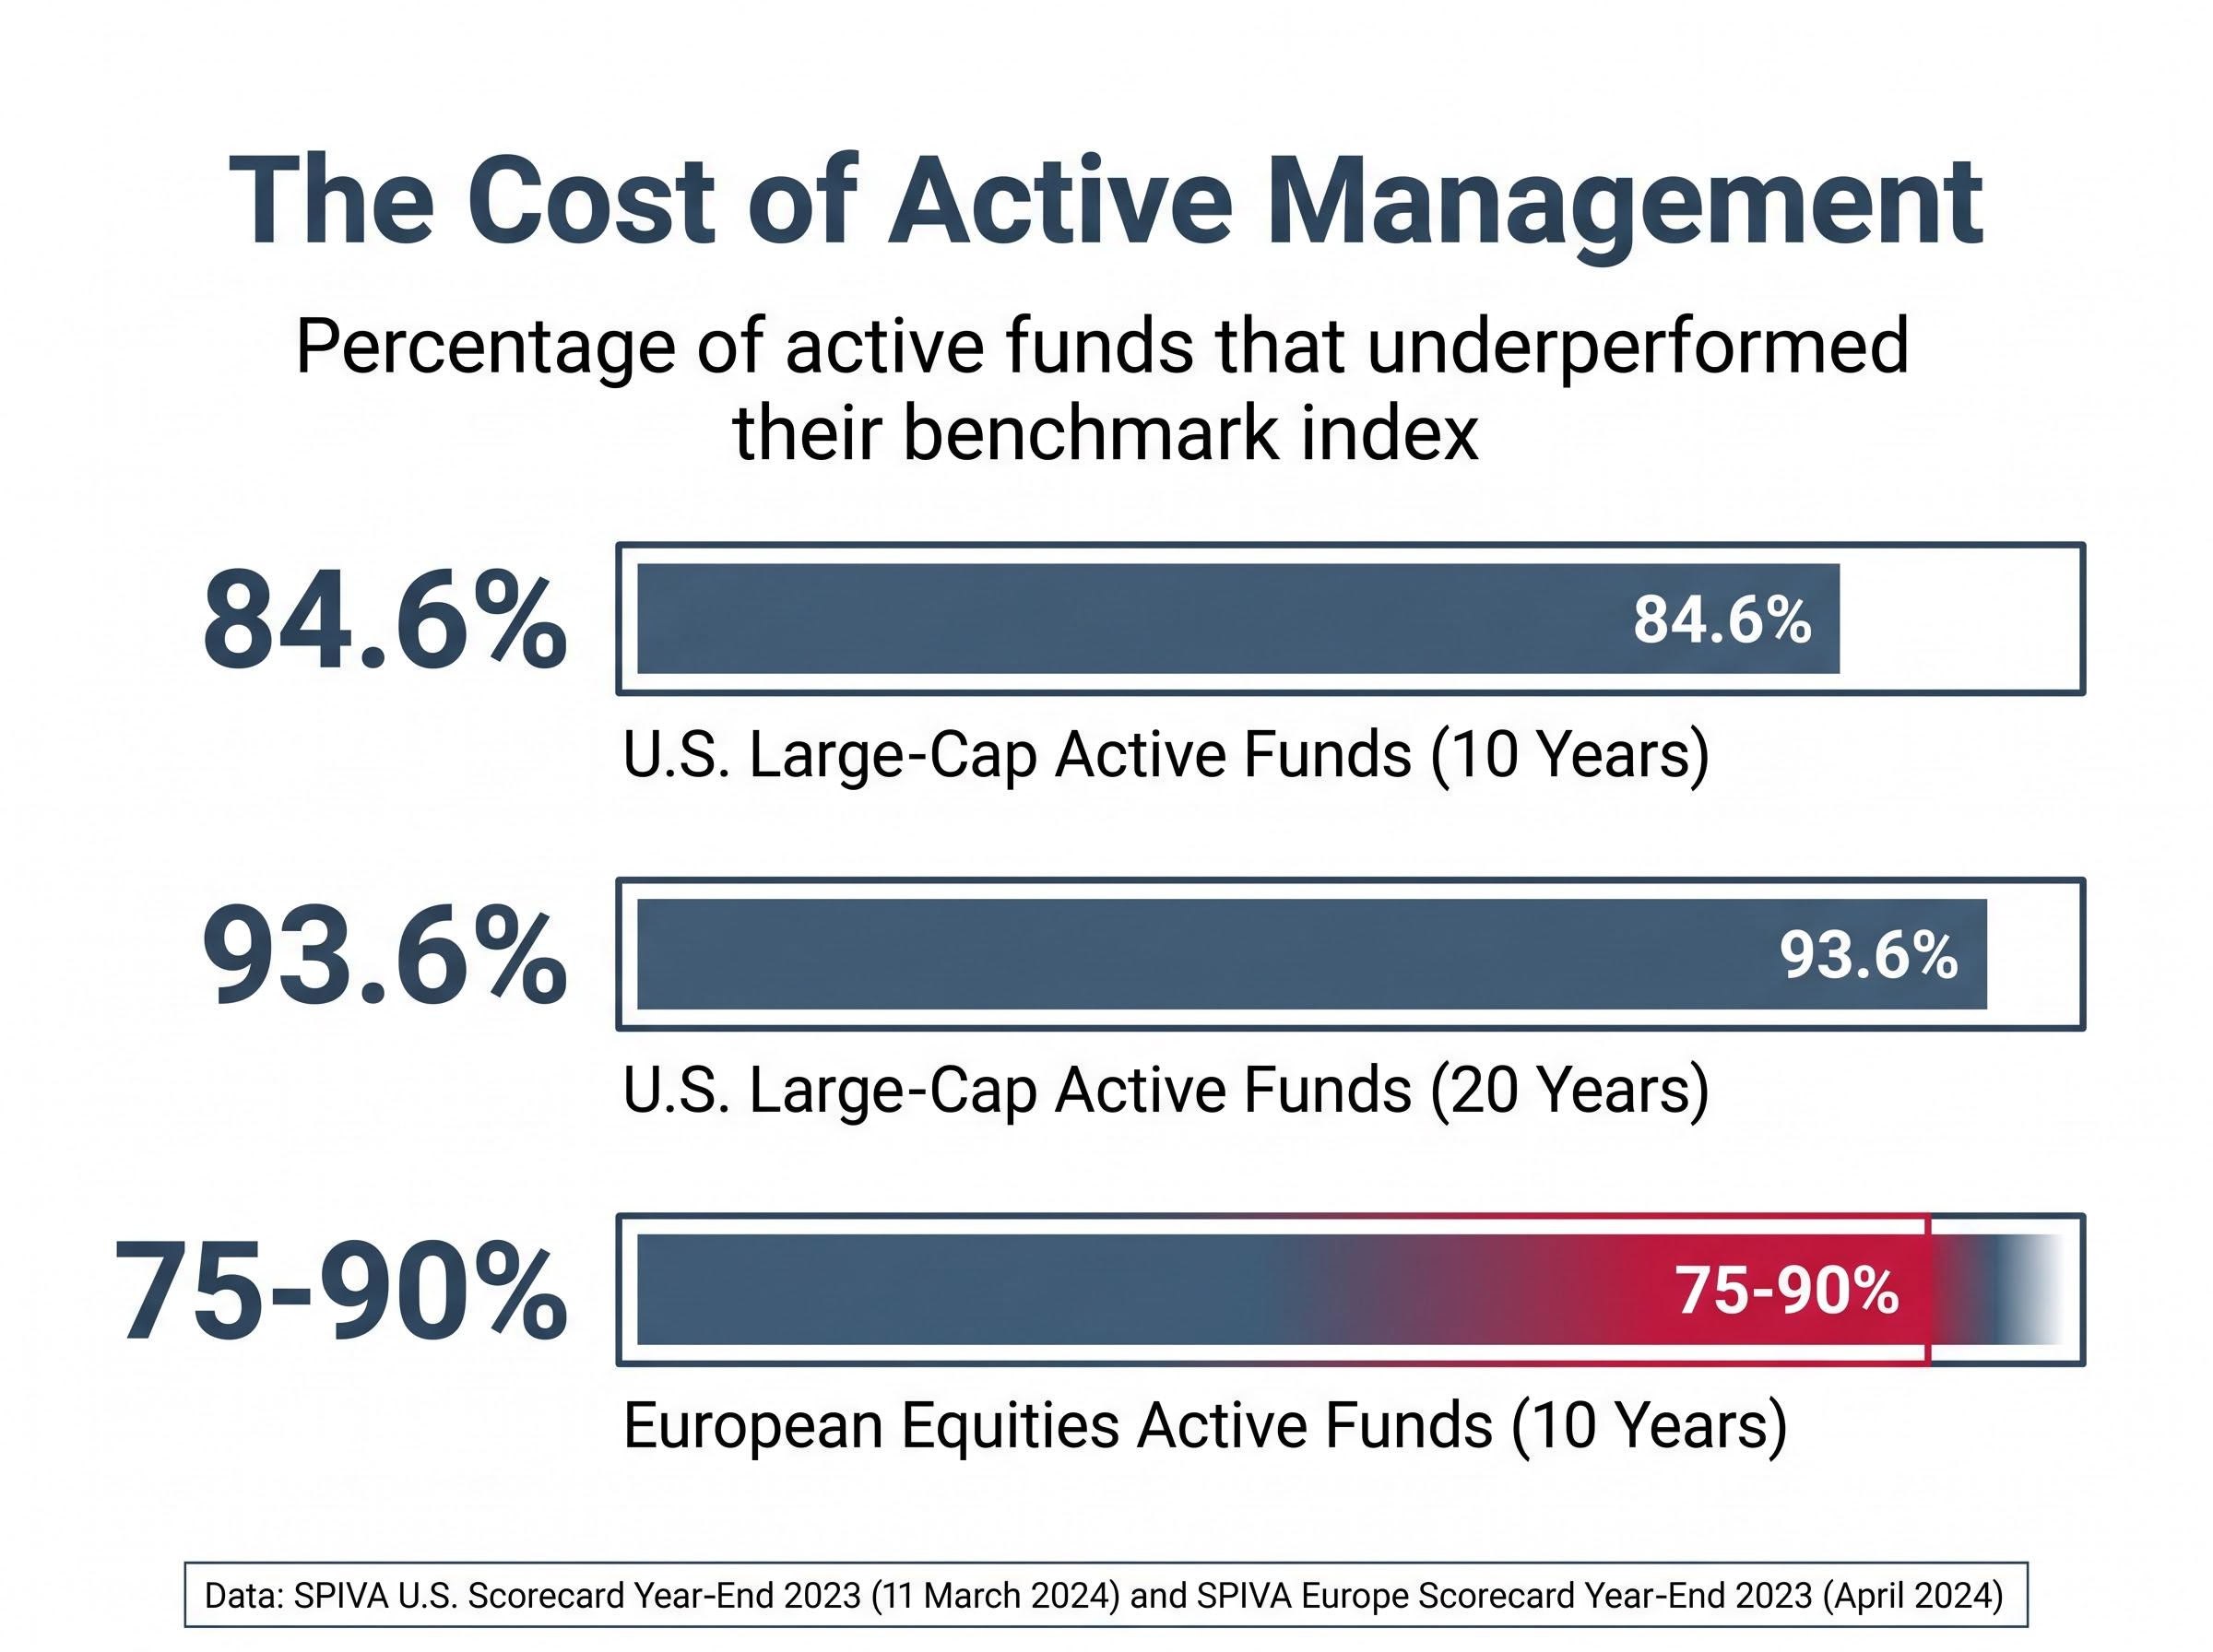
The SPIVA U.S. Scorecard Year-End 2023, published by S&P Dow Jones Indices on 11 March 2024, found that 84.6% of U.S. large-cap active equity funds underperformed the S&P 500 over 10 years. Over 20 years, that figure rose to 93.6%. The SPIVA Europe Scorecard Year-End 2023, released in April 2024, reported similar results: approximately 75-90% of active European equity funds underperformed their benchmarks over a decade, depending on category.
| Study | Market | Timeframe | Active Fund Underperformance Rate |
|---|---|---|---|
| SPIVA U.S. Year-End 2023 | U.S. large-cap | 10 years | 84.6% |
| SPIVA U.S. Year-End 2023 | U.S. large-cap | 20 years | 93.6% |
| SPIVA Europe Year-End 2023 | European equities | 10 years | 75-90% (varies by category) |
The picture is no better for individual retail traders. The U.S. SEC’s Office of the Investor Advocate reported in April 2024 that the average retail customer engaging in frequent trading underperformed a simple buy-and-hold index strategy over 2016-2021, even before accounting for fees.
Vanguard’s June 2024 research update found that the median actively managed balanced fund lagged a 60/40 index portfolio by approximately 1-1.5 percentage points per year after fees over 1994-2023. The Morningstar Active/Passive Barometer (February 2024) shows smaller lags in specific categories and shorter timeframes, so the precise magnitude of underperformance varies by period and fund type. The direction of the finding, however, is consistent across sources: active management and frequent trading tend to cost investors money.
Warren Buffett, at the Berkshire Hathaway 2024 annual meeting, put it plainly: “People that are trying to time the market… they’re going to do very well for their brokers but not necessarily for themselves.”
What long-term investors actually do differently
The evidence above describes what does not work. The question that follows is what does. Across 2024 guidance from Vanguard, Fidelity, BlackRock, the SEC, the FCA, SEBI, MAS, and ESMA, a consistent set of practices emerges, each one a direct response to a specific failure mode identified earlier in this article.
Fidelity data published in June 2024 showed that a hypothetical investor who stayed fully invested in the S&P 500 over 1980-2023 significantly outperformed an investor who missed the best 10 days. Vanguard’s March 2024 guide to market volatility reinforced this finding, noting that timing exits and re-entries is “extremely difficult even for professionals.” Because loss aversion produces worst-timed exits, the simplest counter is a system that removes the exit decision altogether.
Howard Marks of Oaktree Capital, in a January 2024 memo, argued that the best response to volatility is discipline, appropriate rebalancing, and avoiding emotional decisions.
The following practices, ranked from foundational to more advanced, reflect the professional and regulatory consensus:
- Make systematic contributions to a diversified portfolio at regular intervals, removing the temptation to time entries and exits.
- Diversify across asset classes and geographies to reduce concentration risk.
- Avoid leveraged and highly speculative products (single-stock options, contracts for difference, margin trading) until experience and financial buffers are adequate.
- Ignore social-media tips and viral narratives as a basis for investment decisions.
- Rebalance periodically rather than exiting positions during downturns.
Putting the framework into practice
Dollar-cost averaging, the practice of investing a fixed amount at regular intervals regardless of price, is the mechanism by which long-term accumulators treat volatility as a structural advantage. When prices fall, the same contribution buys more shares. When prices rise, existing holdings appreciate. The approach works precisely because it does not require predicting short-term price direction.
Low-cost index funds, exchange-traded funds (ETFs), robo-advisors, and systematic investment plans (SIPs) make this accessible to retail investors globally. BlackRock’s Global Investor Pulse 2024 survey found that Millennial and Gen Z investors show a preference for automatic investment plans to smooth out timing decisions.
The practical choice between stocks versus ETFs involves not just cost comparisons but concentration risk tradeoffs, with broad index ETFs historically showing roughly 15% annualised volatility compared with approximately 25% for concentrated individual stock portfolios, a gap that matters enormously during the volatile episodes this article has described.
Regulatory bodies across multiple jurisdictions have converged on the same guidance. SEBI in India recommends SIPs and diversified mutual funds. MAS in Singapore recommends dollar-cost averaging into diversified funds. ESMA and national regulators in France and Germany issued warnings in 2024 about finfluencer-driven expectations. The FCA frames market ups and downs as normal for long-term investors. These are the specific traps that long-term discipline is designed to avoid.
Volatility is the price of entry, not a problem to solve
Short-term price movements cannot be reliably predicted, even by professionals. They aggregate too many simultaneous variables, including supply and demand, macroeconomic data, geopolitics, and collective psychology, to reduce to any single model. The reader who arrived at this article looking for an explanation of why prices move unpredictably should now understand that the unpredictability is not a flaw in the system. It is the system.
Volatility is the mechanism through which long-term returns are generated. The discomfort that drives other investors out of positions is what creates the return available to those who stay in. The convergence of Vanguard, Fidelity, Buffett, Marks, and financial regulators across five continents on the same recommendation is itself evidence that this is the professional consensus, not a minority view.
The SEC investor guidance on market volatility reinforces this position directly, advising retail investors to maintain a long-term diversified plan and avoid panic-driven portfolio changes during turbulent periods, language that mirrors the professional consensus described across every major source cited in this article.
Because market confidence is difficult to measure or predict, most financial professionals advocate consistent long-term strategies rather than attempts at rapid short-term gains.
The goal is not to understand prices well enough to predict them. It is to build a strategy that does not depend on prediction at all.
For investors who have committed to a systematic, low-cost strategy and want to understand why execution so often falls short of the theory, our dedicated guide to index fund investing failure modes covers the behavioural and structural gaps that cause roughly 60% of new investors to exit around year six, including panic selling, missed employer matches, and the compounding cost of holding emergency cash inside an investment account.
This article is for informational purposes only and should not be considered financial advice. Investors should conduct their own research and consult with financial professionals before making investment decisions. Past performance does not guarantee future results.