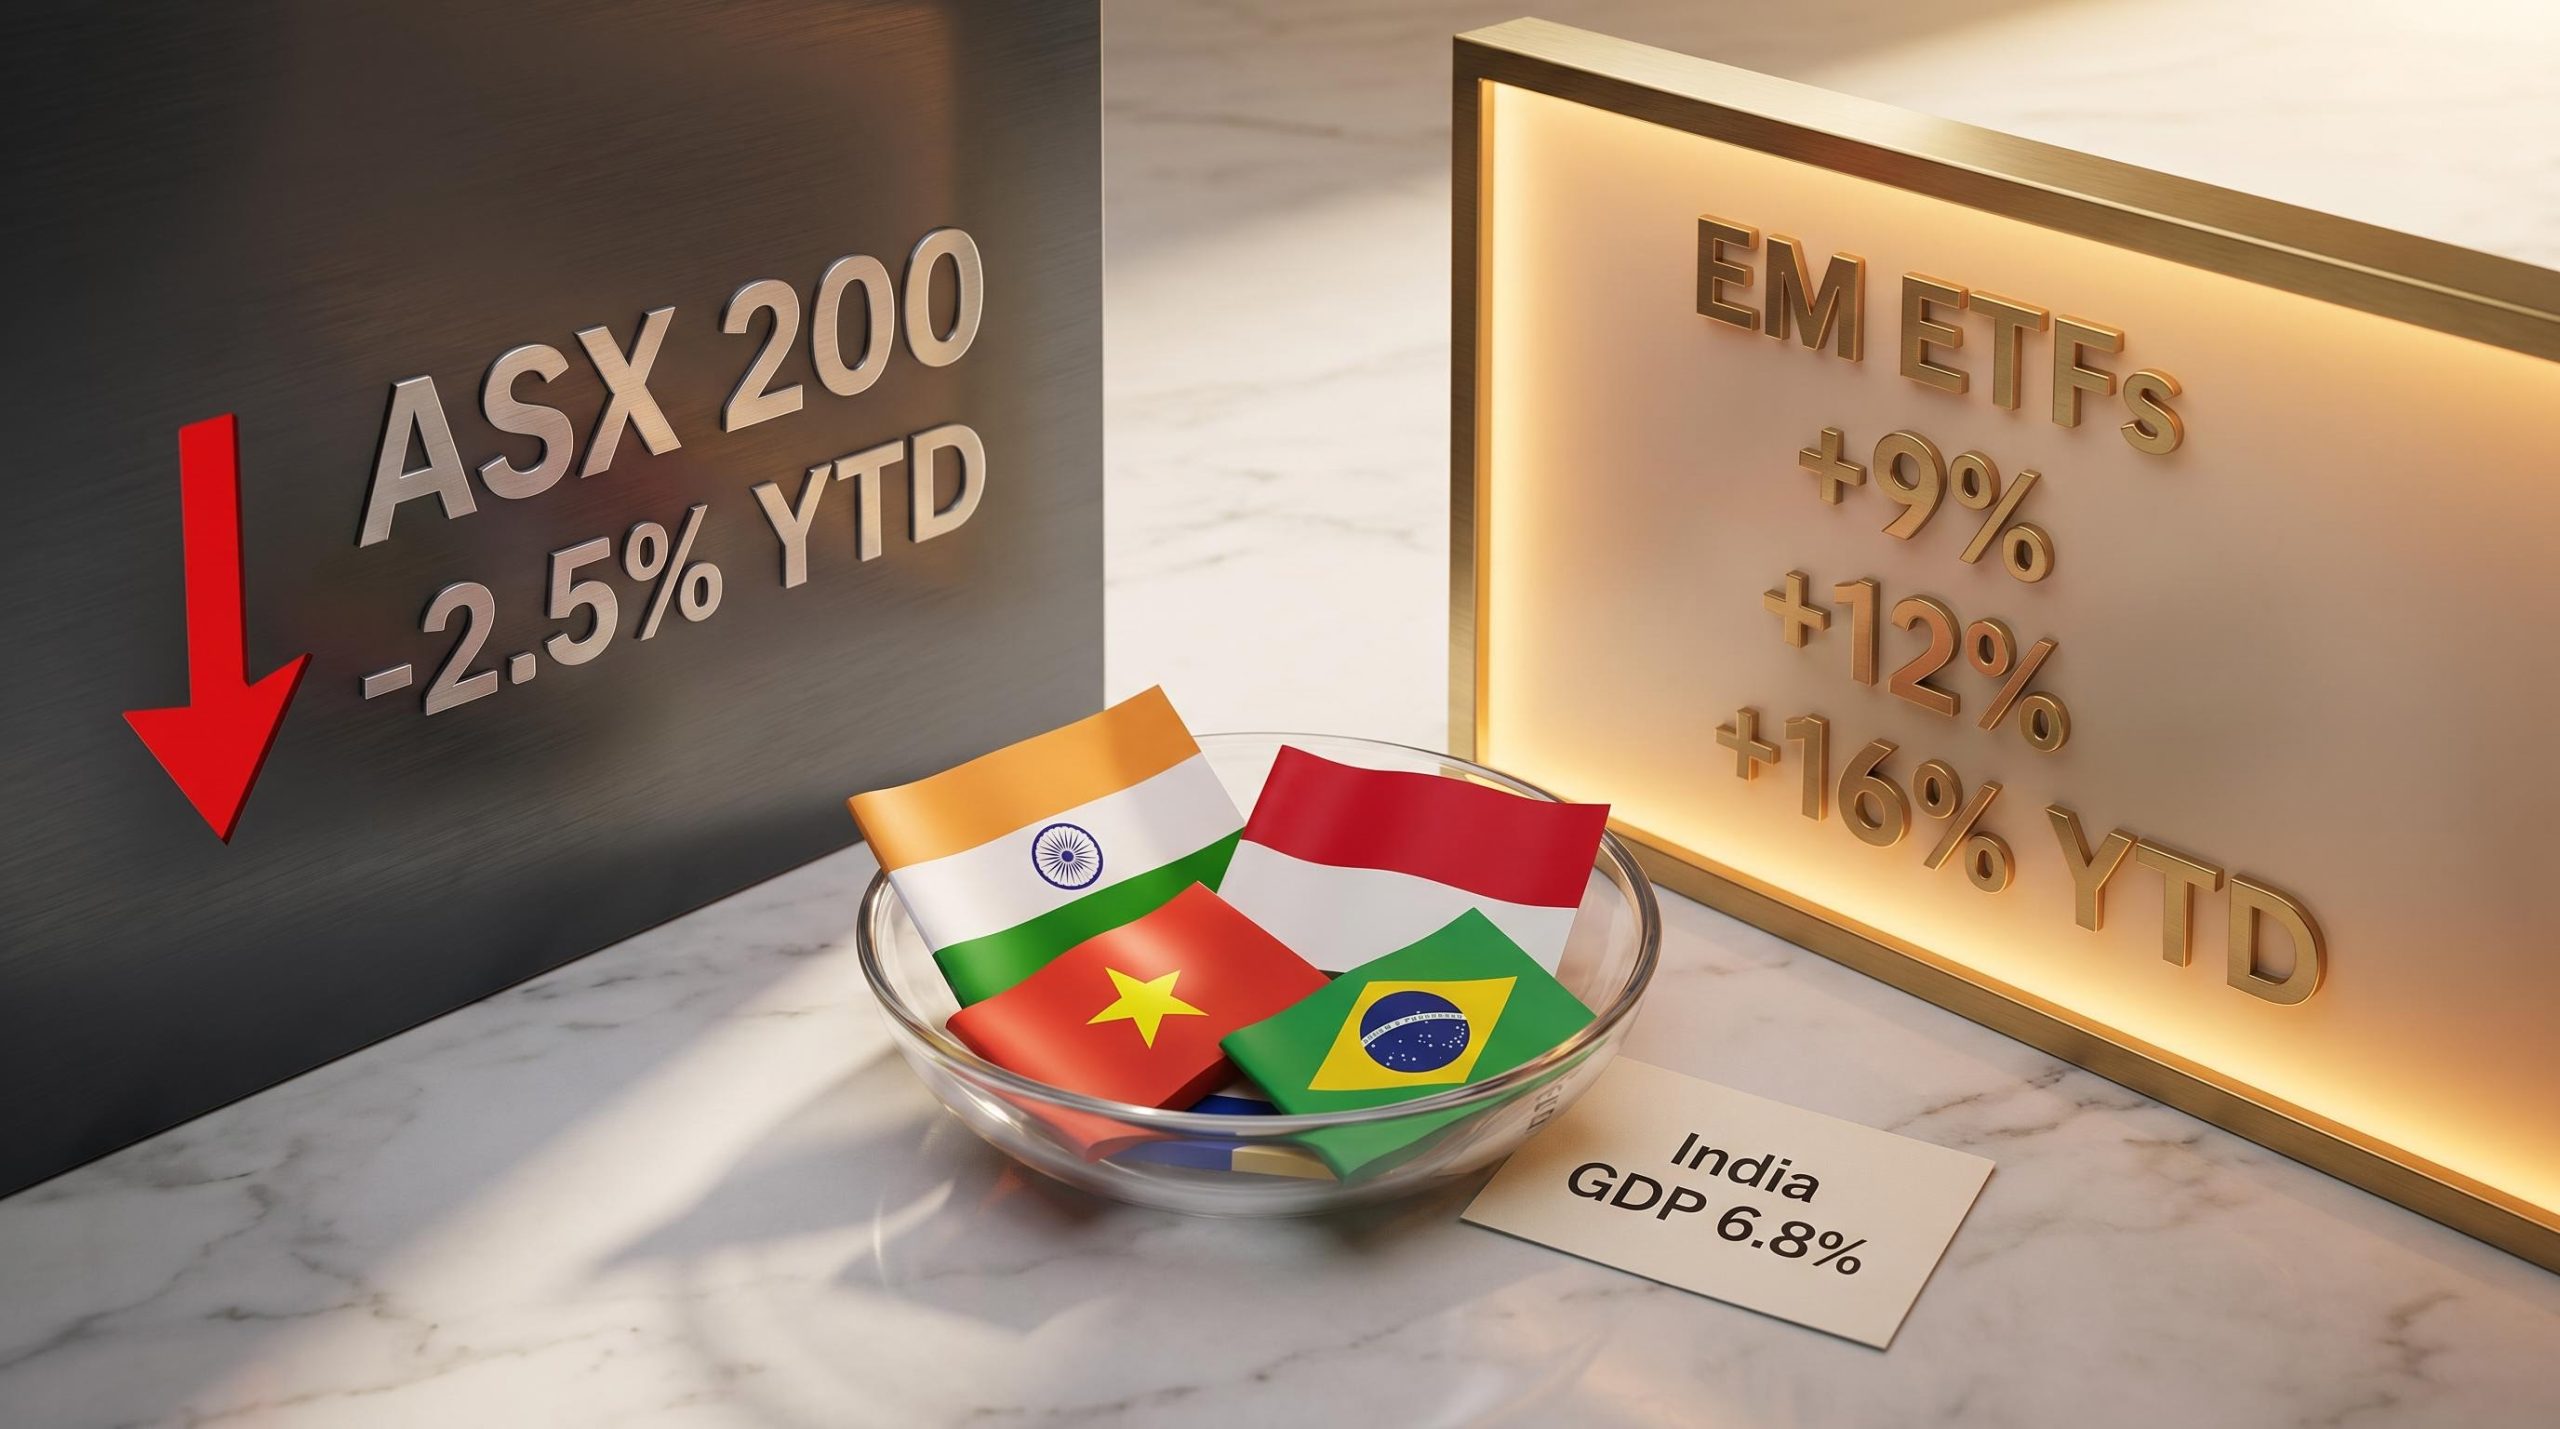
While the ASX 200 has declined roughly 2.5% year-to-date as of mid-May 2026, a basket of emerging market ETFs listed on the same exchange has returned between 9% and 16% over the same period. That performance gap raises a straightforward question: what exactly qualifies an economy as “emerging,” and should Australian investors be paying closer attention? Emerging markets span a broad and heterogeneous group of economies, from India and Vietnam to Brazil and Indonesia. For most Australian retail investors, exposure has historically been limited to whatever weighting sits inside a diversified global fund. Dedicated products are now accessible on the ASX, and the divergence from domestic equities has made the asset class harder to ignore. What follows is a breakdown of how emerging markets are classified, why they offer structurally higher growth potential, what specific risks apply, and how Australians can access the asset class through ASX-listed ETFs, including the tax obligations that come with it.
What actually makes an economy an “emerging market”
The assumption that “emerging market” is shorthand for “poor and risky” is common, but it misses what the classification actually measures. The term refers to a specific category maintained by global index providers, and the criteria are more precise than most investors realise.
Three core factors determine whether an economy earns the EM label:
- Per-capita income threshold: the economy sits below the income level associated with fully developed markets but above the threshold for frontier classification
- Market accessibility for foreign investors: foreign capital can enter and exit the country’s equity markets with reasonable, if imperfect, efficiency
- Institutional and regulatory development: financial infrastructure, legal protections, and market oversight exist but remain less mature than in markets such as Australia or the United States
Economies that meet these criteria occupy a middle ground. They are actively industrialising, building out financial systems, and expanding consumer markets, but they have not yet reached the stability or market depth of developed peers. The major EM indices are dominated by technology, financials, and consumer discretionary sectors, reflecting where corporate growth concentrates in these transitional economies.
The index providers who draw the lines
MSCI and FTSE Russell are the two gatekeepers. Each maintains its own EM classification list, and the lists differ in meaningful ways. The most notable divergence is South Korea: MSCI classifies it as an emerging market, while FTSE Russell includes it among developed economies. That single difference reshapes the country composition of any ETF tracking one index versus the other. When an investor buys an “emerging markets” fund, the underlying country mix depends entirely on which provider’s index the fund follows.
The MSCI market classification framework specifies three core criteria — economic development, size and liquidity requirements, and market accessibility — to determine whether a country is designated Developed, Emerging, or Frontier, with the 2025 review also introducing an Advanced Frontier Markets category that sits between Frontier and full EM status.
When big ASX news breaks, our subscribers know first
Why emerging markets have historically offered higher growth than developed economies
The numbers make the case before the structural explanation does. According to the IMF World Economic Outlook published in April 2026, the growth gap between the fastest emerging economies and developed markets like Australia or the United States is substantial and persistent.
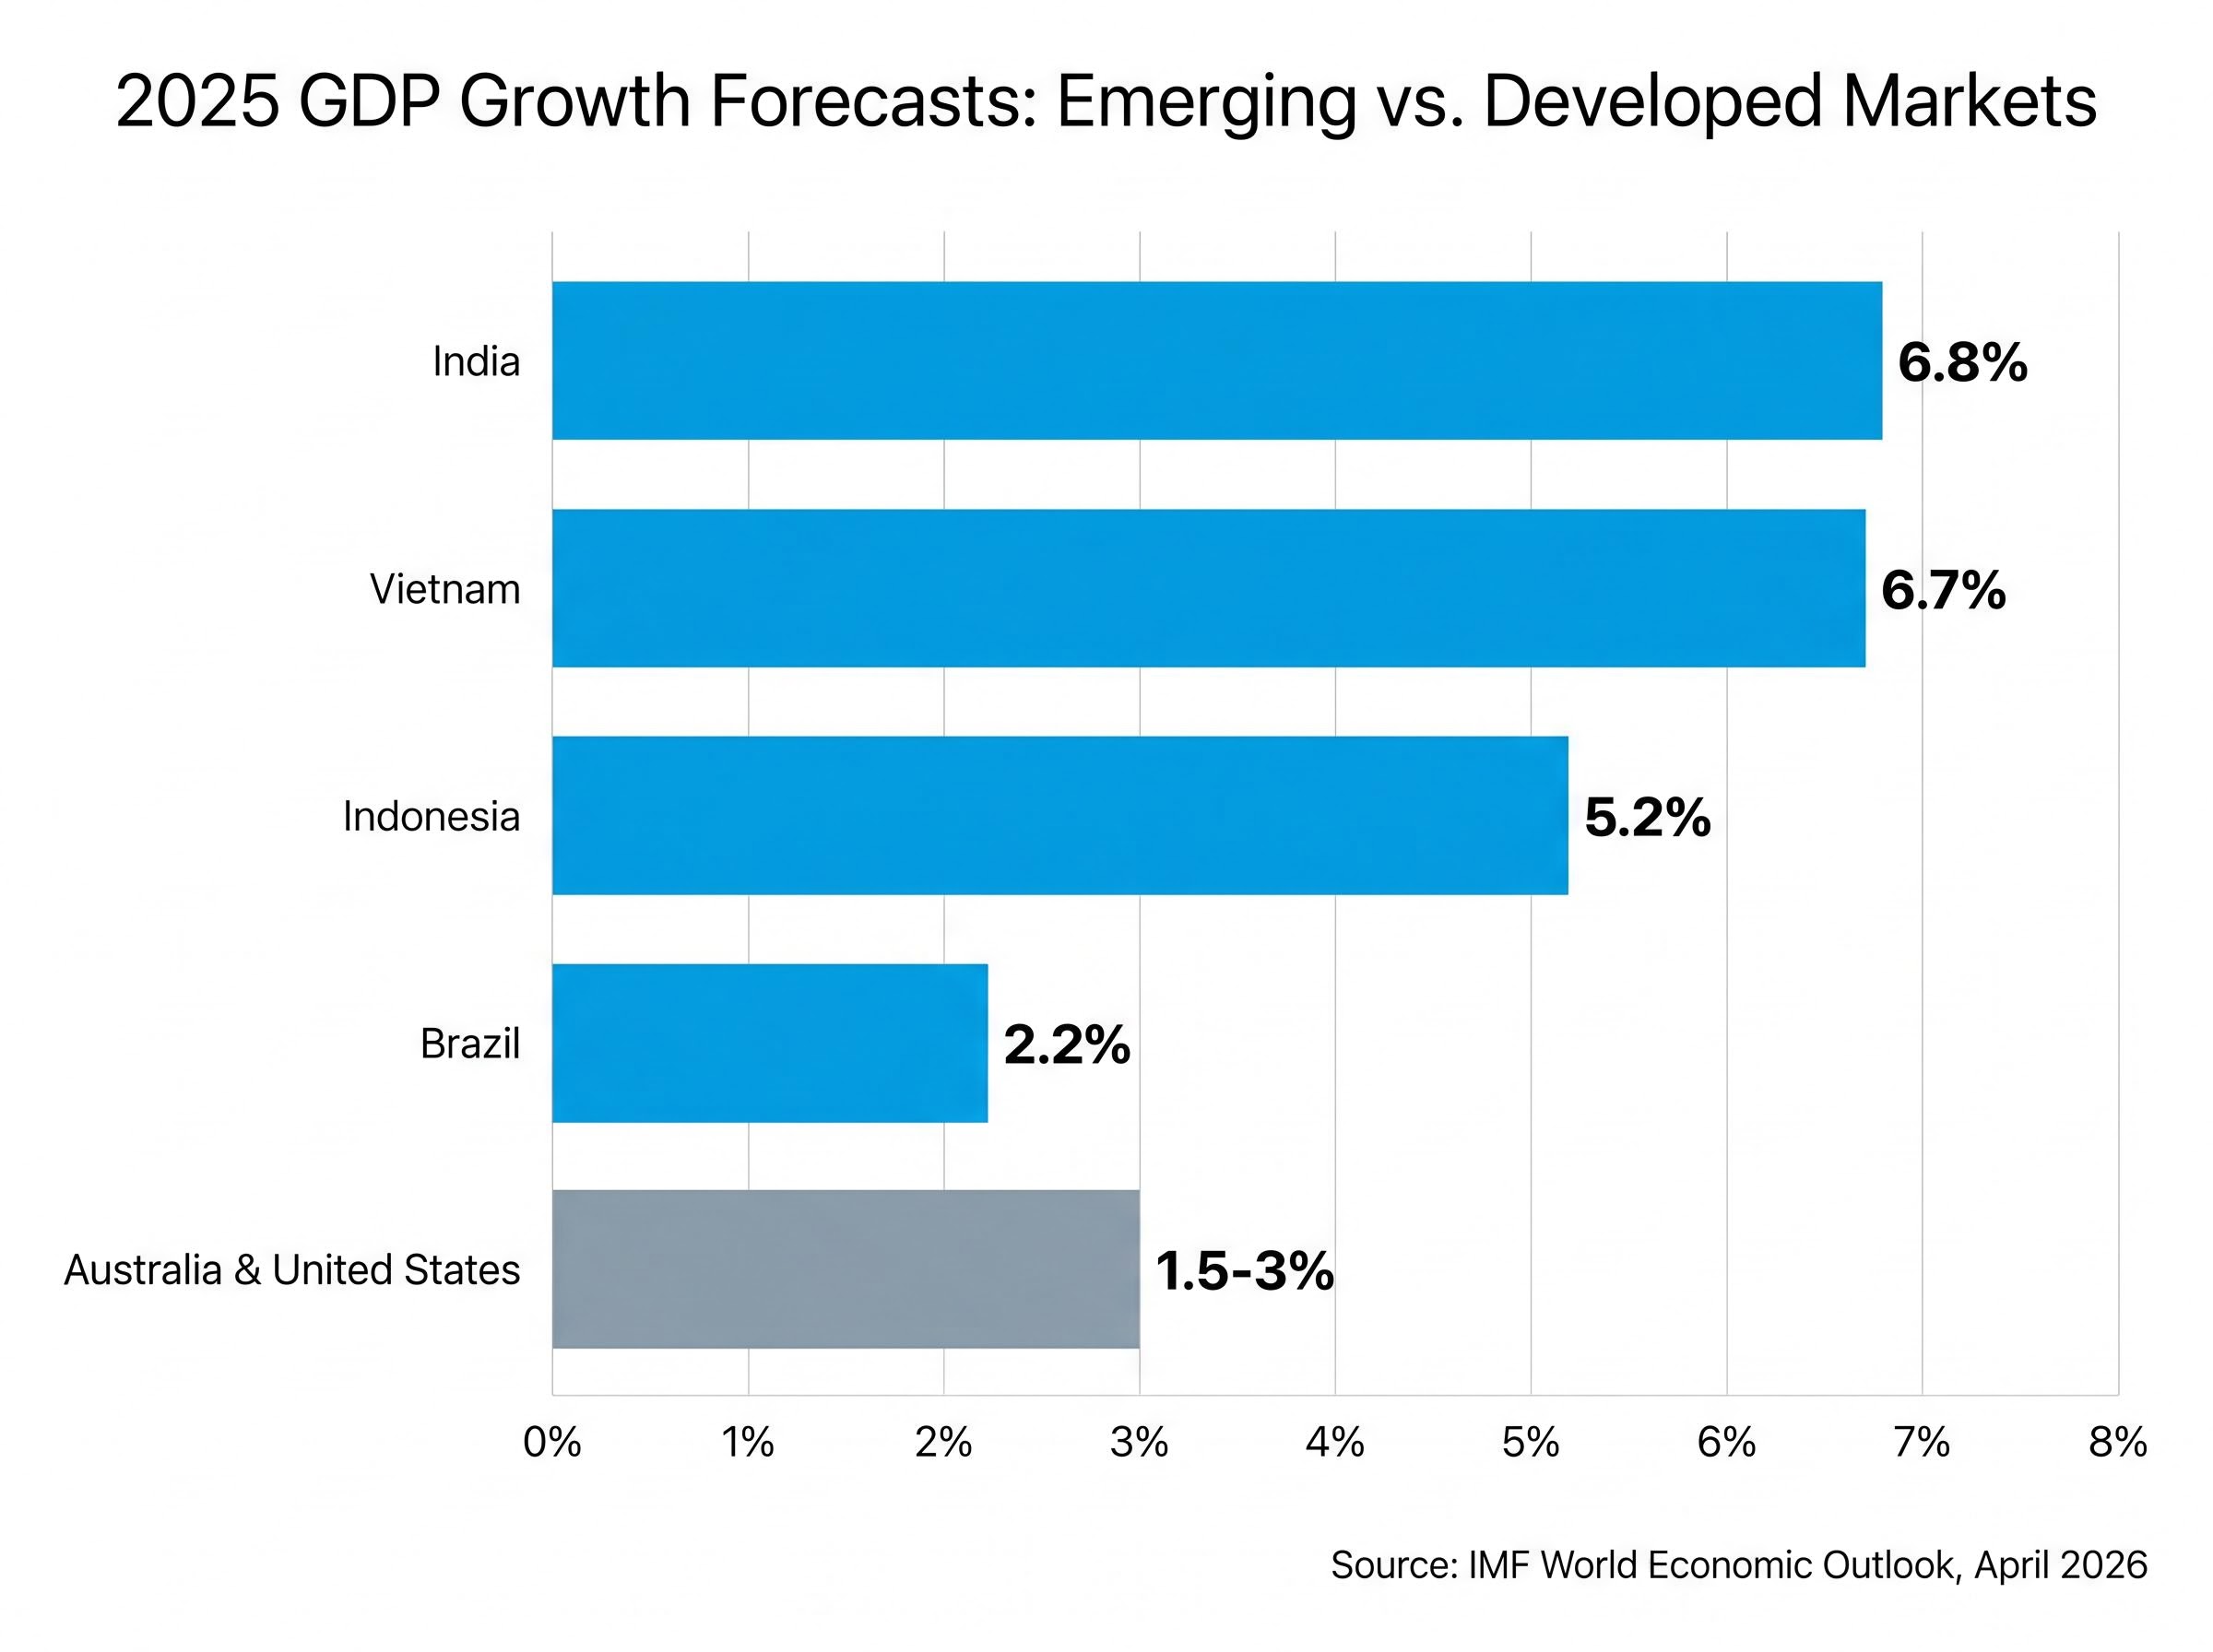
India is forecast to grow at 6.8% in FY 2025/26, the highest rate among major emerging economies tracked by the IMF.
| Country | 2025 GDP Forecast | 2026 GDP Forecast | Key Growth Driver |
|---|---|---|---|
| India | 6.8% | 6.5% | Infrastructure build-out, digitalisation, expanding middle class |
| Vietnam | 6.7% | 6.9% | Manufacturing relocation, export-driven industrialisation |
| Indonesia | 5.2% | 5.3% | Commodity revenues, domestic consumption growth |
| Brazil | 2.2% | 2.0% | Commodity exports, partially offset by fiscal headwinds |
Australia and the United States typically grow at 1.5-3% over the same period. The gap is not cyclical. It reflects structural forces: demographic expansion in economies where the working-age population is growing rather than ageing, a rising middle class purchasing goods and services for the first time, and large-scale government infrastructure investment funded by both domestic revenue and foreign capital.
Not all emerging markets grow equally. India and Vietnam sit at the top of the pack; Brazil trails significantly, weighed down by what the World Bank’s Global Economic Prospects report identifies as fiscal challenges and political uncertainty. The EM label covers a wide spread of outcomes, and investors selecting EM funds benefit from understanding which end of that spread their fund favours.
Brazil’s commodity-driven outperformance is one of the sharper illustrations of how EM outcomes diverge within a single index: the Ibovespa gained roughly 23% year-to-date through April 2026, powered by net oil-exporter status and record foreign inflows, while the country still trails India and Vietnam on GDP growth forecasts.
Higher GDP growth does not automatically translate into higher equity returns. But it creates the corporate earnings environment in which equity gains become possible, and it is the reason EM allocations exist in diversified portfolios at all.
The risks that make emerging markets genuinely different from developed market investing
The risks attached to emerging market investing are not simply amplified versions of familiar developed-market hazards. They include qualitatively different dynamics that interact in ways Australian equity investors rarely encounter domestically.
Four categories capture the bulk of the risk:
- Political and regulatory risk: governments may change policy frameworks abruptly, restrict foreign ownership, or impose capital controls. Brazil’s fiscal challenges and India’s electoral dynamics both illustrate how political cycles can shift investor confidence in ways that have no close equivalent on the ASX.
- Currency volatility: EM currencies can move sharply against the Australian dollar, and this movement compounds underneath the equity return.
- Liquidity and capital flow risk: the IMF’s April 2026 Global Financial Stability Report flags that non-bank capital flows now dominate EM financing and can reverse rapidly when global risk appetite shifts. This creates a systemic vulnerability: money that arrived quickly can leave just as fast.
- Geopolitical and commodity price exposure: the Iran conflict and Strait of Hormuz disruption have illustrated in real time how external shocks translate directly into EM volatility, lifting energy costs for import-dependent economies and disrupting trade routes.
The BlackRock Investment Institute cautioned in its 2026 market commentary that a prolonged Hormuz closure would “lift inflation and rates” and weigh on EM valuations, even as EM hard-currency debt has remained broadly supported through the disruption so far.
These risks compound. A political shock can trigger capital outflows, which weaken the currency, which raises import costs, which lifts inflation, which forces central banks into rate increases that suppress equity valuations. That chain reaction, rather than any single risk in isolation, is what distinguishes an EM drawdown from a bad quarter on the ASX.
Geopolitical fragmentation has become a structural portfolio variable rather than an episodic one, with regional equity returns diverging by more than 30 percentage points over the 12 months to early May 2026 as industrial policy, trade blocs, and capital controls create separately investable economic zones that EM indices are still designed as if do not exist.
Currency risk is not optional for most Australian EM investors
The major ASX-listed EM ETFs, including IEM, EMKT, BEMG, and VGE, are offered in unhedged form. Australian investors therefore carry a compounded exposure: the underlying EM equity movement plus EM currency movements against the AUD. AUD-hedged ASX-listed EM equity ETF options remain limited within the current product set. ASIC’s MoneySmart platform notes that exchange-rate movements can increase volatility and affect returns for overseas investments, a warning that applies directly to every unhedged EM position.
How Australian investors can access emerging markets through the ASX
Three ASX-listed ETFs represent the primary access points for Australian retail investors seeking dedicated EM exposure. Each tracks a different index and carries a different country composition, making fund selection a genuine portfolio decision rather than a formality.
| Fund Code | Index Tracked | Top Country Weights | YTD Return (mid-May 2026) | China Exposure |
|---|---|---|---|---|
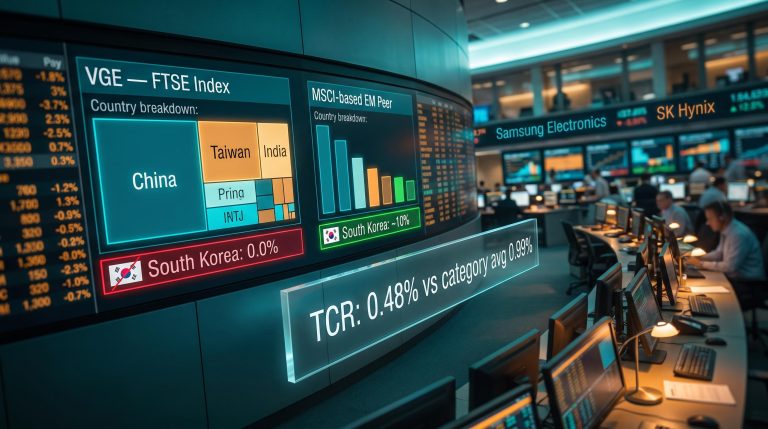
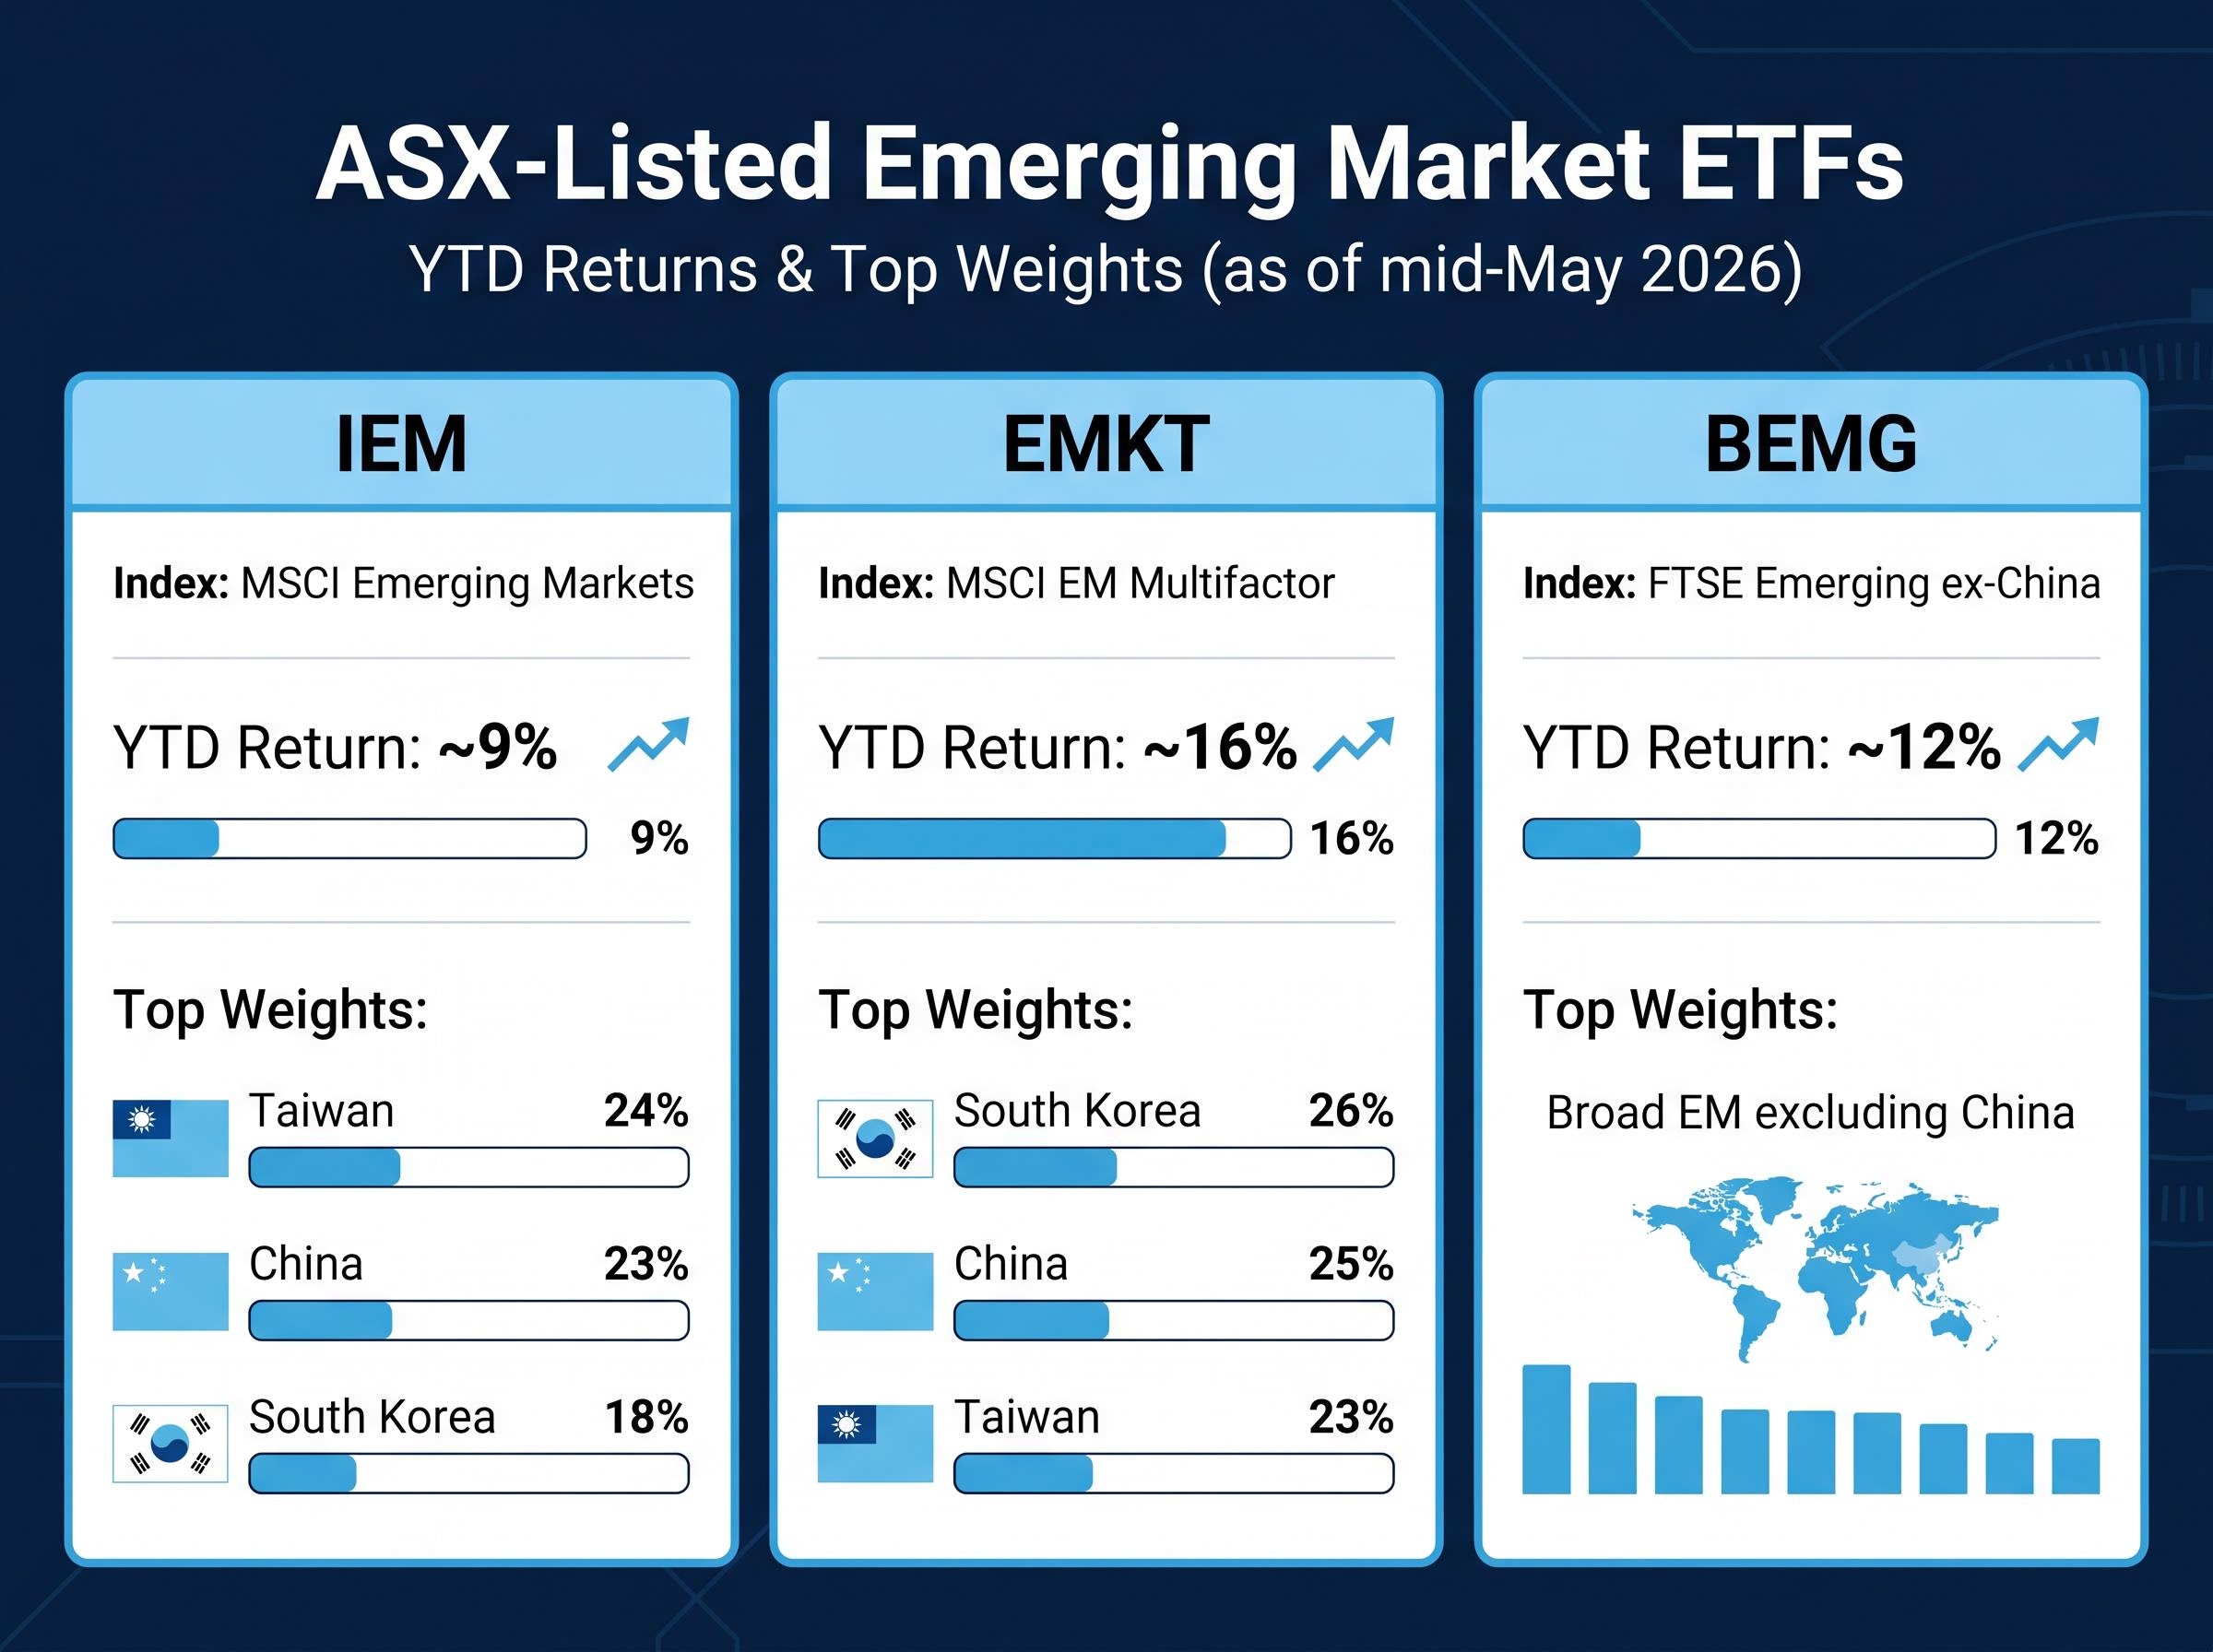
| IEM | MSCI Emerging Markets | Taiwan 24%, China 23%, South Korea 18% | ~9% | Yes |
| EMKT | MSCI EM Multifactor | South Korea 26%, China 25%, Taiwan 23% | ~16% | Yes |
| BEMG | FTSE Emerging ex-China | Broad EM excluding China; 1,000+ stocks across 20+ countries | ~12% | Excluded |
The structural difference between BEMG and the other two funds is the most consequential decision point. BEMG excludes China entirely, meaning investors who hold concerns about China’s property sector overhang, regulatory tightening, or geopolitical risk can access emerging markets without that exposure. IEM and EMKT, by contrast, hold China and Taiwan as their two largest weightings, making them substantially more concentrated in North Asian technology and financials.
China ETF exposure on the ASX involves a structural constraint that index-level data does not surface: Chinese companies are legally required to prioritise central government directives over shareholder interests, a consideration that sits inside every IEM and EMKT position given China’s 23-25% weighting in both funds.
EMKT has delivered the strongest year-to-date return at approximately 16%, alongside a trailing twelve-month return of roughly 33%. It holds approximately 220 stocks with a technology sector weighting of around one-third of the portfolio. BEMG offers the broadest diversification across more than 1,000 stocks.
All three funds have meaningfully outperformed the ASX 200 in 2026 to date. That outperformance is worth noting but should not be the basis for an allocation decision on its own; recent performance does not define long-run risk-adjusted outcomes.
What the MSCI and its numbers do not tell you about emerging markets
Index-level statistics and year-to-date returns can create a misleading sense of smoothness. The path to those returns often includes periods of sharp drawdown that test investor conviction.
Consider the concentration embedded in the largest EM funds. IEM’s top three country weights, Taiwan at 24%, China at 23%, and South Korea at 18%, combine to represent 65% of the portfolio. EMKT allocates roughly one-third of its holdings to the technology sector. In practical terms, a broad “emerging markets” ETF often behaves more like an Asian technology position than a diversified exposure to developing economies around the world.
The IMF’s April 2026 Global Financial Stability Report identifies China’s property sector stress and tighter financial conditions as an ongoing systemic concern, one that sits inside the largest single country weight of most EM indices.
BlackRock’s Investment Institute maintains an overweight position on EM equities and EM hard-currency debt as of 2026, but cautions that prolonged external shocks would weigh on valuations. The case for EM outperformance over developed markets is strongest when measured over long periods of 10 years or more, not over 12-month windows.
Before committing capital to an EM ETF, three practical checks are worth completing:
- Review the country concentration in the fund’s top holdings to understand what the portfolio is actually exposed to
- Confirm the intended holding horizon is at least 5-10 years, long enough to absorb drawdown cycles without forcing a sale at the worst moment
- Check whether the fund is hedged or unhedged relative to AUD, and understand the implications for total return volatility
The next major ASX story will hit our subscribers first
Tax and reporting obligations Australian investors need to know
The tax treatment of EM ETF income is more complex than holding domestic equities, but the framework is manageable with basic preparation.
The ATO requires that Australian residents declare all income from overseas investments, including dividends, distributions, and capital gains, even if that income is reinvested or held offshore.
Most emerging market countries impose withholding tax on dividends paid to foreign investors. Australian investors in EM ETFs typically receive income net of this foreign tax. The primary tool for managing the resulting double-taxation is the Foreign Income Tax Offset (FITO), which allows Australian residents to claim a credit for foreign tax paid against their Australian tax liability, subject to conditions and caps outlined in ATO guidance (last modified 2024).
Record-keeping requirements are the area most likely to catch investors off guard. Three steps form the baseline:
- Declare all foreign income, including ETF distributions, in the Australian tax return for each income year
- Calculate the FITO for any withholding tax paid by the underlying fund on foreign-sourced dividends
- Maintain records of foreign income received, foreign tax withheld, and any ETF restructure events that may trigger capital gains
ASIC’s MoneySmart platform notes that exchange-rate movements affect returns on overseas investments, which is also relevant to cost-base calculations for capital gains purposes. Given the multi-jurisdiction complexity, seeking advice from a tax professional familiar with foreign investment income is a practical step, particularly for investors holding multiple EM funds or receiving distributions across several income years.
For investors wanting to model the after-tax impact of holding EM ETFs across different time horizons, our full explainer on Australia’s CGT changes for ETF investors walks through the replacement of the 50% discount with inflation indexation and a 30% minimum tax floor from 1 July 2027, including how asset location across superannuation and personal accounts affects the net outcome.
This article is for informational purposes only and should not be considered financial advice. Investors should conduct their own research and consult with financial professionals before making investment decisions. Past performance does not guarantee future results.
Strong recent returns are the start of the story, not the end of it
The 9-16% year-to-date returns delivered by ASX-listed EM ETFs in 2026 have earned the asset class attention it has not received from Australian retail investors in some time. That attention is warranted. The structural growth case, underpinned by demographic expansion and rising consumer markets in economies like India, Vietnam, and Indonesia, remains intact.
The returns, however, are not the argument. The argument is whether an investor understands what they are buying and is prepared for the holding period that EM investing demands. Before allocating capital, three things matter: understanding the index composition and country concentration inside any fund purchased, confirming a holding horizon long enough to absorb the drawdown cycles that are a feature of the asset class rather than a flaw, and reviewing the tax implications with a qualified adviser.
Emerging market investing fits most naturally as a component of a diversified international equities allocation rather than a standalone portfolio strategy. The recent performance gap with the ASX 200 makes the case for attention. What the investor does with that attention, the homework, the time horizon, and the risk tolerance, determines whether the allocation endures.