Delivery Hero Shareholders Reject Uber’s €33 Bid, Demand €40+
1 hr ago

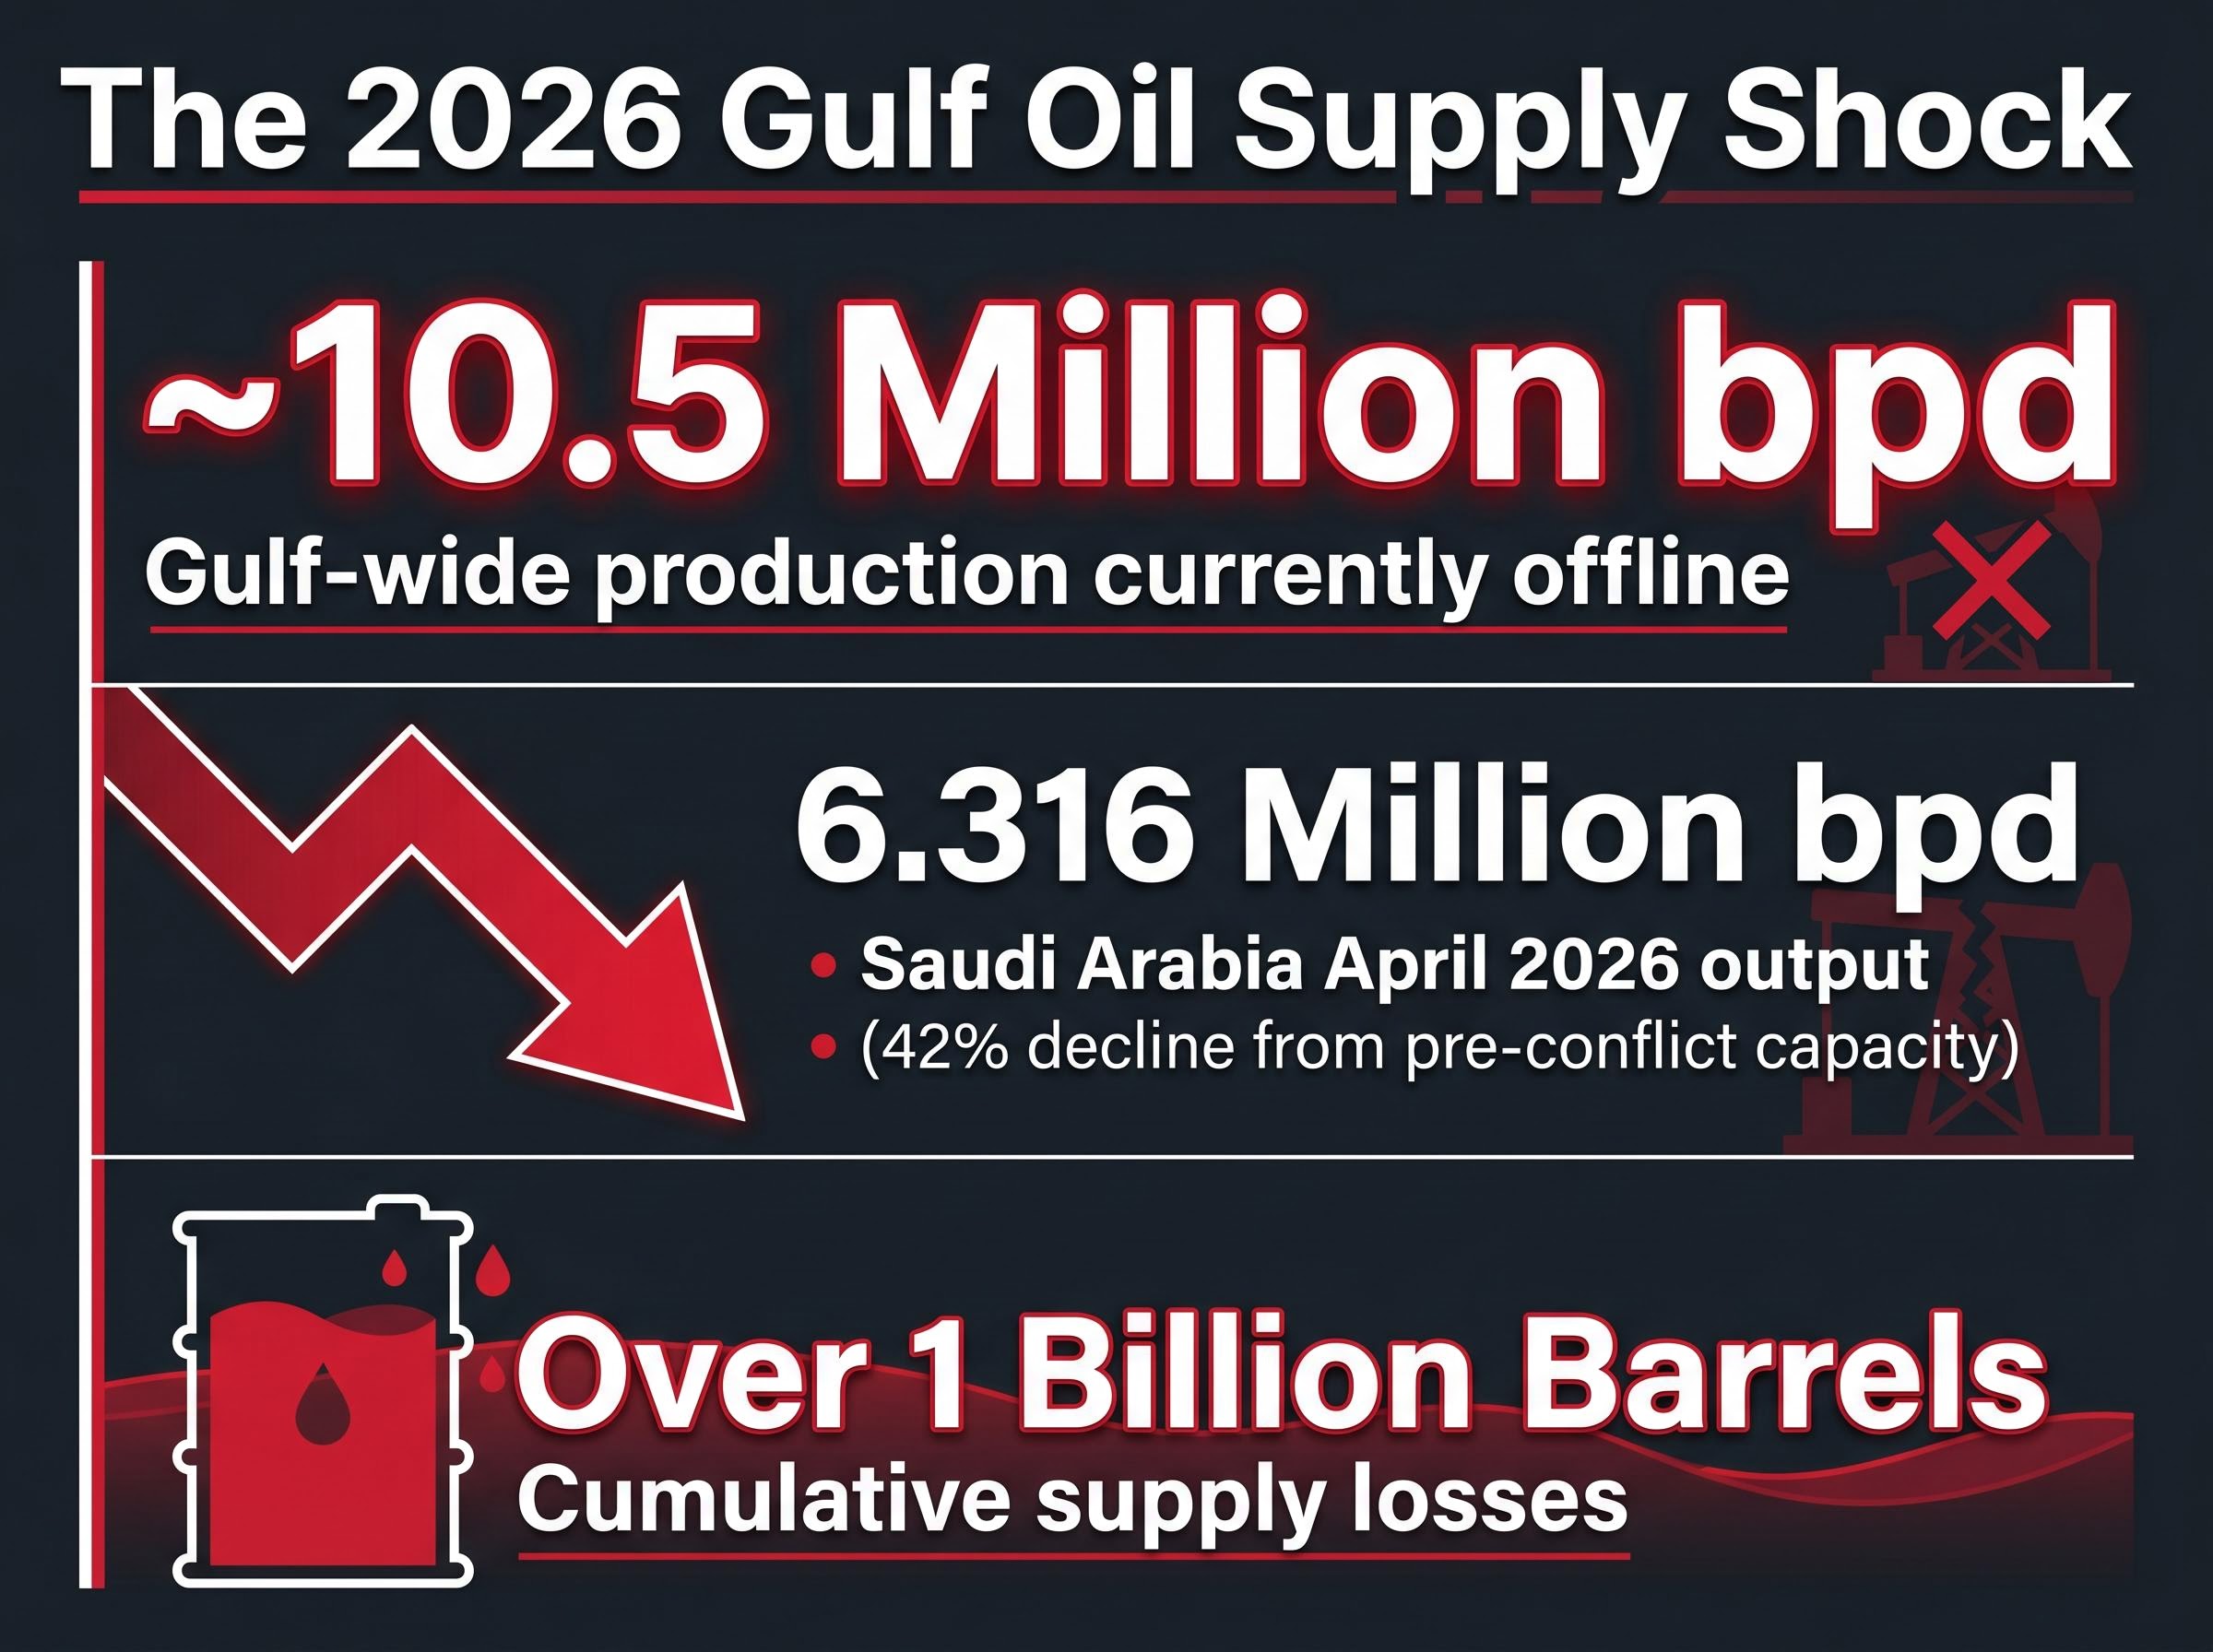
Saudi Arabia’s crude output fell to 6.316 million barrels per day in April 2026, its lowest level since 1990 and a 42% contraction from pre-conflict production. The figure is not a forecast or a projection. It is a reading from the world’s most important swing producer, and it captures, in a single data point, the scale of damage the Iran conflict has inflicted on global oil supply. With roughly 10.5 million barrels per day of Gulf production now offline, cumulative losses exceeding 1 billion barrels, and global inventories drawing at a rate the International Energy Agency (IEA) puts at 8.5 million barrels per day in Q2 2026, the supply shock is structural, not episodic. WTI crude is trading at approximately $101 per barrel and Brent near $107. This analysis traces how the disruption is transmitting through commodity markets, into US inflation data, and now into Federal Reserve policy expectations, and what the credible range of outcomes looks like from here.
Before the conflict, the Gulf’s production infrastructure supplied a substantial share of global crude. The after picture is stark.
Approximately 10.5 million barrels per day of Gulf oil production is currently offline. Cumulative supply losses have exceeded 1 billion barrels. Total OPEC output for April 2026 came in at 18.98 million bpd, down 1.727 million bpd from prior levels.
Saudi crude output fell to 6.316 million bpd in April 2026, its lowest level since 1990 and a 42% contraction since the conflict began.
Three discrete disruptions define the damage:
The Kharg Island halt represents a discrete escalation. Iran’s primary crude export terminal going dark compounds the inventory deficit that is already accelerating beneath the headline price. Each week of continued silence at Kharg widens the gap between what global refineries need and what is physically available for loading.
The structural deficit is large. The acute deficit is larger.
The IEA projects global oil supply will fall short of demand by 1.78 million barrels per day across the full year of 2026. That is the annual average. The quarterly picture is more severe: inventories are drawing at 8.5 million barrels per day in Q2 2026, with the steepest draws concentrated in May and June. For context, the IEA characterised the March and April draw rate of 4 million bpd as record pace. Q2 has more than doubled it.
| Metric | Value | Timeframe |
|---|---|---|
| IEA supply deficit | 1.78 million bpd | Full-year 2026 |
| Q2 inventory draw rate | 8.5 mb/d | Q2 2026 |
| Global inventories | ~98 days of demand (8-year low) | End of May 2026 estimate |
| Usable buffer (JPMorgan) | ~800 million barrels | May 2026 |
| OPEC spare capacity | ~0.5 million bpd | 2026 |
Global inventories are approaching approximately 98 days of demand by end of May, an eight-year low. But that headline figure overstates what is actually accessible.
Floating storage, crude held on tankers at sea, can be tapped and redirected quickly. Onshore inventories face logistical constraints: pipeline scheduling, refinery intake capacity, and regional distribution bottlenecks all limit how fast barrels move from storage to consumption.
JPMorgan estimates only approximately 800 million barrels of global inventory are realistically usable without triggering operational system stress. OPEC’s spare capacity of roughly 0.5 million bpd provides negligible offset against disruptions measured in the millions. The distinction between gross and operationally accessible inventory is the number that matters for price, and it reframes why WTI at $101 is not yet a ceiling.
Every tool that markets typically reach for in a supply crisis has been opened. The deficit persists.
The sequence of the emergency response is worth tracking in order:
Even with 280 million barrels already released from IEA reserves, global inventories continue to draw at record rates.
The US SPR stood at 384.1 million barrels as of 8 May 2026. Further large releases reduce the strategic cushion available for future shocks, a trade-off that constrains the pace of additional drawdowns regardless of current market pressure.
The EIA Strategic Petroleum Reserve inventory data, which places current SPR holdings at 384.1 million barrels as of 8 May 2026, underscores how successive large releases have reduced the strategic buffer available for any future supply shock beyond the current crisis.
US domestic production offers no structural relief either. Producers are prioritising capital discipline over volume growth, a structural shift from prior boom cycles. Shale ramp-up potential is limited in the near term, and the current output plateau cannot substitute for Gulf volumes of this magnitude. OPEC spare capacity of approximately 0.5 million bpd is negligible at this scale.
The toolkit has been opened, is being actively used, and inventories are still falling at historic rates. Investors relying on the assumption that SPR releases cap prices need to recalibrate for this cycle.
The triple-lock closure mechanism combining US naval blockade operations, Iranian toll enforcement, and the near-total collapse of commercial war risk insurance means that even a ceasefire announcement cannot reopen commercial traffic immediately, because insurers require a sustained period of incident-free passages before restoring coverage.
The transmission chain from commodity price to household cost is already visible in the data.
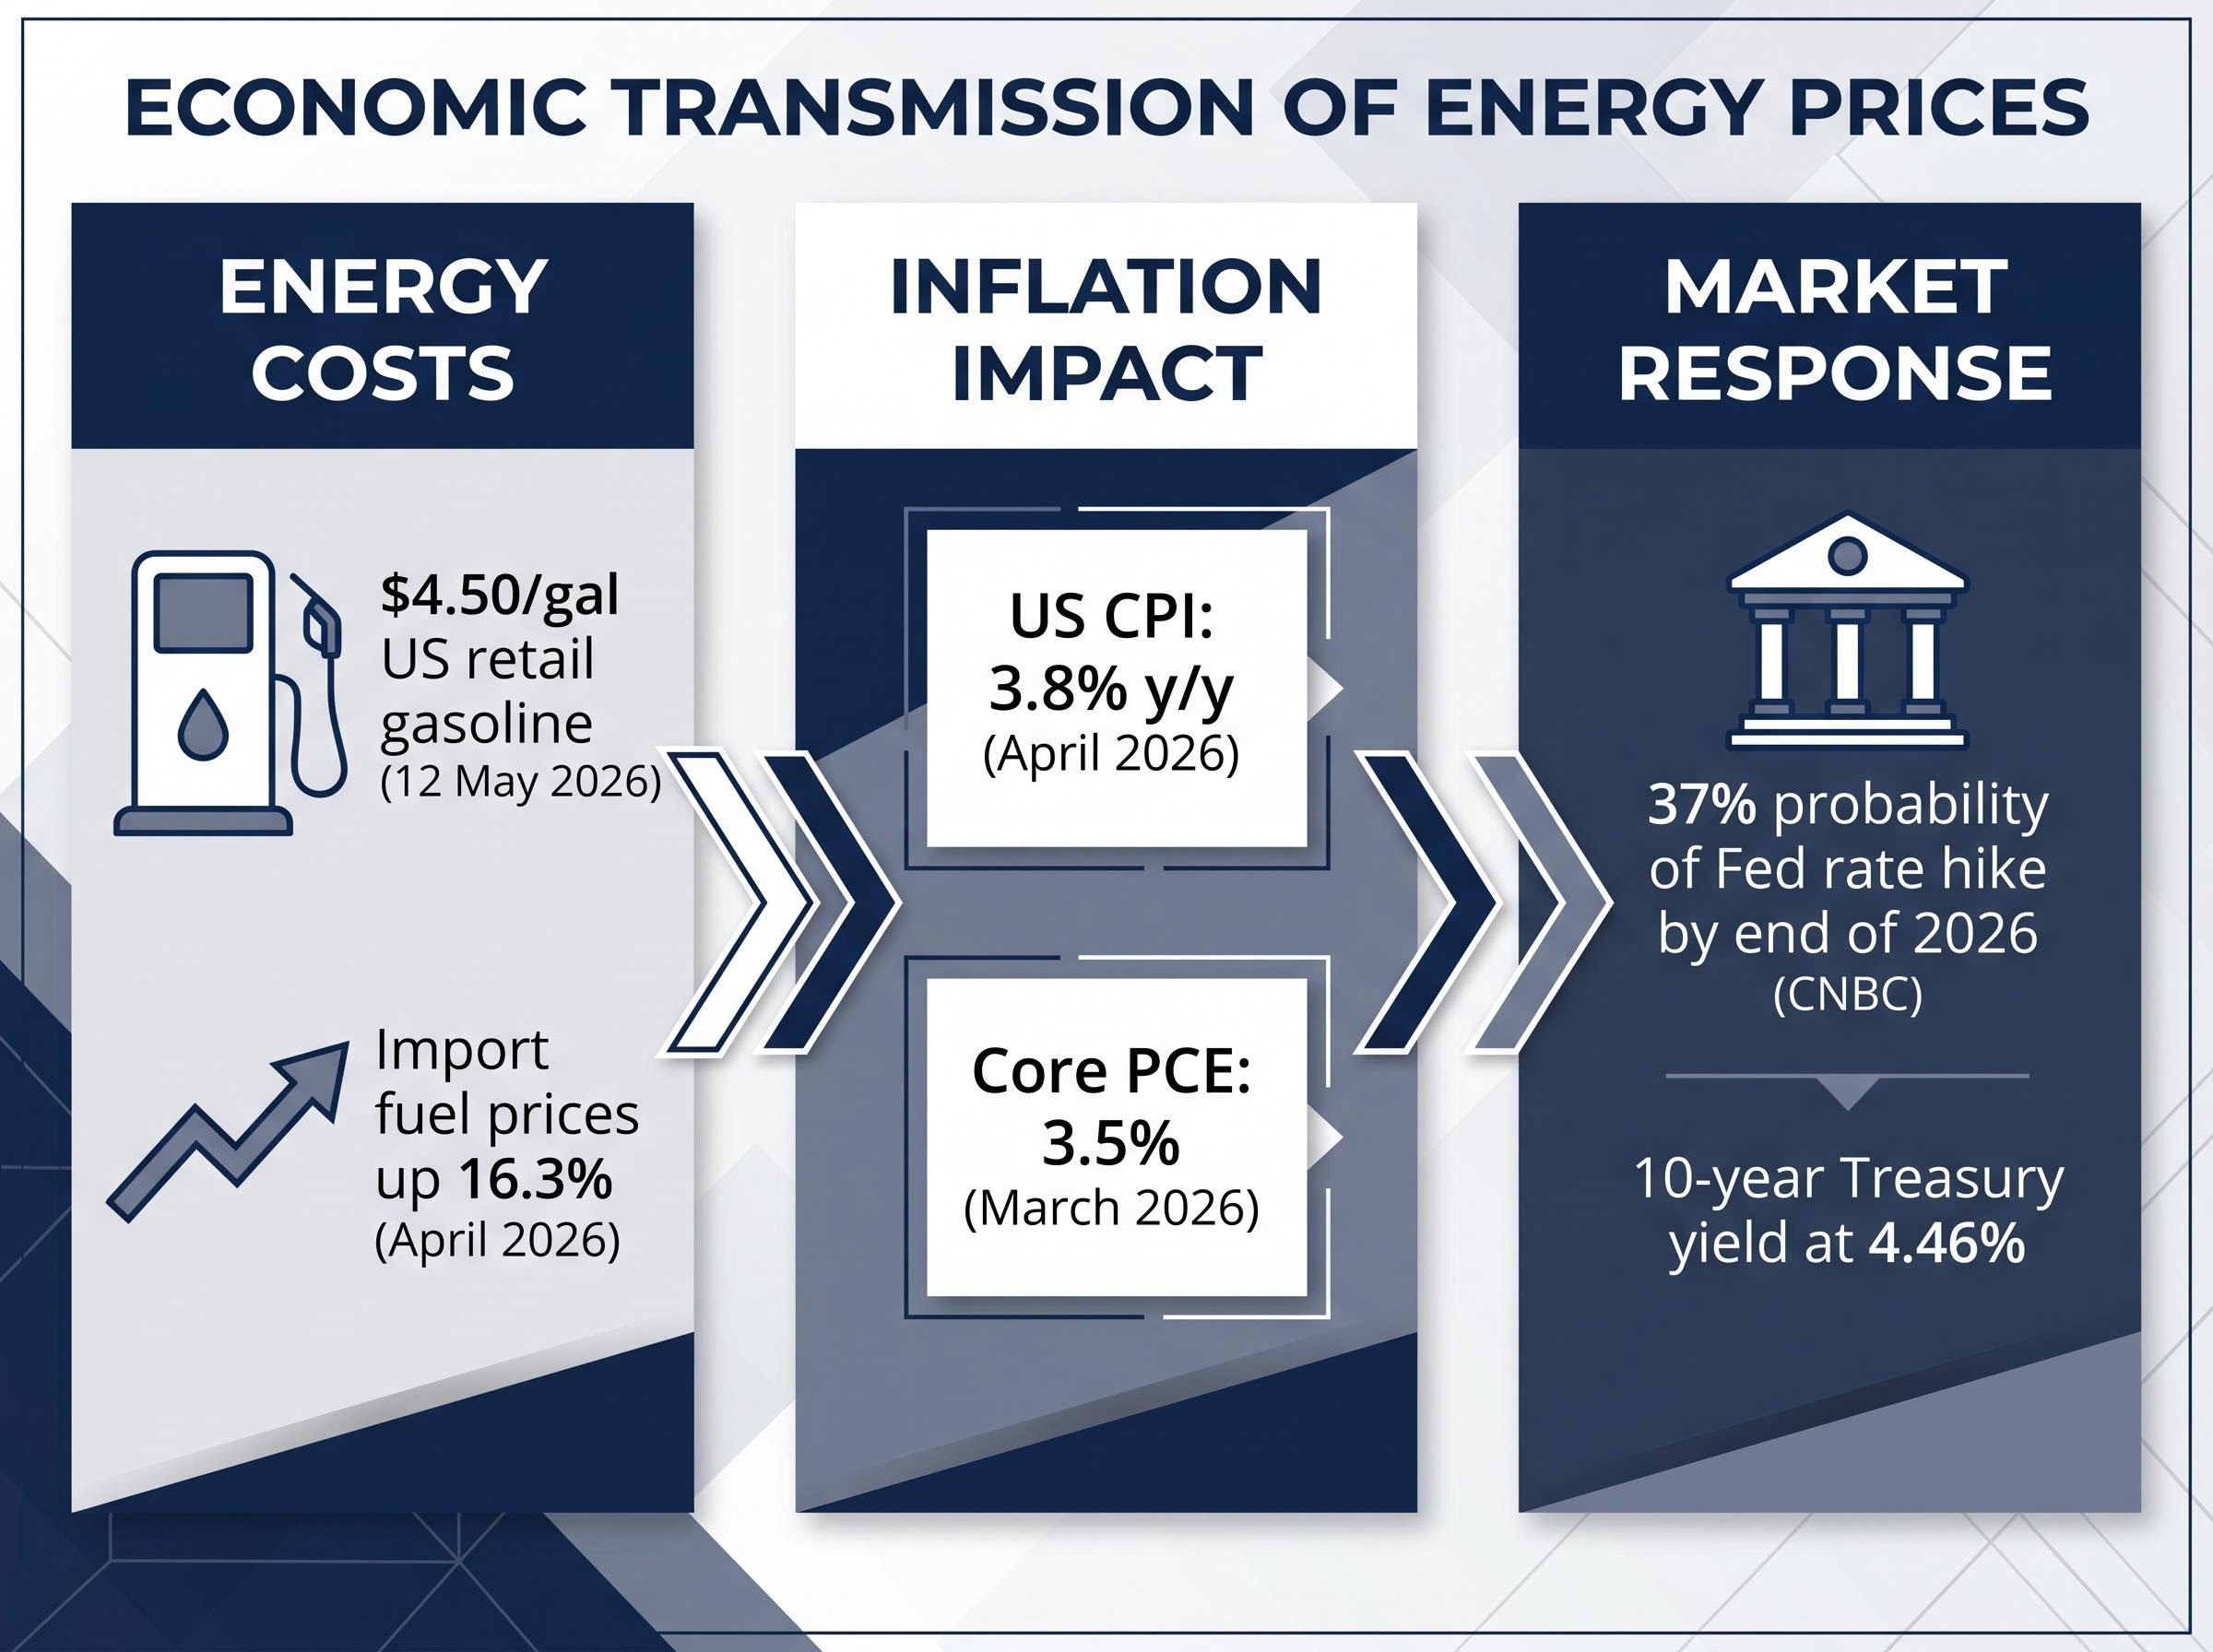
US retail gasoline averaged $4.50 per gallon as of 12 May 2026, according to EIA data. Import fuel prices rose 16.3% in April 2026. These are the proximate channels through which energy costs enter the consumer price index.
The inflation readings that the Federal Reserve is currently working with:
April retail sales rose 0.5% month-over-month and 4.9% year-over-year, with gasoline retail sales specifically up 2.8% in April. Consumers are absorbing the higher prices rather than retreating from spending.
Oil-driven CPI transmission operates with a lag of 3-6 months across freight, food, and petrochemical cost categories, which means the April CPI print of 3.8% reflects crude price levels from January and February, not the $100-plus prices that have prevailed since late April.
Fed officials have characterised recent energy shocks as contributing to near-term inflation but have maintained they are likely to remain transitory in core measures, provided they do not pass through into wages, expectations, shelter, and transport costs.
The persistence and scale of this shock complicates that framing. Fed official Jeffrey Schmid has identified persistent inflation as the foremost risk. The 10-year Treasury yield sits at 4.46%, approaching its 4.48% year-to-date high, a signal that bond markets are repricing duration risk around inflation persistence. According to CNBC, markets are pricing approximately 37% probability of a Fed rate hike by end of 2026, a figure that rose following the latest inflation report.
Reporting on market pricing of Fed rate hike probability shows that the 37% end-of-2026 hike odds are not a static figure; they have risen with each inflation print that exceeded expectations, and analysts note markets are growing increasingly anxious about upside risks to inflation driven by the oil price spike.
One variable governs the entire forward price distribution: when the Strait of Hormuz reopens to normal traffic.
Even an immediate ceasefire would not restore market balance until at least October 2026, according to the IEA.
That October estimate is the floor case, not the pessimistic case. It assumes hostilities end immediately and infrastructure recovery begins without delay. The scenario matrix makes the branching logic clear.
| Source | Scenario | Brent Forecast | Key Assumption |
|---|---|---|---|
| World Bank | Baseline (disruptions ease) | $86/bbl avg 2026 | Acute disruptions ease by May; Hormuz returns gradually by late 2026 |
| IEA | Persistent deficit | ~$106/bbl | Supply deficit of 1.78 million bpd persists through 2026 |
| World Bank | Stress (slower recovery) | $115/bbl avg 2026 | More severe infrastructure damage; slower export recovery |
| JPMorgan / Analysts | Extreme upside | >$150/bbl | Hormuz remains closed through June |
The spread between $86 and $150-plus is entirely a function of one geopolitical variable. Some diplomatic movement has emerged: Chinese vessels were allowed passage through the Strait following Trump-Xi summit discussions, suggesting tentative progress. No confirmed ceasefire or full restoration of flows has followed. Brent peaked at approximately $126 per barrel in April 2026 before pulling back; the current $107 level sits closer to the IEA’s persistent-deficit modelling than to either the World Bank baseline or stress scenario.
Investors wanting to stress-test the scenario table against a broader set of institutional projections will find our full explainer on institutional oil price forecasts, which maps EIA, Goldman Sachs, and JPMorgan estimates across reopening and prolonged closure scenarios through 2027, including the pipeline bypass capacity constraints that limit alternative routing even if tanker traffic partially restores.
The preceding analysis distils into seven variables. Each carries a current read and a directional implication. Investors can assign their own probability weights.
Of these, US production discipline and demand destruction are the two variables that could suppress prices without a Hormuz resolution. Both have structural limitations at current price levels.
Oil-driven CPI persistence raises the probability of a rate hike rather than a cut, tightening financial conditions precisely when corporates are already managing elevated input costs. The 10-year Treasury at 4.46% and the 37% hike probability represent the market’s current embedded assumption. Each CPI print that lands above expectations shifts both numbers higher, compressing equity valuations and widening credit spreads. The feedback loop is active: higher oil drives higher CPI, which drives tighter policy, which drives financial conditions into territory that affects earnings across sectors, not just energy.
Petroleum-derived cost pass-through is already visible in Q1 2026 corporate earnings, with consumer goods and airline companies reporting direct margin compression from higher jet fuel and petrochemical input costs, a second wave of inflation impact that the headline CPI series captures only partially.
No scenario in the IEA’s modelling returns global oil markets to balance before October 2026, even under optimistic assumptions. That timeline defines the minimum duration of elevated prices.
The IEA’s forecast of a 3.9 million bpd supply fall for 2026 dwarfs the projected demand contraction of 420,000 bpd. Even accounting for demand destruction, the structural deficit of 1.78 million bpd persists. Price relief requires supply restoration, not demand softening alone.
The specific information signals that matter most from here:
For US investors managing inflation exposure across equities, fixed income, or commodities, the October rebalancing estimate provides a concrete time frame rather than open-ended uncertainty. The crisis is live, the tools are deployed but insufficient, and the analytical work required is specific and ongoing.
This article is for informational purposes only and should not be considered financial advice. Investors should conduct their own research and consult with financial professionals before making investment decisions. Financial projections referenced in this analysis are scenario-based and subject to market conditions and geopolitical developments. Past performance does not guarantee future results.
As of May 2026, approximately 10.5 million barrels per day of Gulf oil production is offline due to the Iran conflict, global inventories are drawing at a record rate of 8.5 million barrels per day in Q2 2026, and WTI crude is trading above $101 per barrel.
Saudi Arabia's crude output fell to 6.316 million barrels per day in April 2026, its lowest level since 1990 and a 42% contraction from pre-conflict production levels.
The IEA has already released approximately 280 million barrels from coordinated reserves, yet global inventories continue to draw at record rates because the scale of the disruption, roughly 10.5 million bpd offline, far exceeds what emergency tools can offset, and OPEC spare capacity of only 0.5 million bpd provides negligible relief.
US CPI reached 3.8% year-over-year in April 2026, with import fuel prices up 16.3%, and markets are now pricing approximately a 37% probability of a Fed rate hike by end of 2026, a figure that rises with each inflation print that exceeds expectations.
The IEA estimates that even under optimistic assumptions, including an immediate ceasefire and prompt infrastructure recovery, global oil markets will not return to balance before October 2026.