How to Position for the Most Event-Dense Week of July 2026
4 hrs ago

South Korea’s KOSPI shed 6.1% in a single session on 15 May 2026, briefly crossing above 8,000 before reversing violently, as Samsung Electronics fell 8.6% and SK Hynix lost 7.7% in one of the steepest single-day chip-stock routs of the year. The Korean collapse did not arrive in isolation. U.S. equity futures, European indices, and government bond markets across three continents all declined simultaneously, with the U.S. 10-year Treasury yield nearing 4.52% and Japan’s 20-year JGB yield touching its highest level since 1996. Investors also absorbed a Strait of Hormuz disruption driving Brent crude above $108 and processed the limited concrete outcomes from the Trump-Xi Beijing summit the previous day.
What follows explains what moved each asset class, why equities and bonds fell together (a pattern that signals a specific kind of investor anxiety), and what the Bank of Japan’s emerging tightening trajectory adds to the pressure building in global rates.
KOSPI intraday decline: approximately 6.1%, the sharpest single-session move in the region on 15 May 2026.
The KOSPI breached 8,000 in early trading. Within hours, the index had reversed hard enough to register a 6.1% intraday decline, turning a milestone into a whipsaw that caught momentum traders on the wrong side.
Samsung and SK Hynix together account for a dominant share of global DRAM and high-bandwidth memory supply. Their combined weight in the KOSPI means a single-session decline of this magnitude pulls the entire index lower, regardless of how other sectors perform.
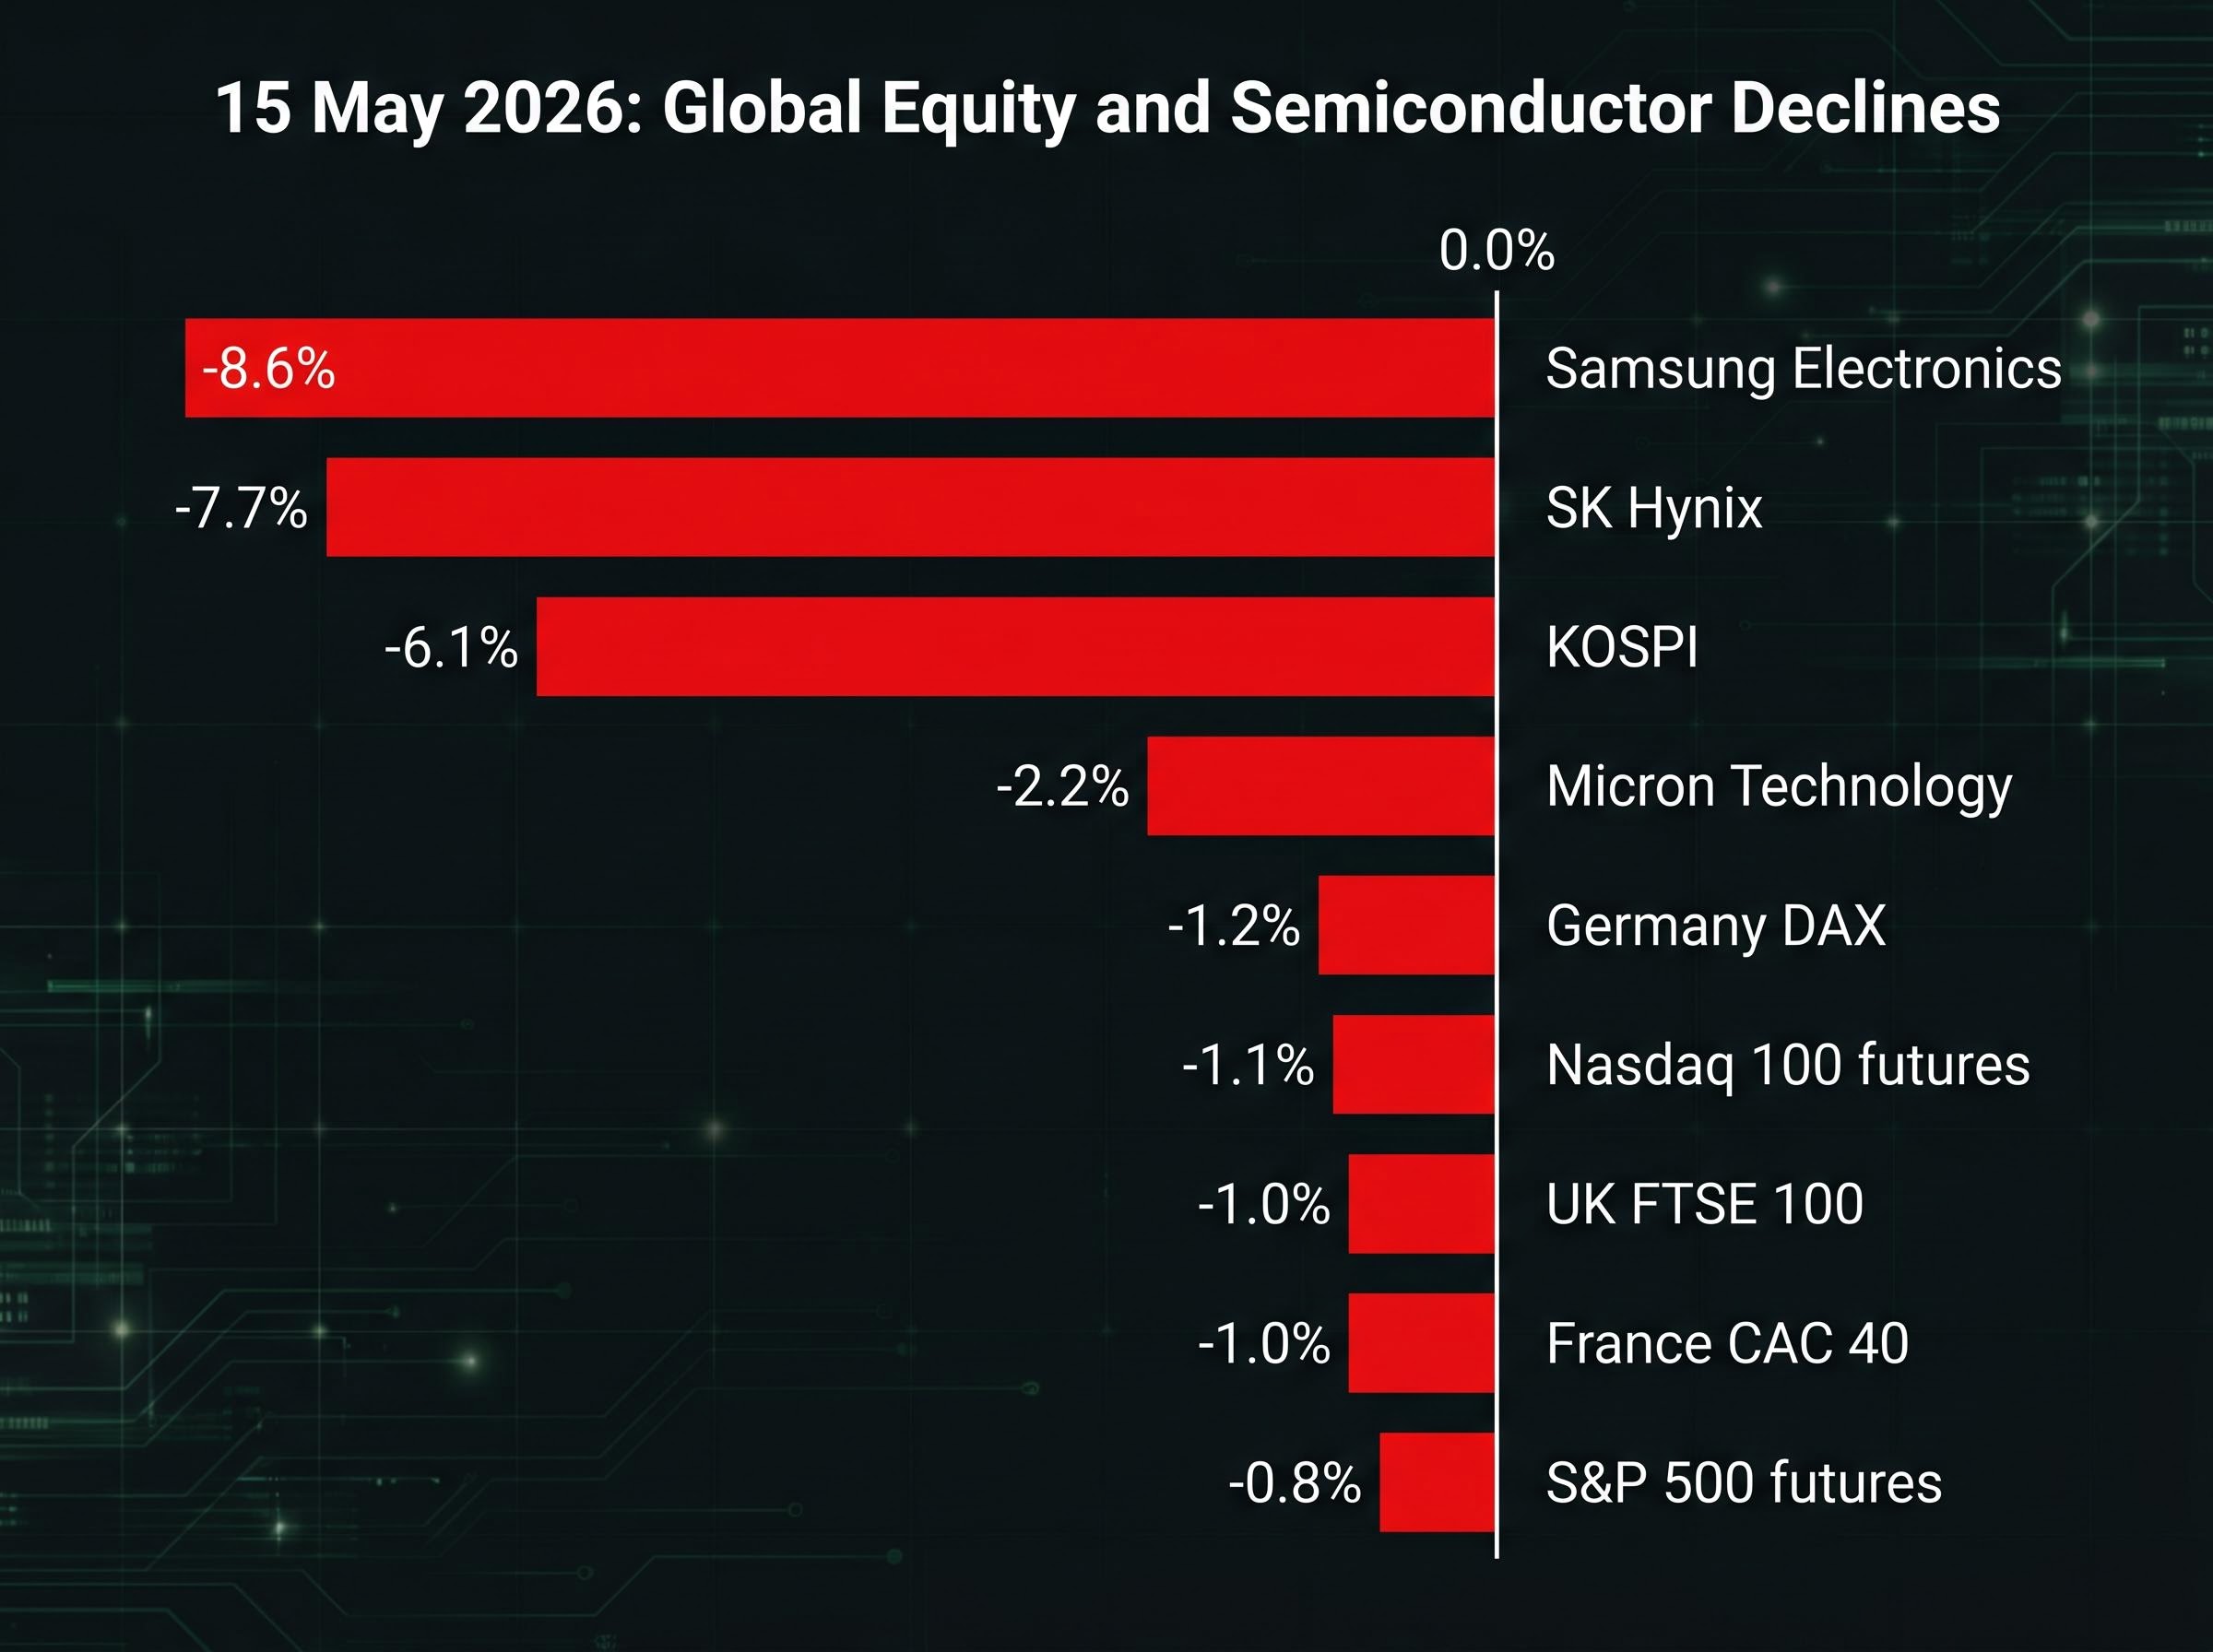
The damage was not contained to Seoul. Micron Technology fell approximately 2.2% in U.S. premarket trading, confirming that the chip rout was extending across geographies before Wall Street’s opening bell. When two of the world’s largest memory producers fall this hard on the same day, it signals something beyond local equity dynamics; it reprices risk across the entire semiconductor supply chain.
The severity of the Samsung and SK Hynix declines reflects how much valuation premium had been priced into the sector before the session: semiconductor stock valuations across the PHLX index span an extraordinary range in 2026, from Micron trading below 9x forward earnings to Intel sitting above 100x, meaning a single-session risk-off move hits individual names very differently depending on where they sit in that distribution.
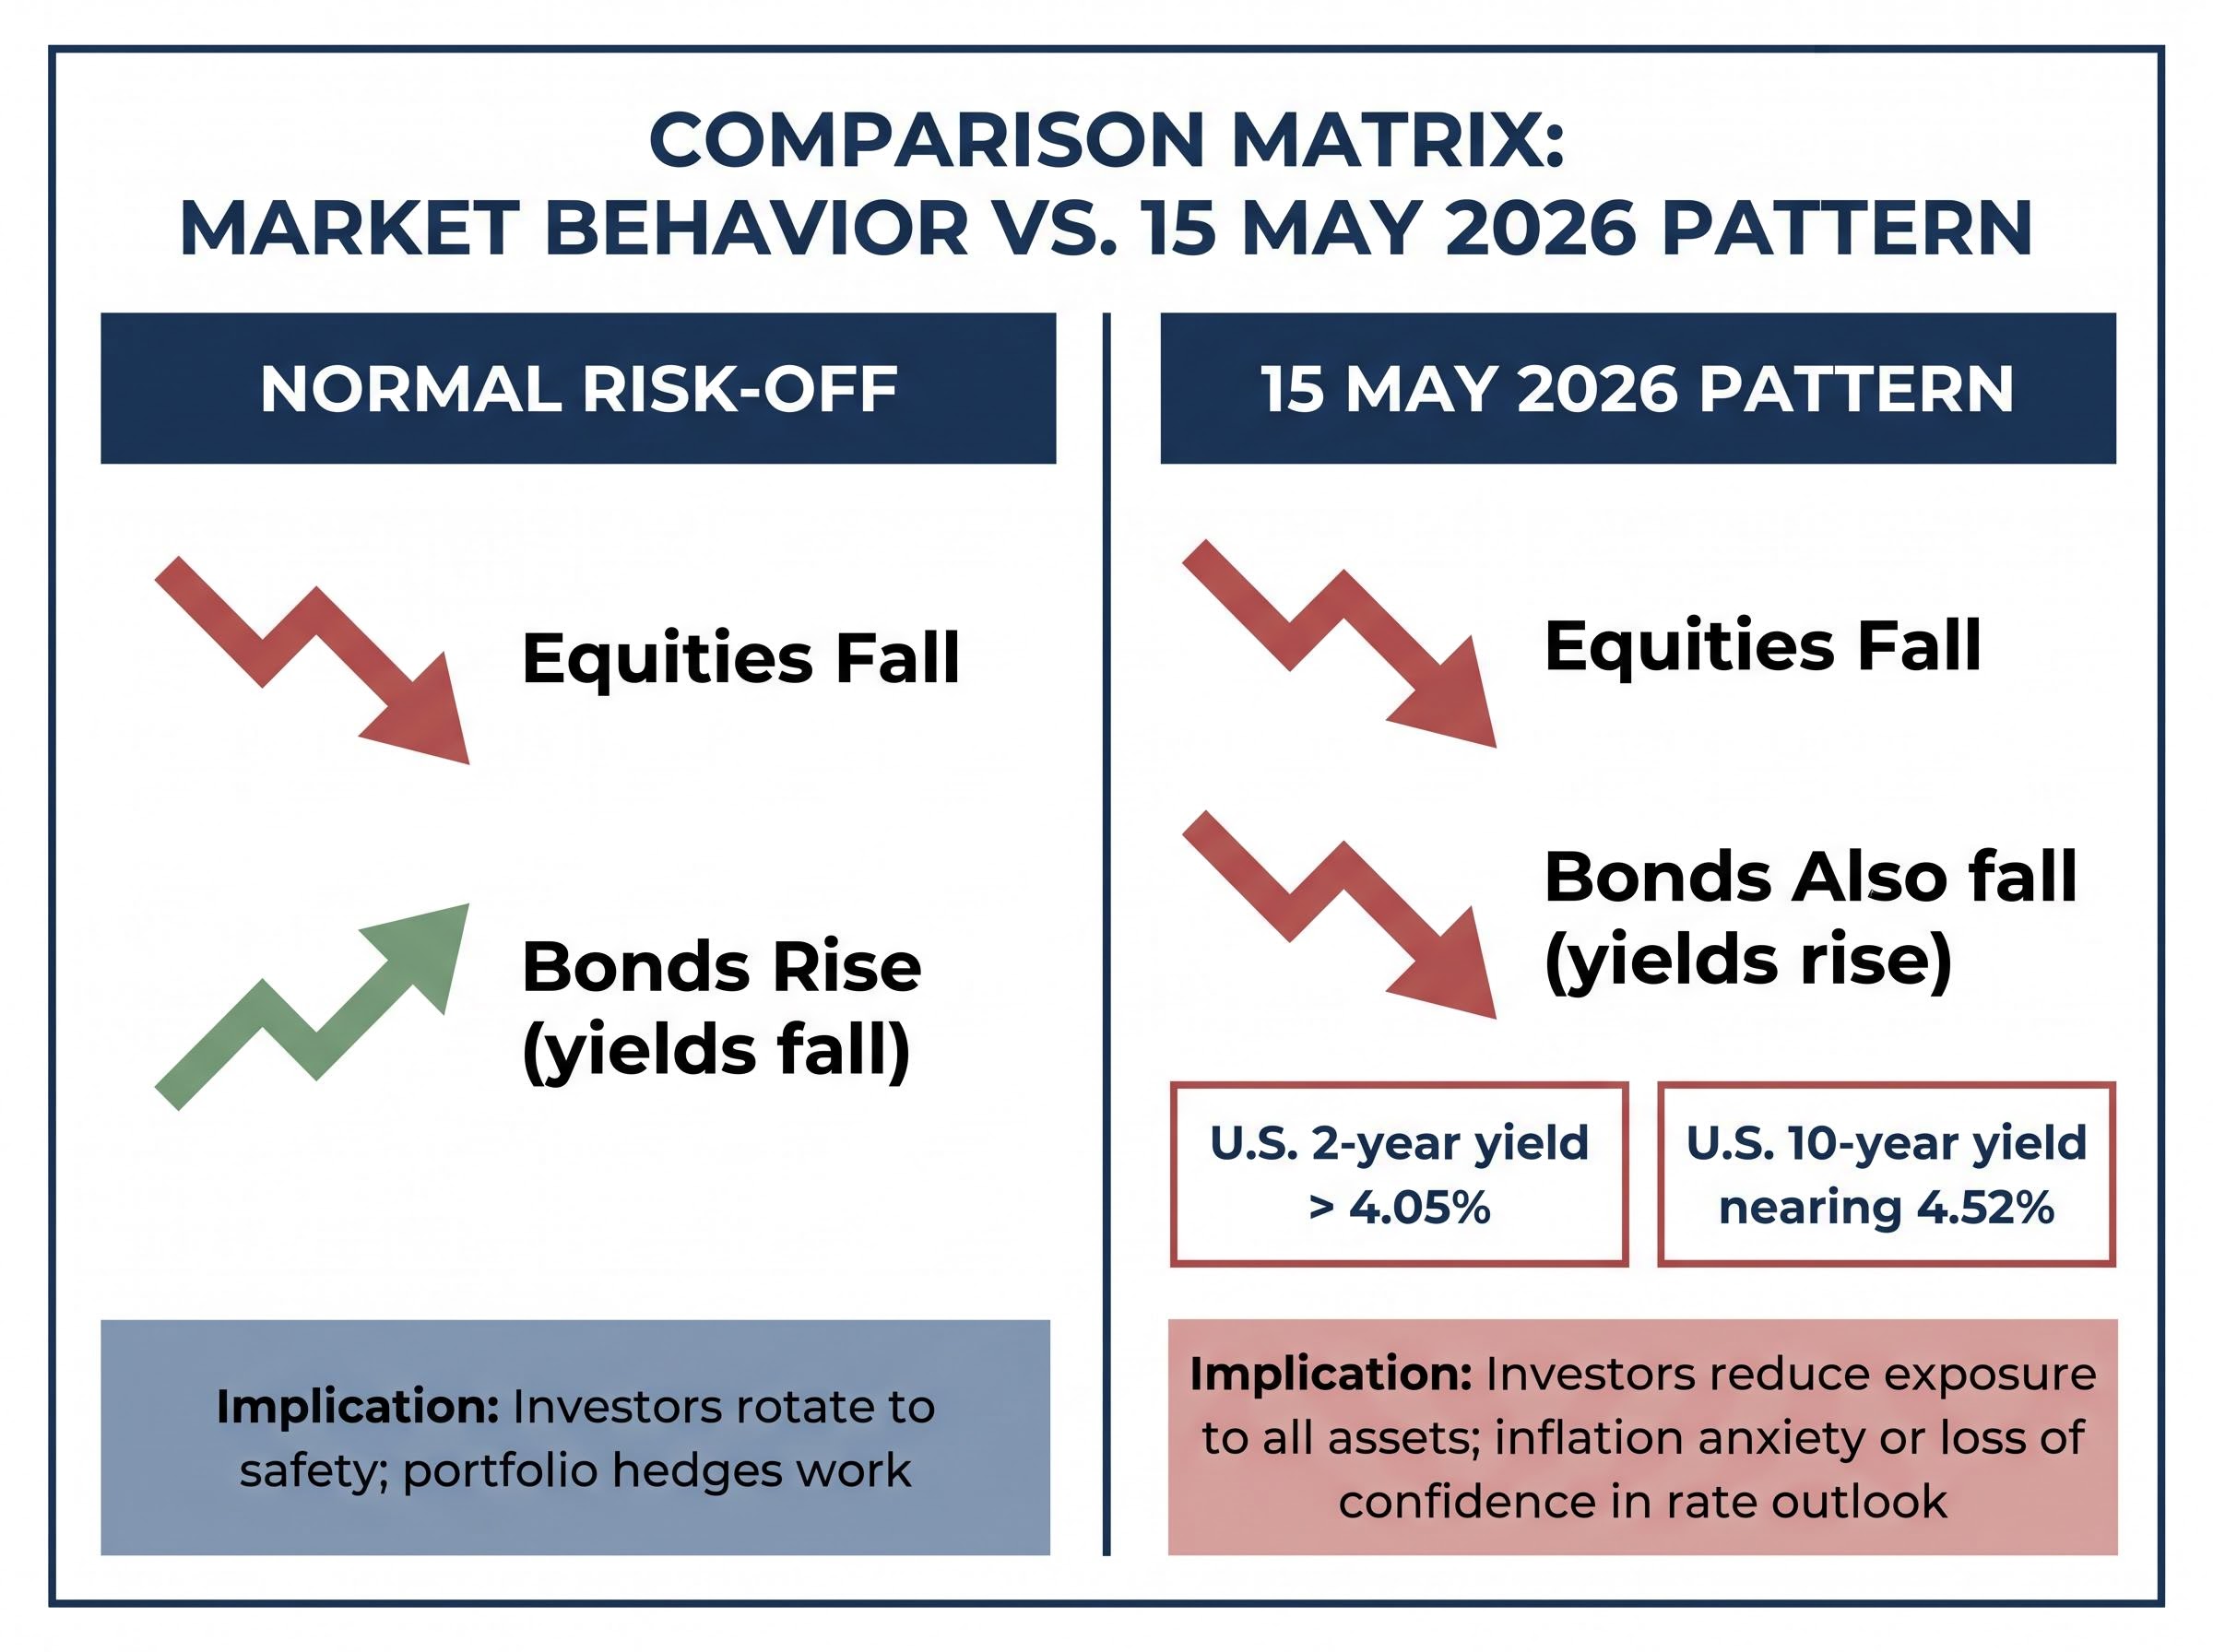
In a standard market downturn, investors sell equities and buy government bonds. That demand pushes bond prices up and yields down, creating the inverse relationship that underpins the traditional “60/40” portfolio model. Bonds absorb the shock that equities take.
When that relationship breaks, it signals the market is pricing something the standard model does not account for.
On 15 May 2026, both sides of the portfolio fell simultaneously. The U.S. two-year Treasury yield climbed above 4.05% while the 10-year neared 4.52%, meaning bond prices dropped. At the same time, S&P 500 futures declined approximately 0.8% and Nasdaq 100 futures fell roughly 1.1%.
| Scenario | Equities | Bonds | Implication |
|---|---|---|---|
| Normal risk-off | Fall | Rise (yields fall) | Investors rotate to safety; portfolio hedges work |
| 15 May 2026 pattern | Fall | Also fall (yields rise) | Investors reduce exposure to all assets; inflation anxiety or loss of confidence in rate outlook |
This distinction matters. When bonds fail to rally during an equity selloff, investors are not rotating to safety. They are reducing exposure across the board. That behaviour typically reflects either persistent inflation concerns or a collective reassessment of how long interest rates will remain elevated, neither of which resolves quickly.
NBER research on stock-bond correlation breakdown demonstrates that the inverse relationship between equities and government bonds weakens or reverses precisely during fiscal-monetary policy regimes where inflation expectations become unanchored, providing academic grounding for why the 15 May pattern reflects a deeper structural anxiety rather than a transient positioning anomaly.
Japan’s 20-year JGB yield reached its highest level since 1996, a structural repricing of one of the world’s most consequential bond markets.
The catalyst was a stronger-than-expected Japanese producer price index (PPI) print for April, which reinforced expectations that the Bank of Japan (BOJ) may extend its tightening cycle. For a central bank that spent decades suppressing yields, each step toward normalisation sends shockwaves through global fixed income.
The Bank of Japan policy normalisation framework, as outlined in official Policy Board communications from early 2026, makes explicit that the exit from large-scale monetary easing is contingent on sustained wage-driven inflation, a condition the April PPI print brought materially closer to being satisfied.
This is not a peripheral story. Japanese institutional investors, including pension funds and life insurers, rank among the largest holders of foreign bonds globally. When domestic yields rise enough to compete with overseas alternatives, these institutions historically repatriate capital, selling U.S. Treasuries and European government bonds to buy JGBs instead.
That repatriation dynamic adds selling pressure to bond markets already under strain from inflation data and supply concerns. On 15 May, the U.S. 10-year yield nearing 4.52% was not solely a domestic story. It reflected pressure building from both sides of the Pacific simultaneously, with the BOJ’s trajectory amplifying what the Federal Reserve’s rate outlook had already set in motion.
Japanese Treasury liquidations tied to yen defense operations have added a separate layer of selling pressure to U.S. government bond markets in recent weeks: the Ministry of Finance’s Golden Week intervention, estimated at 8-9 trillion yen, likely required liquidating $40-50 billion in U.S. Treasury holdings, compounding the yield pressure that the BOJ’s domestic tightening trajectory was already generating from the other direction.
European indices confirmed that the selling was genuinely global, not a time-zone-specific reaction to Asian data.
In the UK, domestic political uncertainty added a local layer to the broader headwind. Renewed pressure on Prime Minister Keir Starmer, linked to a parliamentary vacancy that could position Greater Manchester Mayor Andy Burnham for a Commons seat, introduced an additional source of investor caution, though the declines remained broadly in line with the continent-wide pattern.
The U.S. Treasury regularly auctions new debt to finance government spending. When demand at these auctions softens, the government must offer higher yields to attract buyers.
In the weeks preceding 15 May, auction sizes had been expanded, increasing supply into a market already contending with soft demand. Tepid bidding at recent bill auctions compounded the effect, creating a supply-demand imbalance that pushed yields higher independently of the macro data. This structural pressure layered on top of the inflation concerns already driving the bond selloff, making yield relief harder to find even if economic indicators were to soften.
Oil prices surged as sustained Strait of Hormuz disruption fears intensified, compounded by President Donald Trump’s statement that he was losing patience with Iran.
Deutsche Bank strategists observed that markets lost upward momentum after Trump indicated the U.S. does not require the Strait to remain open, introducing a ceiling on how far oil-driven positioning could extend.
The Trump-Xi summit on 14 May 2026 in Beijing, which exceeded two hours, offered little to offset the commodity-driven anxiety. Trump claimed major trade agreements had been reached but disclosed no specifics. The absence of detail left markets without a positive catalyst to lean against the risk-off momentum.
Adam Crisafulli of Vital Knowledge characterised the summit headlines as not meaningfully shifting the broader market narrative.
Oil above $100 feeds directly into the inflation anxiety already driving bond yields higher, which in turn compresses equity valuations. The geopolitical and rates stories are not running in parallel; they are interacting in a mutually reinforcing cycle that pressures risk assets from multiple directions.
The Hormuz risk premium embedded in Brent crude above $108 is not simply a function of current disruption; the near-total withdrawal of commercial war-risk insurance means that even a ceasefire announcement would not immediately reopen standard commercial transit, with the IEA projecting a two-year supply chain recovery timeline under a best-case resolution, a structural floor beneath oil prices that feeds directly into the inflation anxiety already driving bond yields higher.
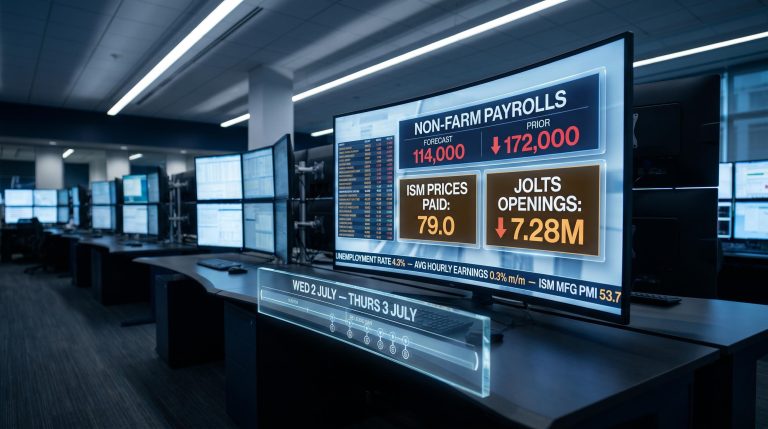
Two scheduled U.S. releases due later on 15 May 2026 carry particular weight given the day’s dynamics:
On a day when markets are already absorbing pressure from semiconductors, global bonds, oil, and diplomatic disappointment, these data points function as potential accelerants or circuit-breakers. The afternoon session’s direction may hinge on whether the numbers confirm or contradict the inflation anxiety that has defined the morning.
Three simultaneous pressures defined 15 May 2026: Korean and global equity declines, a cross-regional bond selloff spanning the U.S., Japan, and Europe, and an oil surge past $108. These are three symptoms of one underlying investor concern, the rate path in a world of persistent supply-side inflation.
The absence of a definitive signal from the BOJ, the Federal Reserve, or the European Central Bank on 15 May leaves investors without a policy anchor. Historically, periods of simultaneous equity and bond selling persist longer when no central bank is actively providing clarity on where rates are heading.
Mainland China’s relative resilience during the session was the day’s one counterpoint. Without resolution on the Strait of Hormuz, a clearer BOJ trajectory, or evidence of weakening U.S. data, the conditions that produced the 15 May selloff remain structurally in place.
The inflation containment threshold that separates an earnings risk from a broad CPI breakout sits at approximately $85-90 per barrel sustained through Q3 2026, according to analysis of corporate margin absorption and M4 money supply growth; with Brent above $108 on 15 May, that threshold has already been breached, raising the question of how long consumer-facing companies can absorb input costs before the pressure reaches retail prices.
When equities, bonds, and commodities all move in response to the same inflation anxiety, the resolution depends on the removal of the underlying cause, and none of the causes visible on 15 May 2026 are close to resolution.
This article is for informational purposes only and should not be considered financial advice. Investors should conduct their own research and consult with financial professionals before making investment decisions.
Past performance does not guarantee future results. Financial projections and forward-looking statements referenced in this article are subject to market conditions and various risk factors.
A simultaneous stock and bond selloff occurs when both asset classes fall at the same time, breaking the usual inverse relationship where bonds rise when stocks fall. This pattern signals that investors are reducing exposure across all assets rather than rotating to safety, typically reflecting persistent inflation fears or a loss of confidence in the interest rate outlook.
Samsung Electronics fell approximately 8.6% and SK Hynix dropped around 7.7% during the 15 May 2026 global market selloff, with their combined weight in the KOSPI dragging the index down roughly 6.1% intraday. The declines reflected a broader risk-off move that repriced the valuation premium built into the semiconductor sector, with the damage extending to Micron Technology in U.S. premarket trading.
When the Bank of Japan raises domestic yields, Japanese institutional investors such as pension funds and life insurers historically repatriate capital by selling foreign bonds, including U.S. Treasuries and European government debt, to buy higher-yielding Japanese bonds. This selling pressure compounds existing yield rises driven by inflation data and weak auction demand, as seen on 15 May 2026 when the U.S. 10-year yield neared 4.52%.
Sustained Strait of Hormuz disruption fears pushed Brent crude above $108 per barrel on 15 May 2026, adding an energy-driven inflation shock on top of already elevated bond yields and falling equities. The IEA has projected a two-year supply chain recovery timeline even under a best-case resolution, meaning the risk premium embedded in oil prices is structural rather than transient.
Markets were focused on two scheduled releases later that day: the Federal Reserve's April 2026 U.S. industrial production report and the New York Fed's May 2026 Empire State Manufacturing Survey. Both were seen as potential accelerants or circuit-breakers, with stronger readings risking confirmation of the inflation narrative already weighing on equities and bonds simultaneously.