Delivery Hero Shareholders Reject Uber’s €33 Bid, Demand €40+
1 hr ago
Daily ship transits through the Strait of Hormuz have collapsed from more than 70 to just 3, and Brent crude has not traded above $100 a barrel since the early post-Ukraine period. That contrast frames the severity of a supply disruption that is not driven by demand, but by a physical blockade of the world’s most concentrated oil chokepoint, layered on top of a geopolitical conflict whose resolution timeline remains genuinely uncertain, with US military operations already costing approximately $29 billion. What follows is a structured map of what institutional forecasters are projecting under each scenario, how long the disruption may last, and what the oil price forecast looks like from here through 2027.
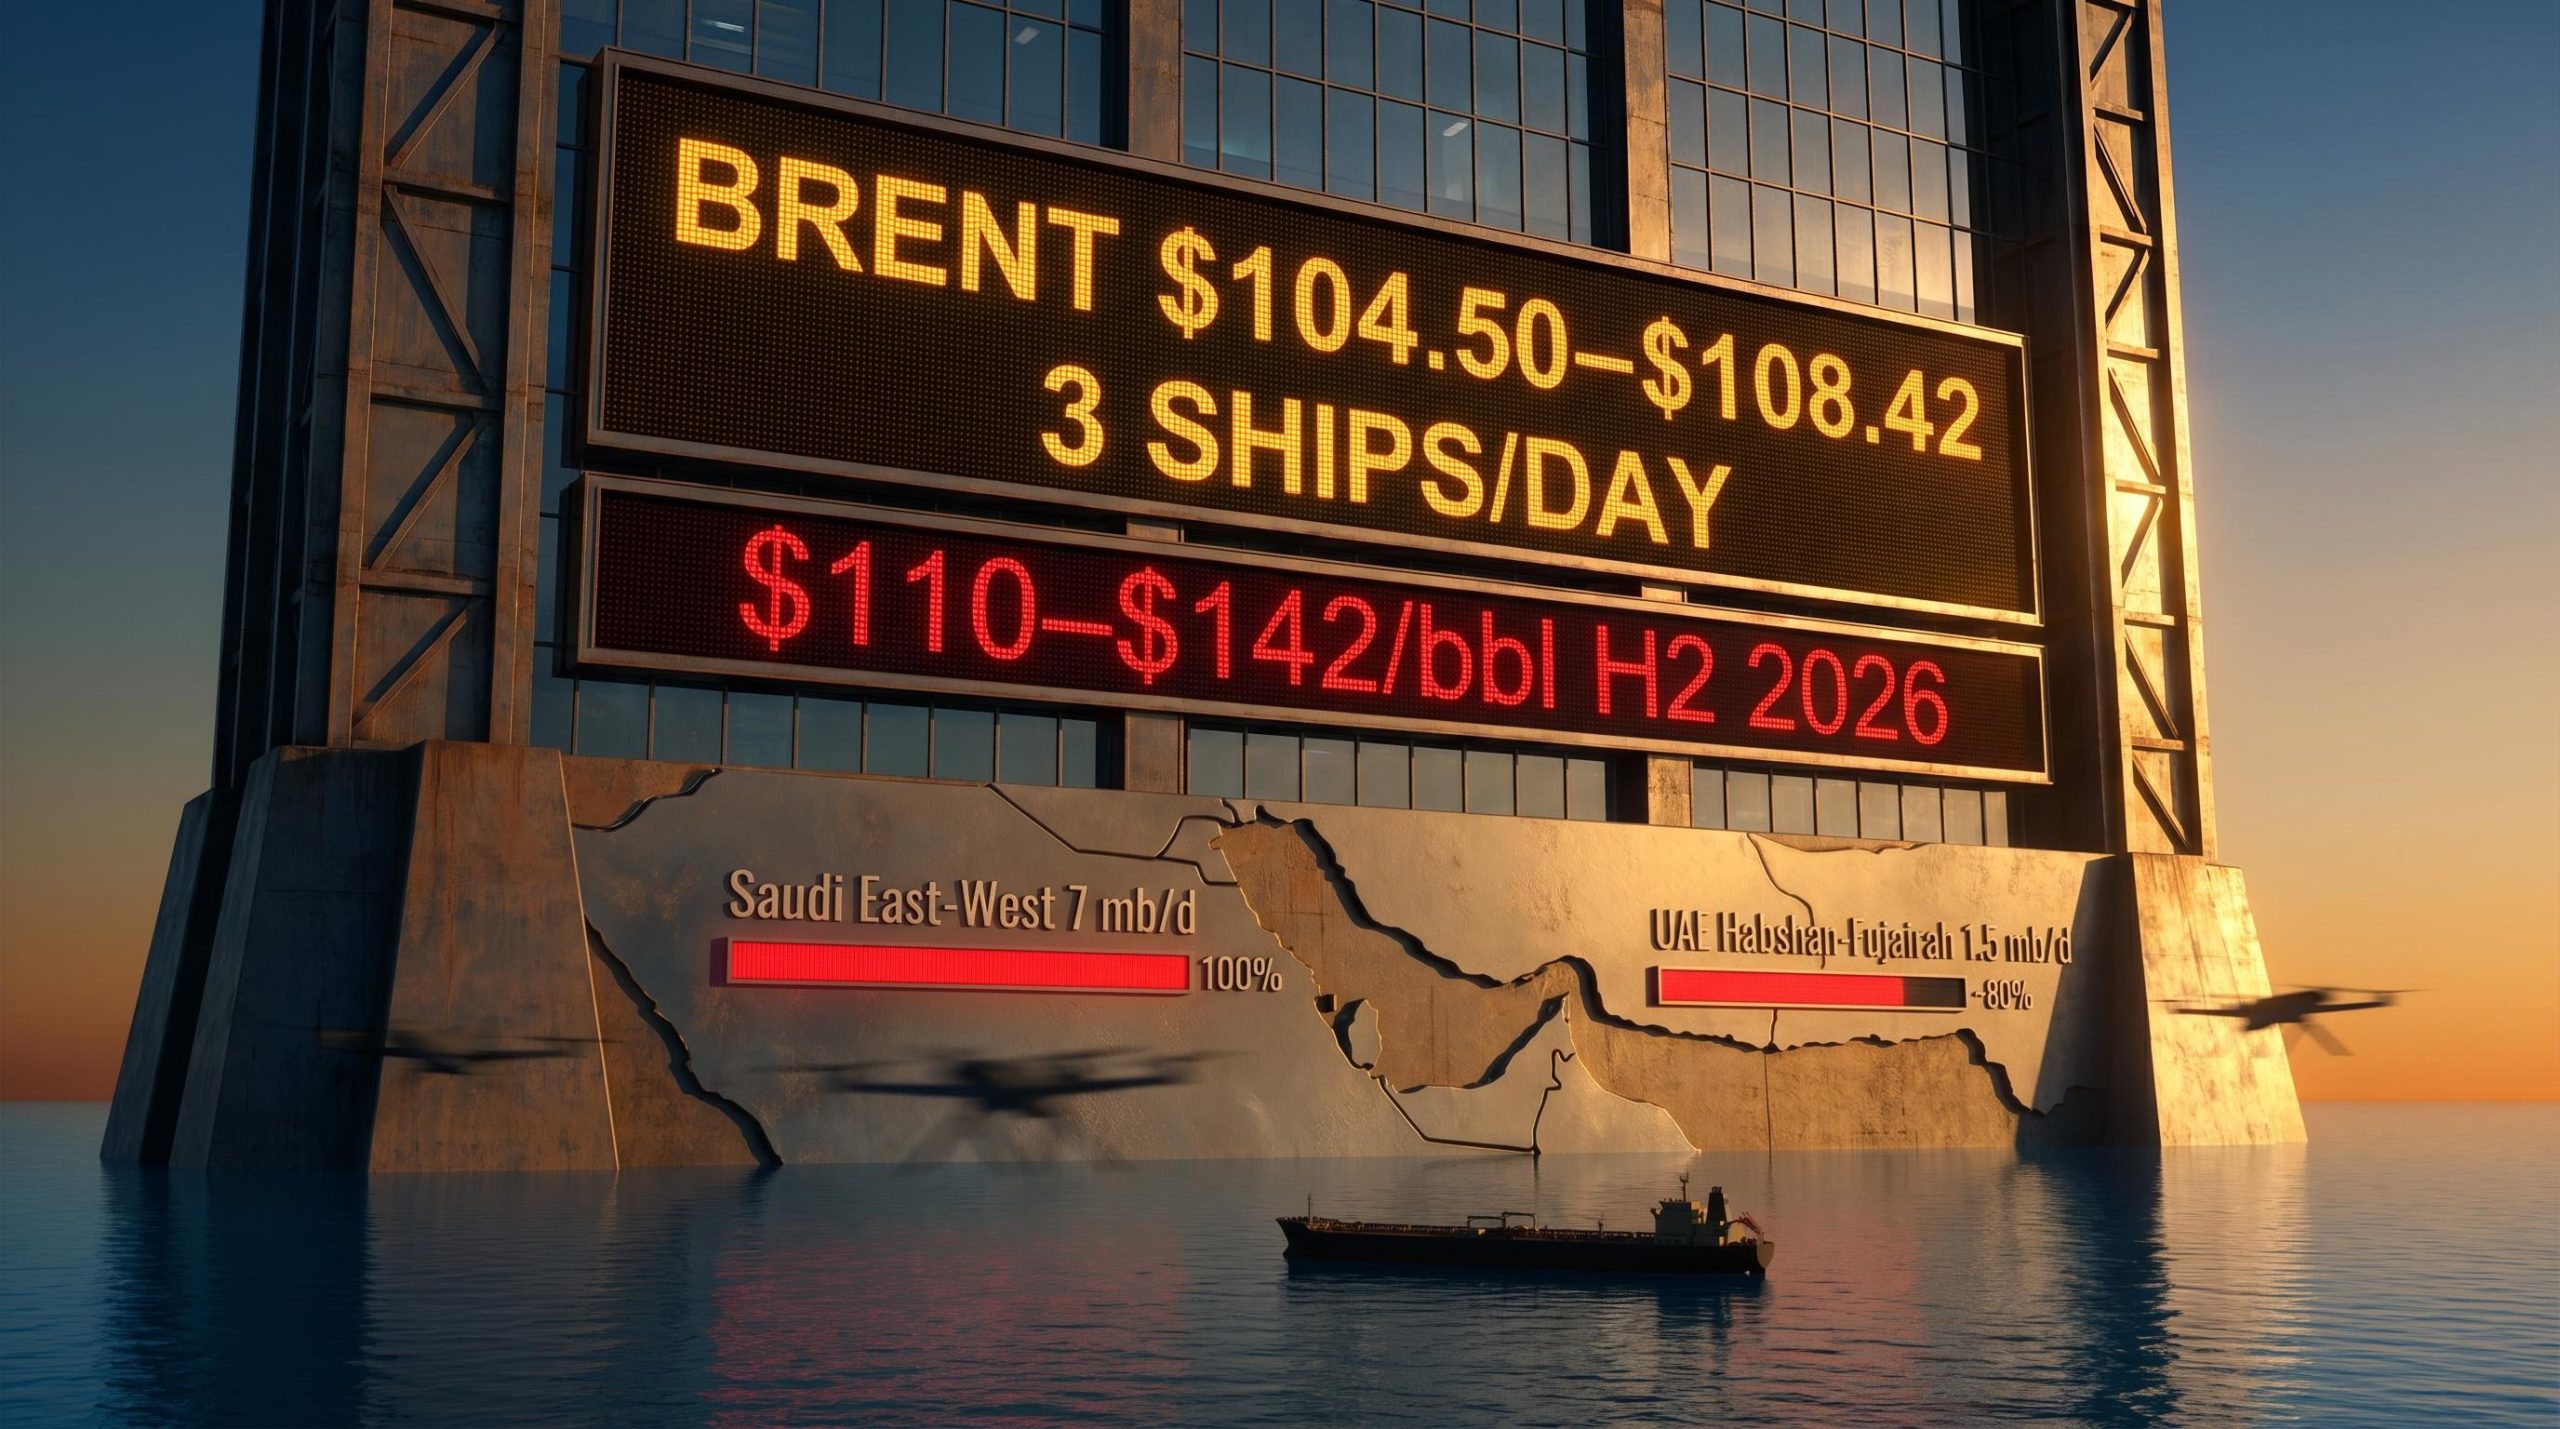
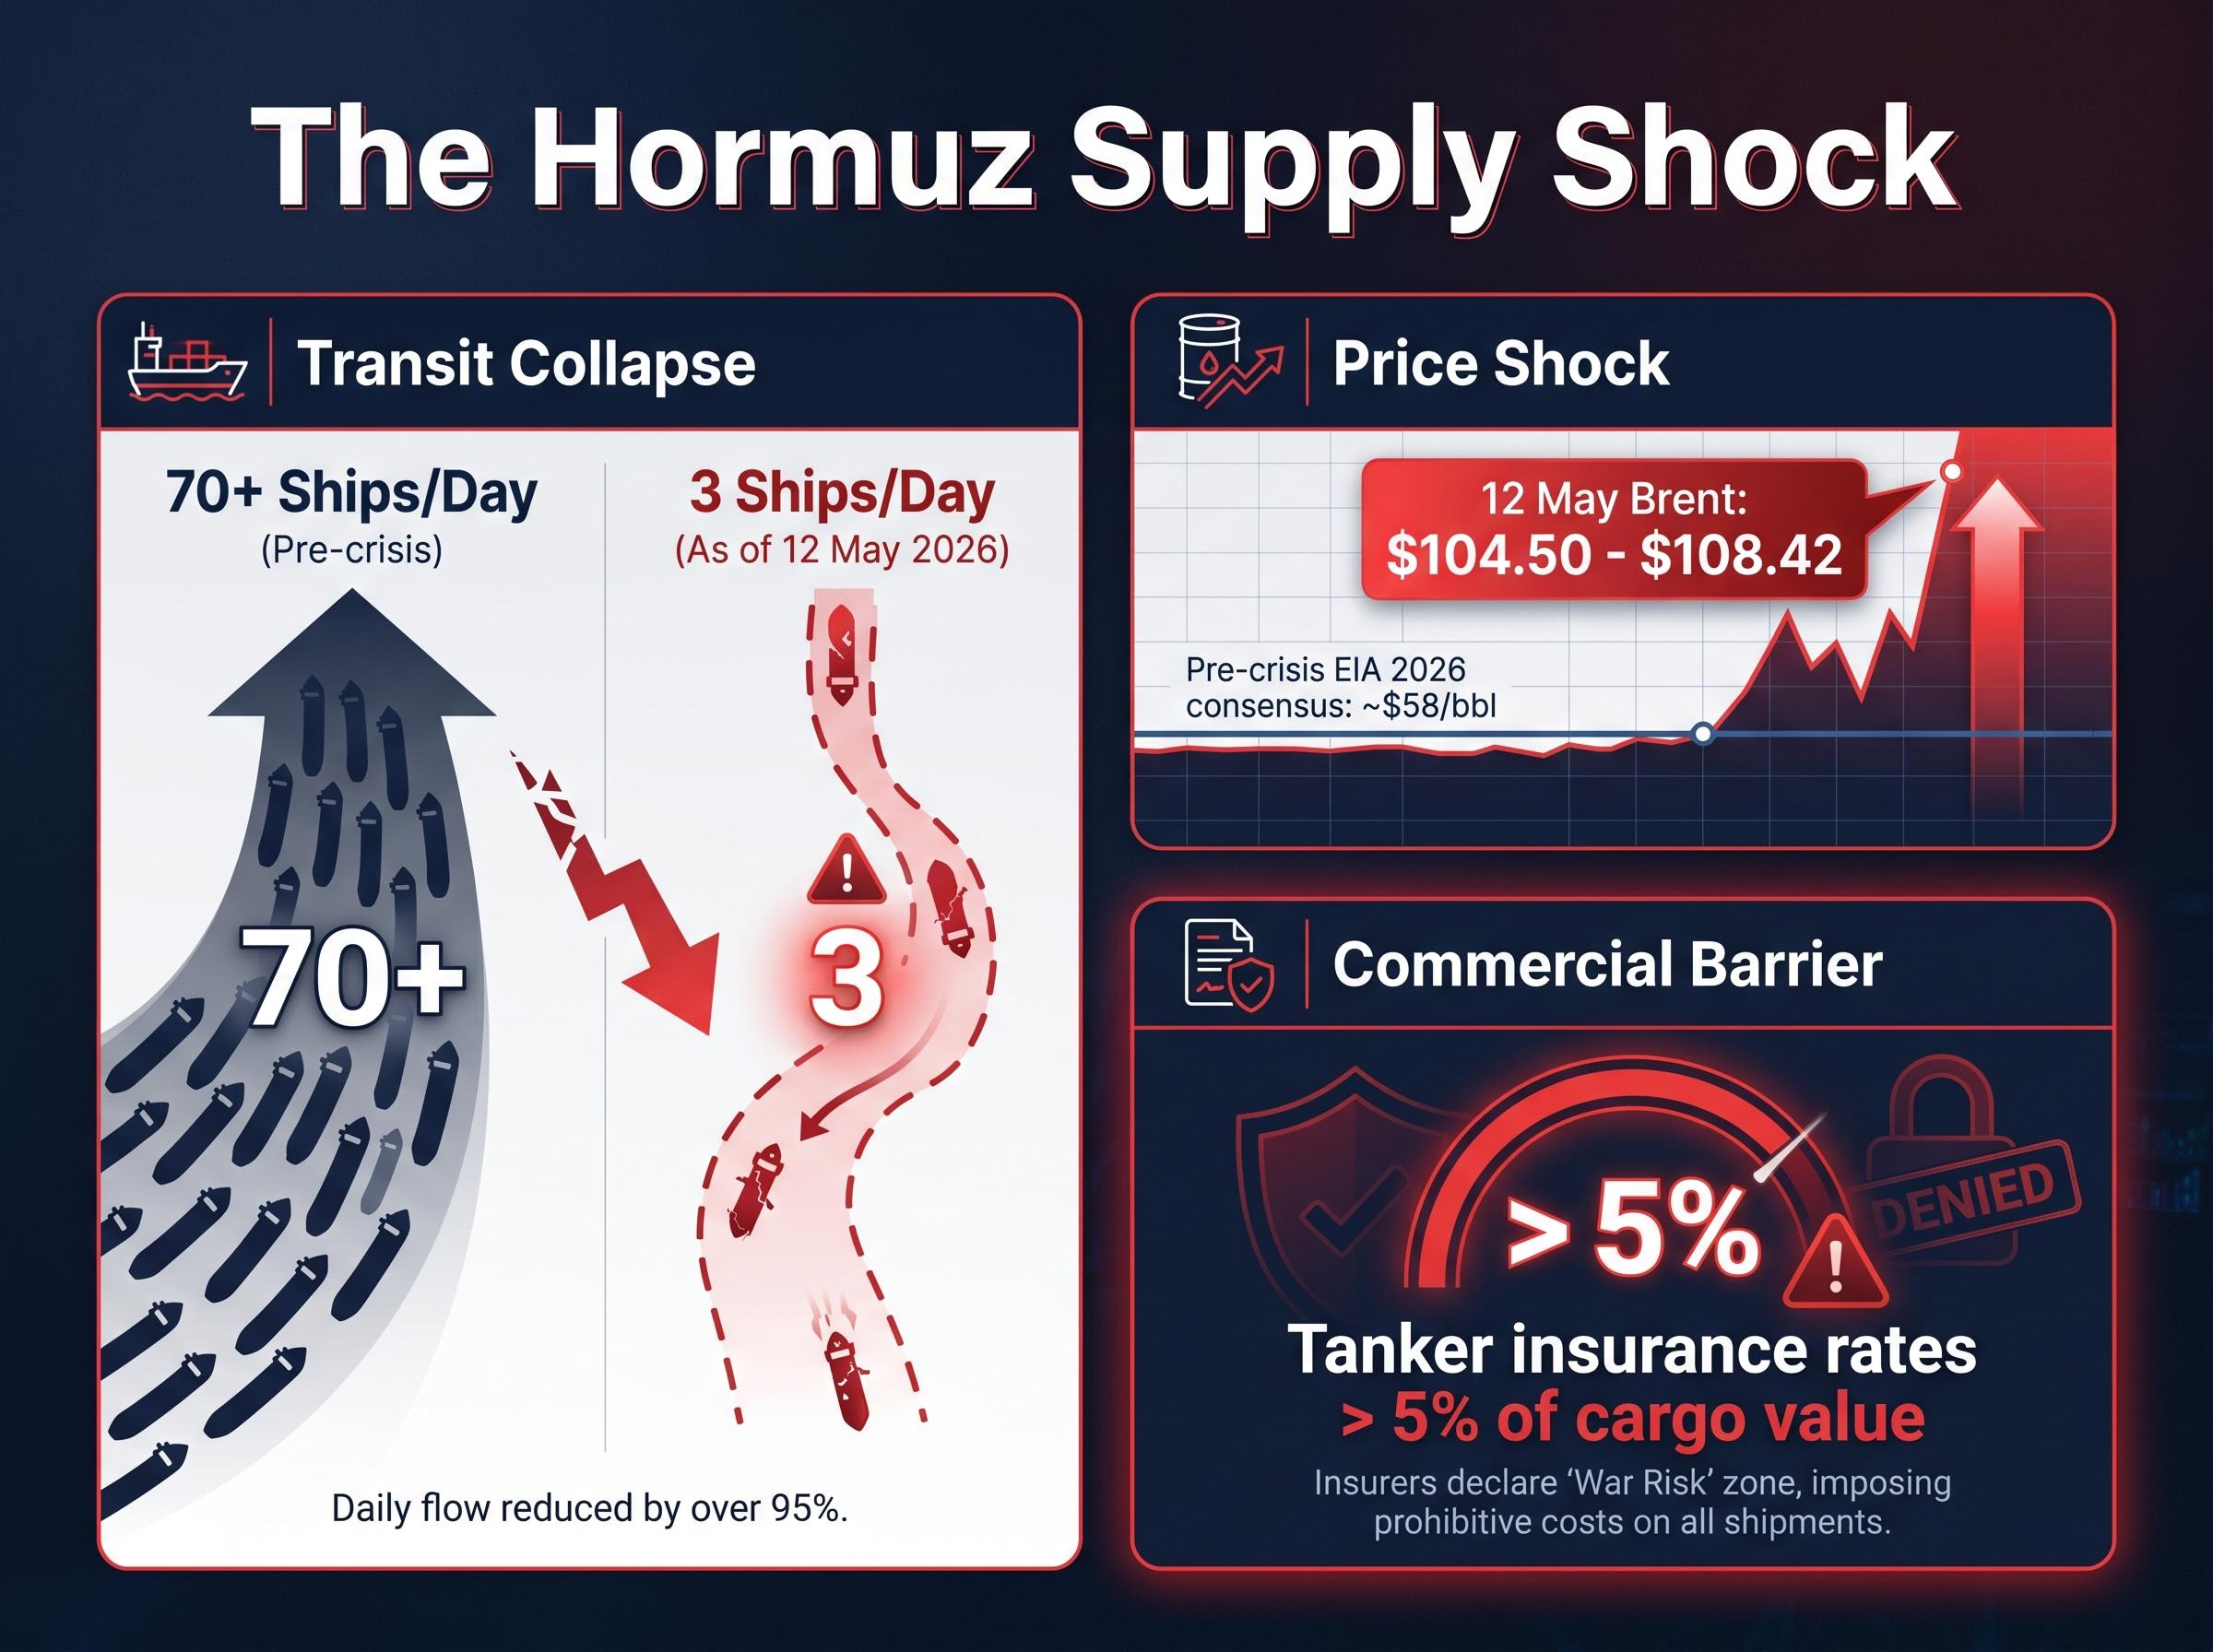
Transit collapse: Daily laden tanker transits through the Strait of Hormuz have fallen from more than 70 ships per day to just 3 as of 12 May 2026, all under 100,000 DWT and carrying mostly Iraqi crude.
Satellite imagery confirms Iranian drone patrols blocking transit approaches, and the US Navy 5th Fleet, which escorted 2 tankers on 11 May, did not repeat the operation the following day. The result is a near-total shutdown of a channel that carries approximately 20% of global seaborne oil, a proportion with no full alternative routing solution.
Three compounding mechanisms are enforcing the restriction:
Before the crisis, the EIA’s consensus forecast for 2026 sat at approximately $58/bbl. On 12 May, Brent traded between $104.50 and $108.42, with WTI at approximately $101.46. The distance between those two figures captures the scale of the shock.
The oil price surge from $72 to $126 per barrel between March and late April 2026 compressed into weeks a move that previous oil shocks took months to deliver, with Minneapolis Fed President Kashkari citing an industry estimate of approximately six months for supply chains to fully normalise even under an immediate reopening scenario.
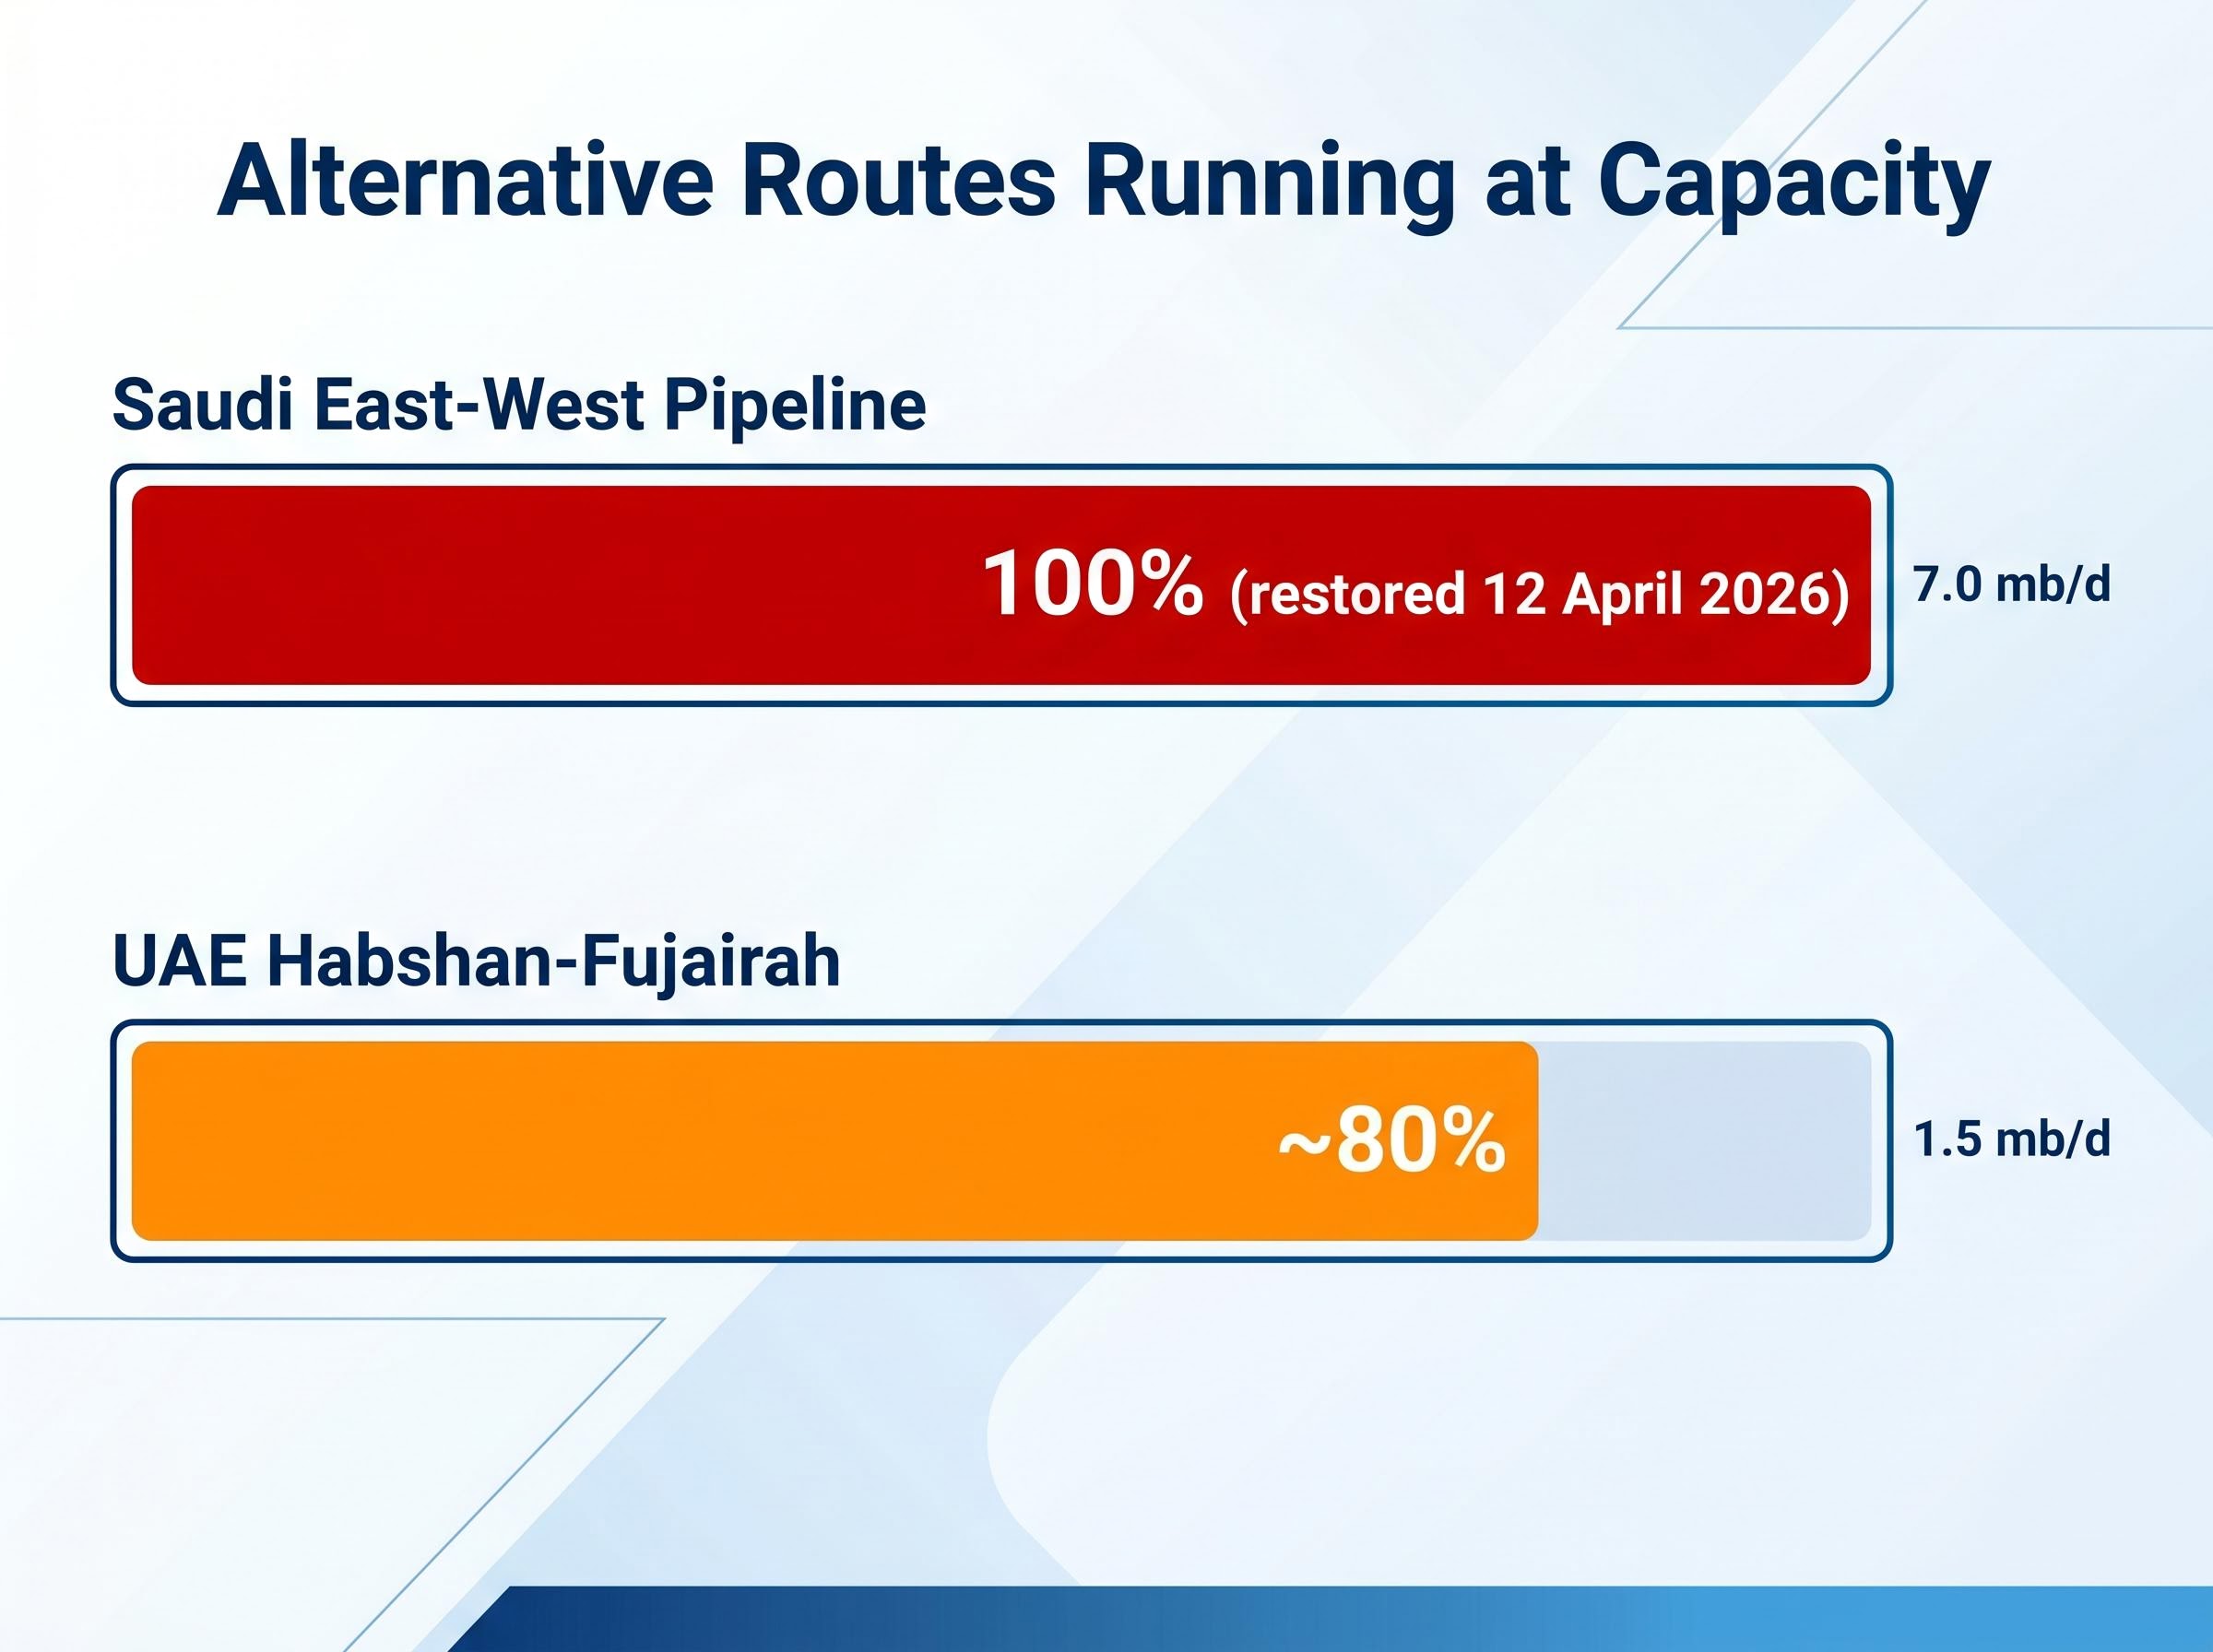
The two main pipeline alternatives to Hormuz transits are approaching their operational ceilings, and the numbers leave limited room for further relief.
| Pipeline | Capacity (mb/d) | Current Utilisation | Constraint |
|---|---|---|---|
| UAE Habshan-Fujairah | 1.5 | Approximately 80% | Near mechanical ceiling |
| Saudi East-West | 7.0 | 100% (restored 12 April 2026) | Operating at maximum |
The Saudi pipeline was restored to its full 7 mb/d capacity on 12 April 2026 and has been running at maximum since. The UAE line, at approximately 80% utilisation as of the IEA’s 11 May report, has limited surge capacity remaining.
The Oxford Economics global energy price risk briefing notes that roughly one fifth of global oil and LNG transits the Strait daily, a share large enough that no single alternative routing combination can fully substitute for unrestricted tanker passage at normal volumes.
The constraint is not purely volumetric. Asian refiners, the largest demand centre for Gulf crude, are calibrated for heavier sour grades that transit Hormuz by tanker. The Saudi and UAE pipeline alternatives carry lighter grades that do not substitute directly, limiting the effective relief these routes can deliver to the refiners that need it most.
Tanker owners, meanwhile, are posting record earnings as vessels reroute onto longer alternative passages, adding to landed crude costs for importers on top of the headline price shock.
Six cushioning mechanisms, including Saudi and UAE pipeline rerouting, IEA reserve releases, Chinese stockpile resales, sanctions waivers, increased Venezuelan exports, and rising US rig counts, have collectively held Brent below the $120-$150 range that pre-crisis scenario models flagged as the disruption ceiling, though each is capacity-constrained and cannot absorb an indefinite extension of the closure.
The futures curve is telling a specific story. Brent is trading in backwardation as of 12 May, meaning front-month contracts are priced higher than deferred ones. In practical terms, this indicates the market is pricing tight near-term supply rather than a structural demand surge; buyers are paying a premium for immediate delivery because they expect scarcity to persist in the short term.
That signal is confirmed by the physical inventory data, though reading the numbers requires understanding a methodological split between the two agencies tracking them.
OECD stocks stood at approximately 1,202 mb as of 9 May. The IEA reported a week-on-week draw of approximately 28 mb; the EIA reported approximately 18 mb for the same period. The discrepancy reflects the EIA’s exclusion of Strategic Petroleum Reserve (SPR) volumes currently in transit from its calculation. For supply security analysis, the IEA figure captures the broader picture of how quickly the buffer is depleting.
Three inventory signals point in the same direction:
The IEA’s coordinated emergency release, announced on 11 March 2026 and representing the largest in the agency’s history at 60 mb, has provided a partial buffer. Approximately 36 mb had been drawn by 12 May, with the US contributing roughly 17 mb and Japan and the EU approximately 19 mb combined.
The IEA has flagged an emergency meeting if daily tanker transits fall below 5 ships, a threshold that current activity, at 3 ships, has already breached.
The range of institutional price projections is wide, but it is not random. The divergence maps onto a small number of specific assumptions about when, and whether, Hormuz reopens.
Oxford Economics Hormuz price scenario analysis published ahead of the current crisis modelled a severe shipping disruption as sufficient to push crude to $140 per barrel, a ceiling that now sits within the upper bound of Goldman Sachs and JPMorgan’s prolonged closure estimates.
| Forecaster | Reopening Scenario | Prolonged Closure Scenario | Key Assumption |
|---|---|---|---|
| EIA (May 2026 STEO) | $89/bbl Q4 2026; $79/bbl 2027 | Not separately modelled | 20% probability of transit delays in base case |
| Goldman Sachs (28 April 2026) | Approximately $90/bbl Q4 2026 | $110-$142/bbl H2 2026 | 55% probability of normalisation by 15 June; OPEC+ adds approximately 1 mb/d |
| JPMorgan | Directionally lower (pre-disruption baseline) | $110-$142/bbl H2 2026 | Prolonged closure modelled alongside Goldman range |
The IEA estimates approximately 60% probability of partial reopening (20-plus ships per day) by 25 May via US-Iran backchannel talks, with full reopening by 30 June at approximately 40% probability. Goldman Sachs assigns 55% probability to its base case of normalisation by 15 June and 30% to prolonged disruption.
Helima Croft of RBC Capital Markets has framed tanker insurance rates as a “de facto blockade enforcer,” noting that even if physical transits technically resume, rates exceeding 5% of cargo value will restrict commercial shipping.
The triggers analysts are actively monitoring function as binary decision points for these forecasts:
Specific bank forecast figures should be treated as directional indicators pending official May 2026 publication updates.
The April 2026 US headline CPI came in at 3.8% year-on-year, above the 3.7% consensus, with a monthly increase of 0.6%. Energy prices were responsible for more than 40% of the headline increase. Airline fares rose 20.7% year-on-year, reflecting the direct pass-through of elevated jet fuel costs.
The Federal Reserve’s policy response is being shaped accordingly. CME FedWatch data shows near-zero probability of a rate cut in 2026 and approximately 30% probability of a rate increase by December 2026. Bank of America has pushed its rate cut forecast out to H2 2027, citing the Iran energy shock explicitly. The US 10-year Treasury yield sits at 4.459%, with the 30-year yield above 5%.
Bank of America now forecasts no Federal Reserve rate cuts until H2 2027, attributing the revision explicitly to the Iran energy shock and its inflationary transmission.
Australia’s Treasury, in the 2026-27 budget, projected inflation peaking at approximately 5% around mid-year, also attributed to the energy shock. The transmission chain from oil to consumer prices to monetary policy is functioning across developed economies simultaneously.
National responses have been substantial but are functioning as buffers rather than solutions:
China is sourcing approximately 1.2 mb/d of additional Russian ESPO crude via pipeline, up approximately 30%, while also implementing factory output curbs of roughly 20% in Shandong province. Both China and India are prioritising volume security over price, outcompeting European buyers in spot markets.
The EIA’s $79/bbl forecast for 2027 requires a specific sequence of events, none of which has yet occurred. The conditions required for the reopening scenario to materialise are:
Goldman Sachs assigns 55% probability to normalisation by 15 June 2026 and 30% to prolonged disruption, meaning the market’s own base case carries substantial downside contingency.
The risk distribution is not symmetric. Under the prolonged closure path, prices of $110-$142/bbl in H2 2026 represent a materially larger deviation from current levels than the $89-$90 implied by the reopening path. Physical routing constraints mean supply cannot be quickly restored even if a diplomatic trigger resolves, because tanker insurance markets, refinery recalibration, and pipeline utilisation do not snap back overnight.
Saudi Aramco CEO Amin Nasser has warned that supply normalisation into 2027 is a plausible base case, a view consistent with the IEA’s own estimate that the 400 million barrel emergency release covers only approximately four weeks of the weekly supply deficit created by the closure.
OPEC+ has extended its voluntary cuts with no unwind announced, and the UAE and Russia have signalled a potential additional 500,000 b/d only if the closure extends past June. Approximately 25% of Iranian targets reportedly remain unaddressed, creating ongoing military optionality that complicates any ceasefire scenario.
The pre-crisis $58/bbl consensus for 2026 is no longer a plausible near-term outcome. Even under the most optimistic reopening timeline, OPEC+ production posture, inventory deficits across OECD and non-OECD nations, and the complexity of unwinding national policy responses point to a structurally higher price floor for the medium term.
Three data points will serve as leading indicators for tracking the resolution path:
The Hormuz risk premium is tracking VLCC daily hire rates, which have reached approximately $110,000 per day, as a real-time physical market signal that often moves faster than crude futures and provides a cleaner read on commercial shipping confidence than either tanker transit counts or diplomatic statements.
The Hormuz crisis is no longer priced as a tail risk. It is the base case. Portfolio positioning calibrated to a return to pre-crisis levels is pricing in a resolution that institutional forecasters assign, at best, a 55% probability, with a timeline that extends weeks or months beyond any diplomatic breakthrough. The relevant question is not whether oil prices fall from current levels, but how far and how fast, and what the new floor looks like on the other side.
This article is for informational purposes only and should not be considered financial advice. Investors should conduct their own research and consult with financial professionals before making investment decisions. Financial projections referenced are subject to market conditions and various risk factors. These statements are speculative and subject to change based on market developments.
The EIA's May 2026 Short-Term Energy Outlook forecasts Brent at $89 per barrel in Q4 2026 and $79 per barrel in 2027 under a reopening scenario, while Goldman Sachs and JPMorgan project a range of $110-$142 per barrel for H2 2026 if the closure is prolonged.
As of 12 May 2026, daily laden tanker transits through the Strait of Hormuz have fallen to just 3 ships per day, down from more than 70 before the crisis, with all vessels under 100,000 DWT and carrying mostly Iraqi crude.
Tanker insurance rates have surged above 5% of cargo value, which RBC Capital Markets analyst Helima Croft describes as a de facto blockade enforcer, meaning even if physical transits technically resume, commercial shipping will remain severely restricted until premiums fall significantly.
The three key signals to monitor are daily transit counts (a sustained move above 20 ships per day would indicate meaningful progress), tanker insurance rate movements (a decline in premiums would precede any sustained transit recovery), and IEA emergency meeting outcomes following the already-breached threshold of fewer than 5 transits per day.
US headline CPI reached 3.8% year-on-year in April 2026, with energy prices responsible for more than 40% of the increase, and Bank of America has pushed its Federal Reserve rate cut forecast out to H2 2027, explicitly citing the Iran energy shock as the reason.