Why a Rising AUD Is Quietly Eroding Your International ETF Returns
3 hrs ago
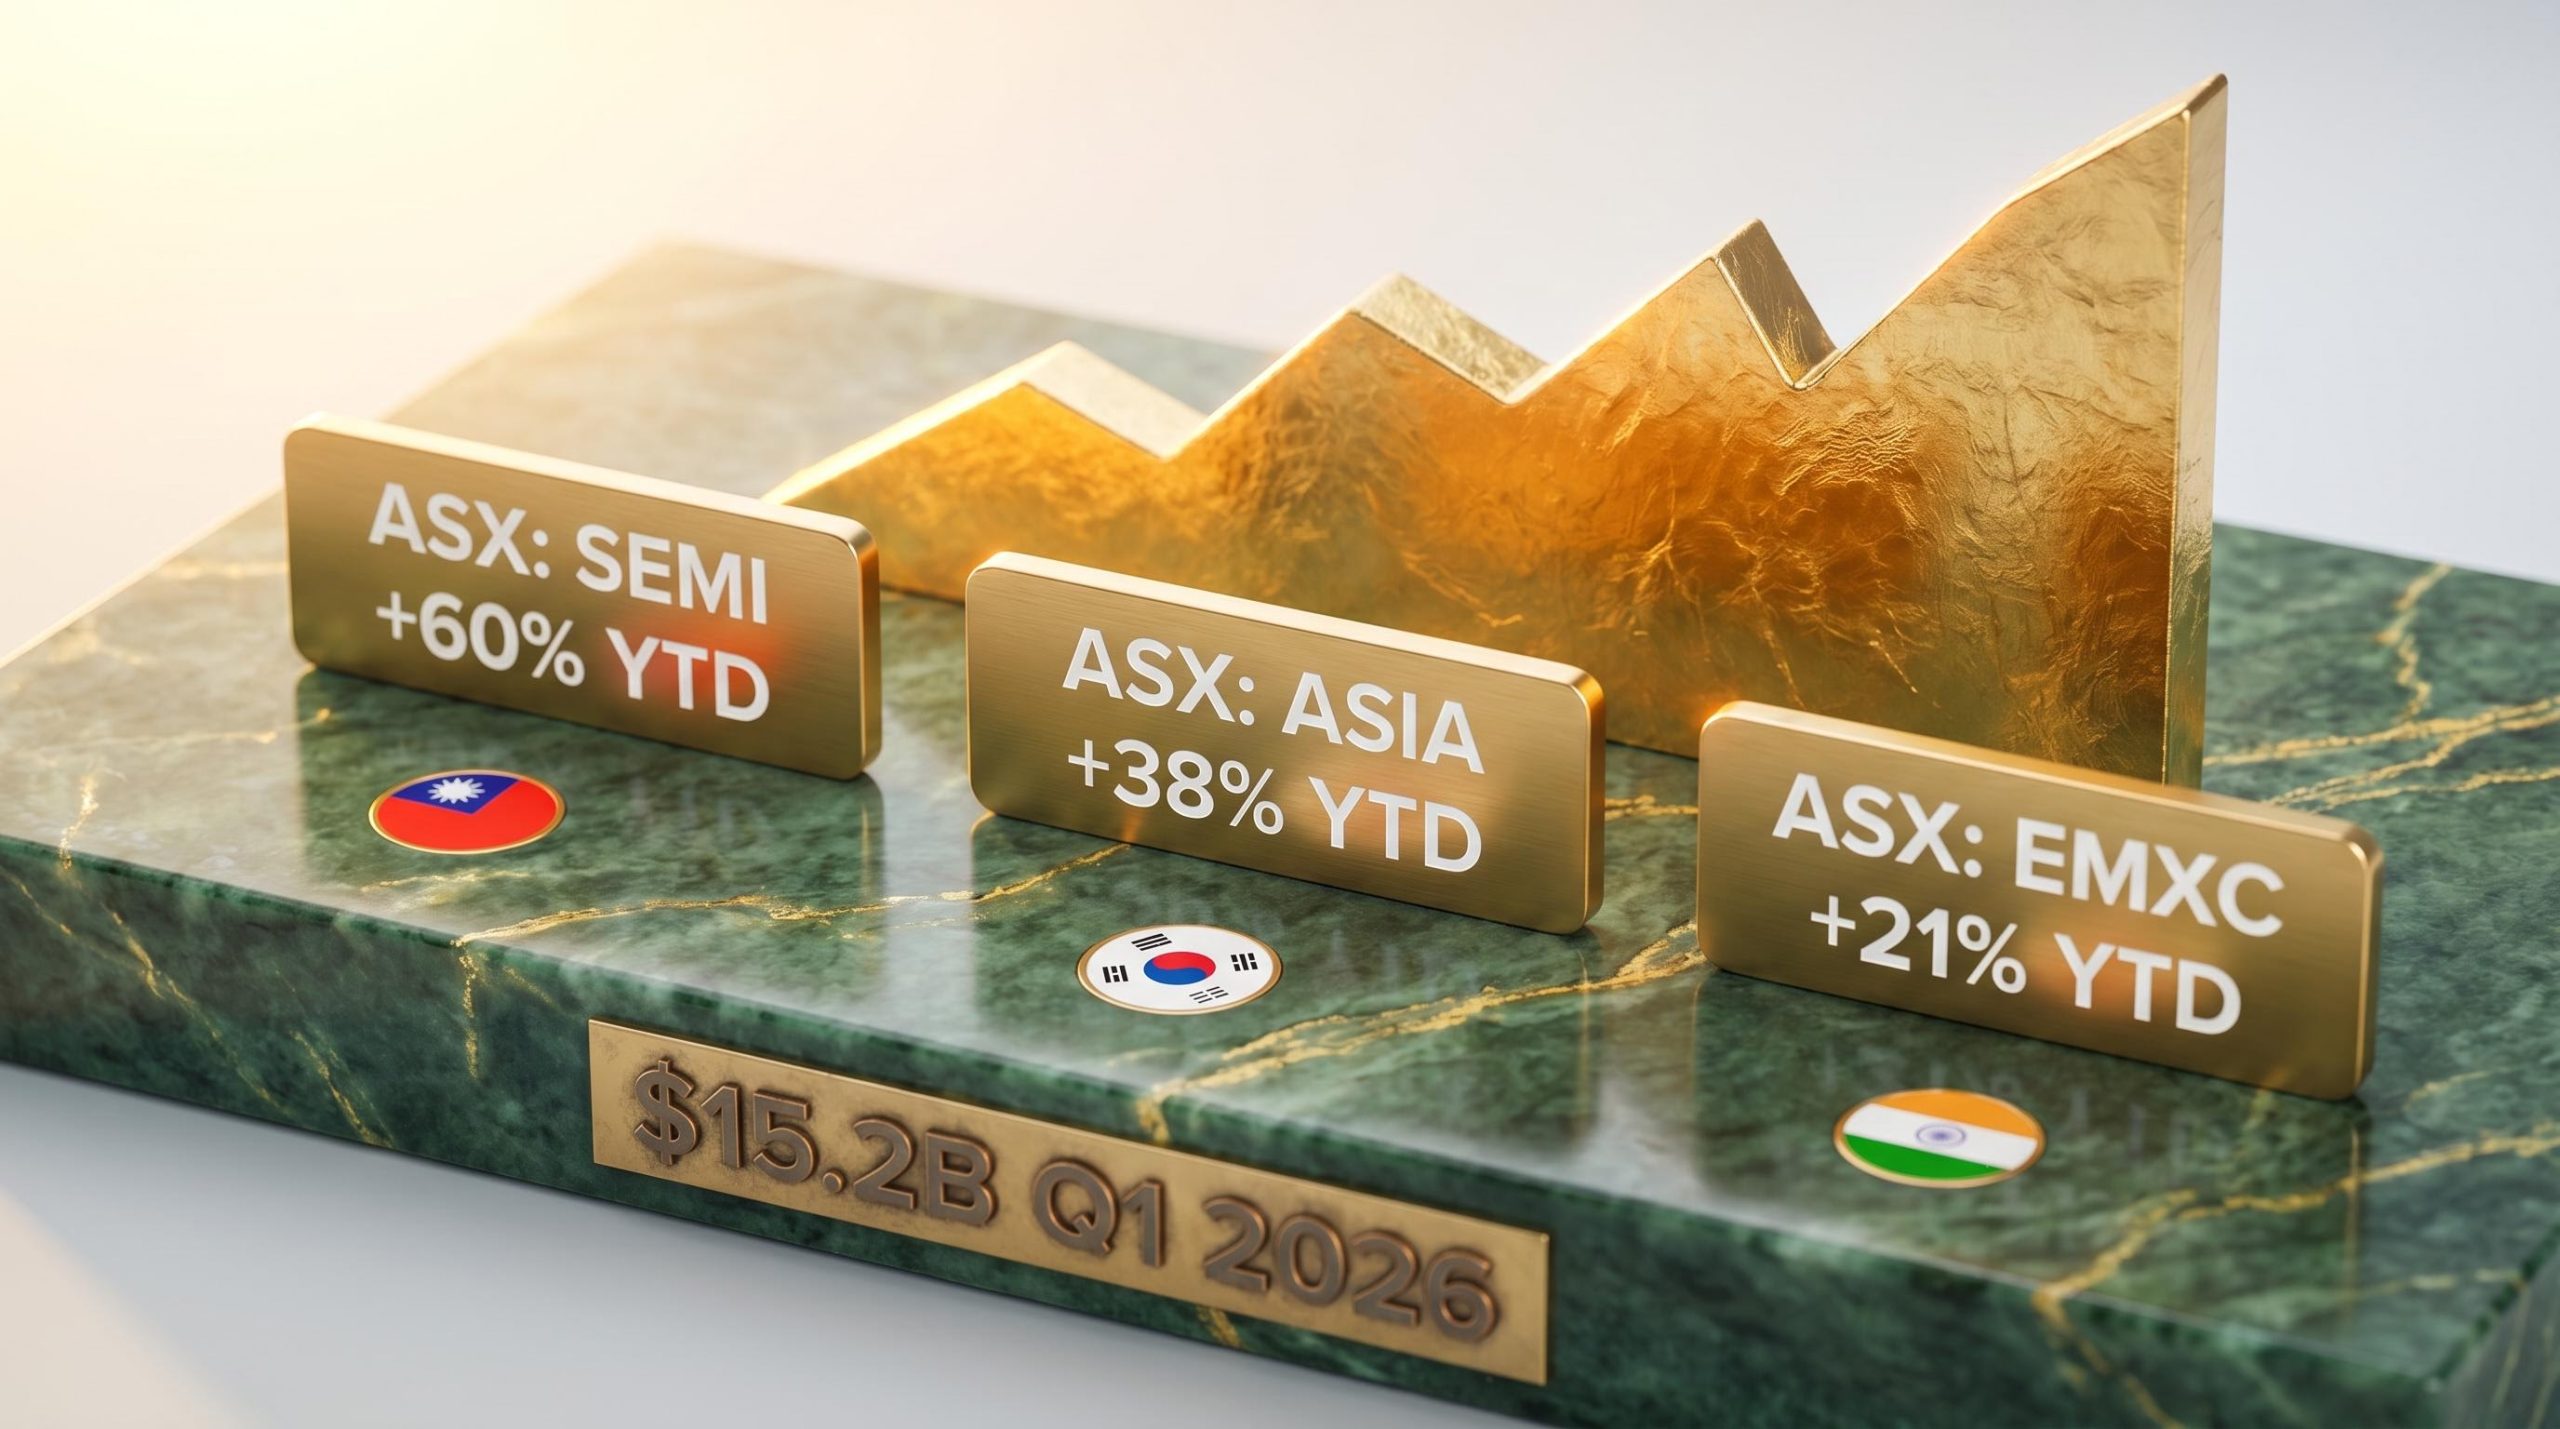
The ASX 200 is down roughly 2.5% over the past month. Three locally listed ETFs, meanwhile, have quietly returned between 21% and 60% year-to-date. The divergence is not a coincidence. The Reserve Bank of Australia’s 2026 rate hikes, persistent inflation, and geopolitical uncertainty have squeezed domestic equities, pushing Australian investors toward international growth themes at a pace the market has not seen before. ASX-listed ETFs pulled in a record $15.2 billion in Q1 2026 alone, according to Vanguard Australia.
This article profiles three ASX-listed ETFs that have significantly outperformed the benchmark in 2026: Global X Semiconductor (ASX: SEMI), BetaShares Asia Technology Tigers (ASX: ASIA), and iShares MSCI Emerging Markets ex China (ASX: EMXC). What follows covers what is driving their gains, what each fund actually holds, and the concentration risks investors need to weigh before buying.
Most Australian investors do not need a foreign brokerage account to access international equities. ASX-listed international ETFs trade in Australian dollars on the local exchange while holding underlying portfolios of overseas companies. That single structural feature removes a layer of cost and complexity that has historically deterred retail participation in global markets.
The practical advantages extend further:
Each of the three funds profiled here passively tracks an index, meaning returns are driven by the underlying holdings rather than active manager decisions. Each also charges an annual management fee (expense ratio), deducted from returns.
ETF cost structures on the ASX range from 0.04% for broad passive funds to well above 0.60% for thematic and sector-specific products, and because fees are deducted from net asset value rather than billed separately, the compounding drag is invisible in any single year but material across a decade-long holding period.
A management expense ratio (MER) is the annual fee a fund charges for managing the portfolio. It is deducted from the fund’s net asset value, not billed separately, so investors do not see a line-item charge.
Across the three funds covered here, MERs range from 0.45% for SEMI to 0.67% for ASIA. The difference looks small in a single year. Over a decade, compounding means that gap widens meaningfully against the same notional return.
SEMI has returned approximately 60% year-to-date and between 133% and 157% over the trailing 12 months, placing it among the highest-performing ASX-listed ETFs over both periods.
The one-year return of 133%-157% ranks SEMI among the strongest performers of any ASX-listed ETF over the period, a reflection of both the semiconductor cycle’s intensity and the fund’s structural exposure to its largest beneficiaries.
The gains trace to specific catalysts. TSMC reported record Q1 2026 earnings with more than 50% net income growth, reinforcing the AI-driven chip demand thesis across data centre, consumer, and industrial segments. NVIDIA’s outlook benefited directly from TSMC’s raised revenue forecast for 2026.
SEMI tracks the Solactive Global Semiconductor 30 Index, which caps individual stocks at 10% per quarterly rebalance. That methodology prevents any single name from dominating the fund, spreading exposure across the semiconductor supply chain from US design leaders to Asian manufacturers.
Geographic exposure is weighted toward the United States at 66.55%, Taiwan at 11.38%, and the Netherlands at 8.30%.
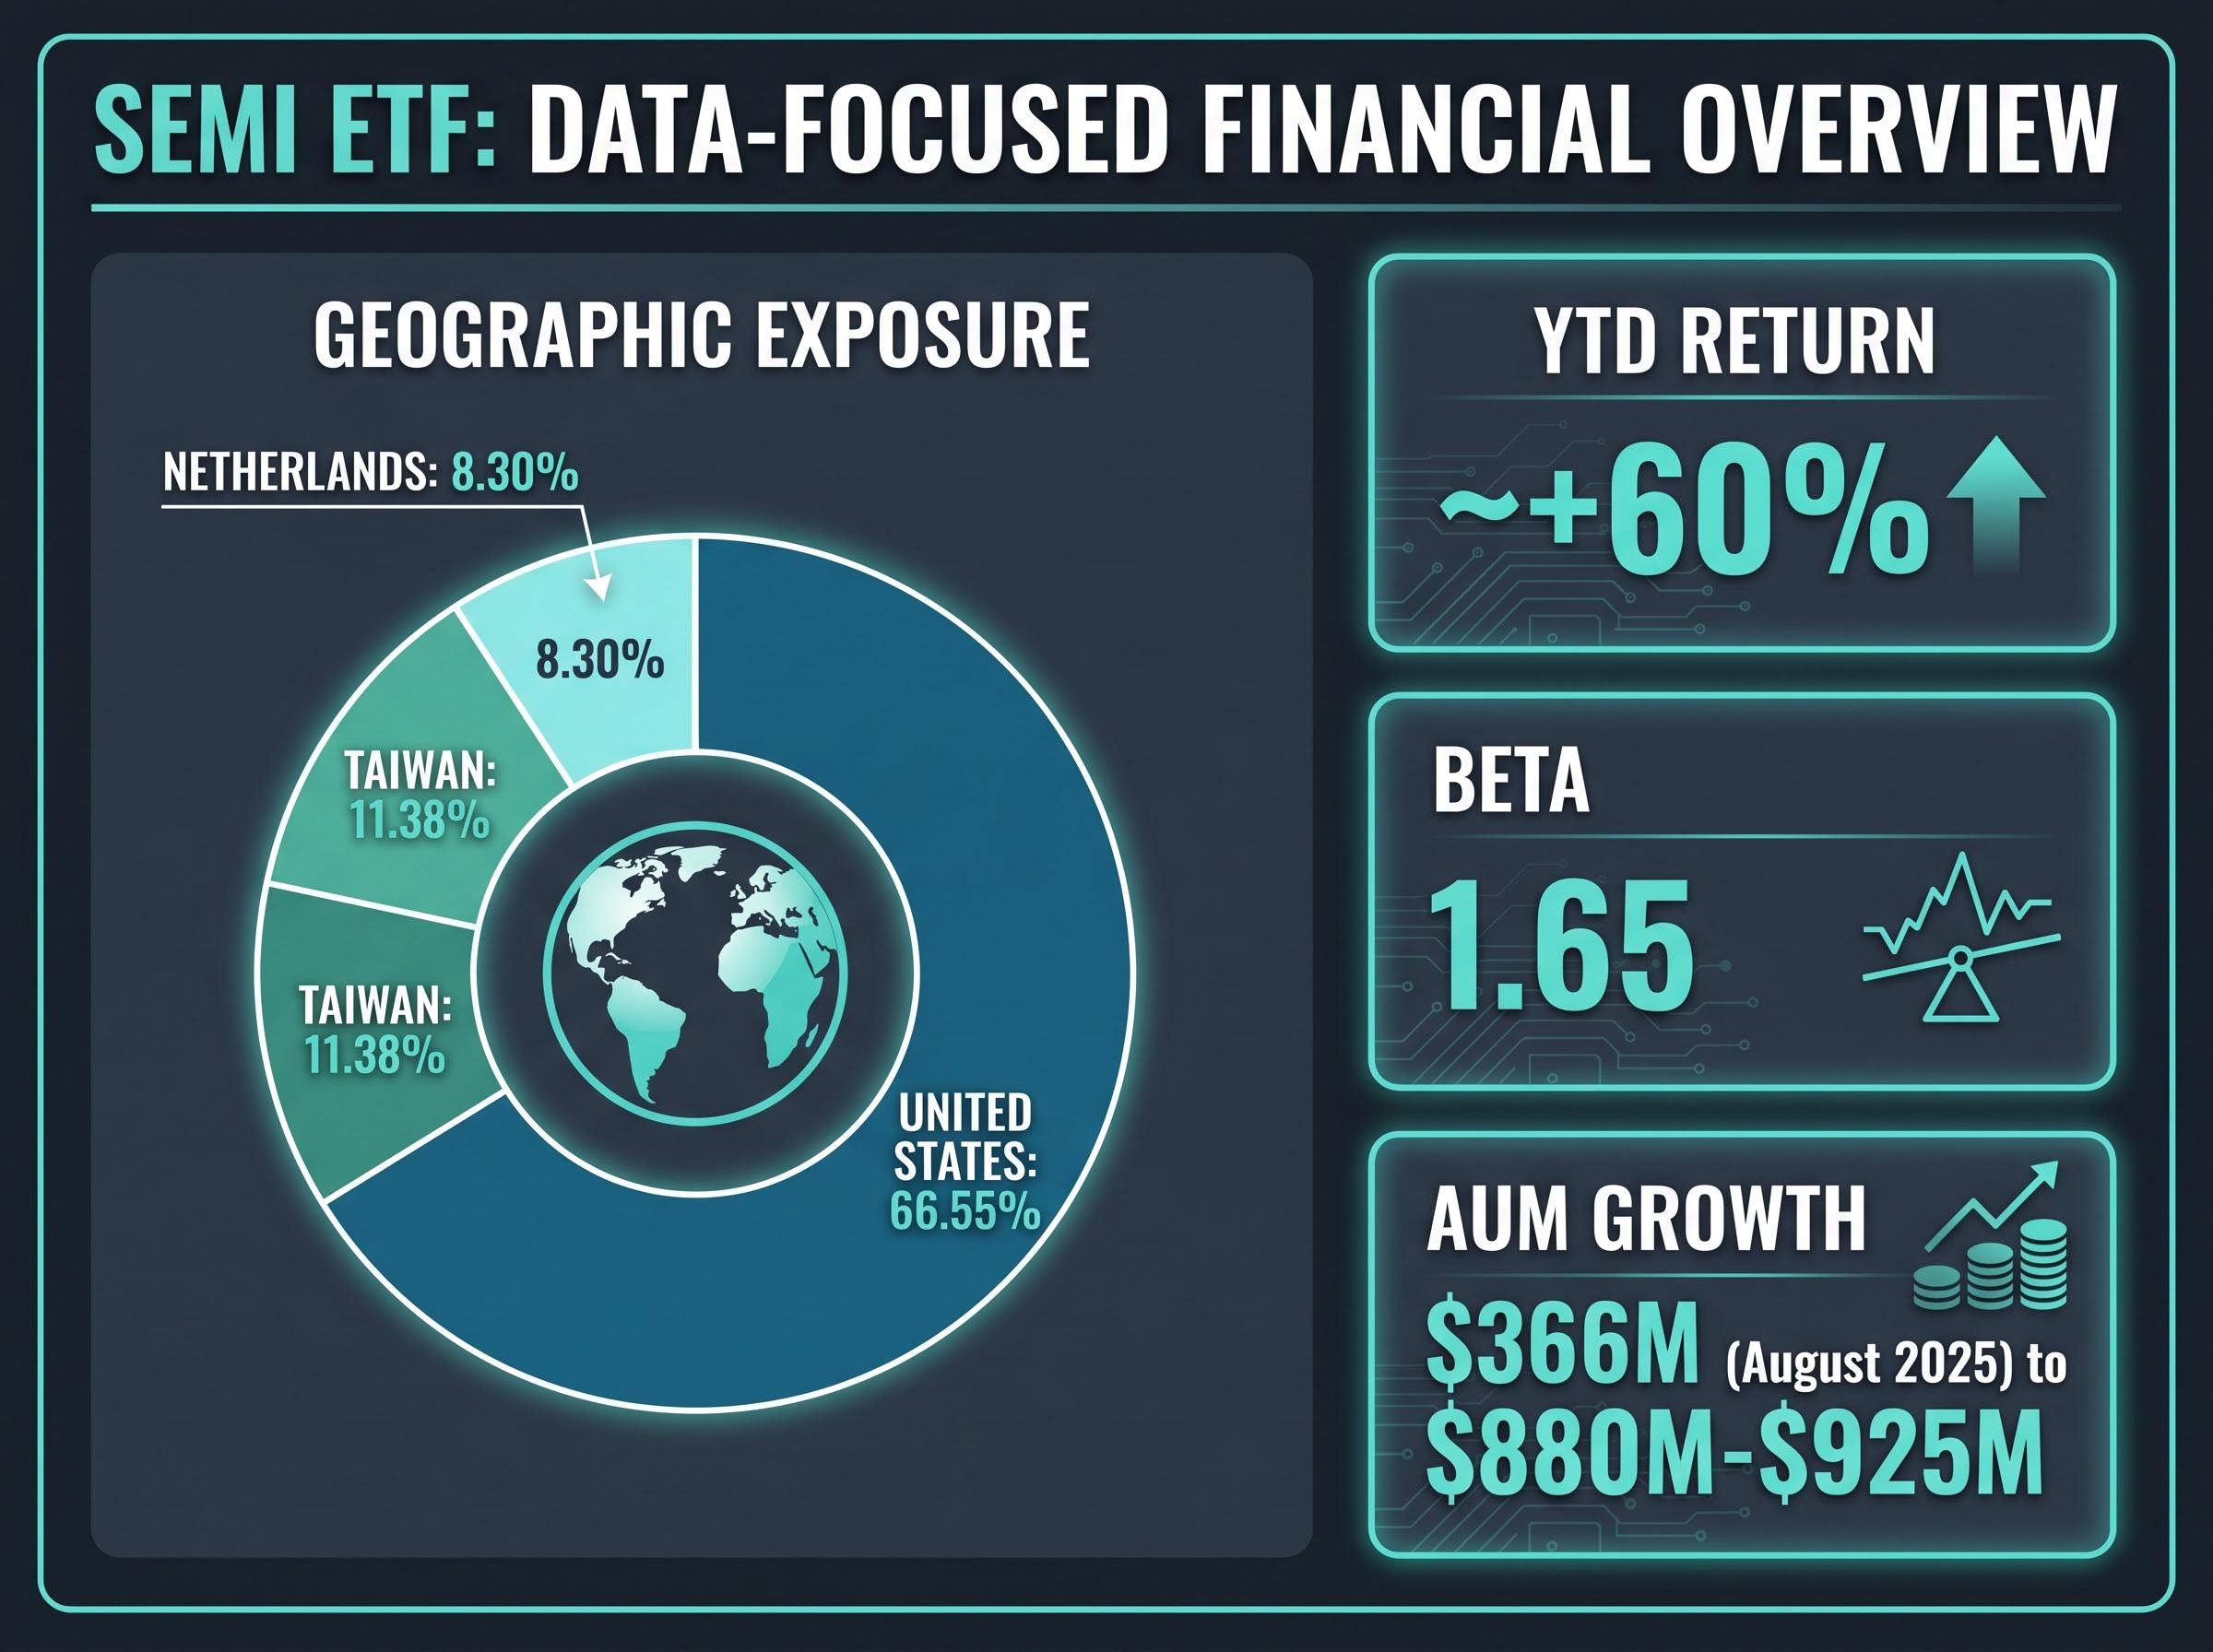
A beta of 1.65 means SEMI has historically moved 65% more than broader market benchmarks in both directions. The rallies are sharp, but the drawdowns can be equally severe.
Taiwan concentration adds a second layer. 11.38% of the portfolio sits in Taiwanese names, primarily TSMC. Any escalation in cross-strait tensions could disproportionately affect fund value, a risk that the Solactive index’s 10% cap per stock moderates but does not eliminate.
ASIA returned more than 90% over the trailing 12 months and approximately 38% year-to-date by mid-May 2026. Those figures reflect a regional technology rally that followed its own trajectory, distinct from the US-led AI trade.
The fund tracks the Solactive Asia Ex-Japan Technology and Internet Tigers Index, holding the 50 largest technology and online retail companies in Asia excluding Japan. That composition gave it direct exposure to the South Korean chipmakers, including Samsung, and Taiwanese semiconductor names that hit record highs by early May 2026, according to Bloomberg.
The semiconductor concentration within ASIA is more acute than its regional mandate suggests: SK Hynix and Samsung together account for over 37% of the portfolio, meaning the fund functions primarily as a concentrated bet on Asia’s chip supply chain rather than a diversified pan-Asian growth play.
For investors who already hold US technology exposure, ASIA offers a complementary position in the Asian technology cycle. Its holdings cover names with limited representation on the ASX or in US-focused portfolios.
Official BetaShares data as of 30 April 2026 shows a one-month return of +22.67%, a one-year return of +71.60%, and a three-year annualised return of +36.52% p.a.
Unlike EMXC, ASIA includes Hong Kong and mainland Chinese technology companies within its index. Chinese regulatory actions on the technology sector remain a residual risk for the fund.
Chinese regulatory conditions on tech IPOs showed signs of easing in 2026, contributing positively to ASIA’s recent performance. That easing, however, remains subject to reversal. Investors holding ASIA are accepting exposure to Beijing’s regulatory posture alongside the fund’s broader Asian technology thesis.
EMXC tracks the MSCI Emerging Markets ex China Index. The fund’s defining design choice is in its name: it explicitly excludes Chinese equities, insulating it from Chinese regulatory and delisting risk while retaining full exposure to Taiwan, South Korea, and India.
That structural decision shaped the fund’s 2026 performance directly. The country tilts that delivered returns are precisely the ones the ex-China mandate preserved.
| Country | Portfolio Weight |
|---|---|
| Taiwan | 32.6% |
| South Korea | 23.9% |
| India | 15.4% |
| Other emerging markets | 28.1% |
Taiwan’s semiconductor sector, South Korean chipmakers, and India’s technology services and commodity exporters each contributed to the fund’s year-to-date gain of more than 21% (with the US-listed proxy iShares EMXC showing approximately +32.94%, directionally consistent).
EMXC presents as the lower-volatility entry point into the emerging markets growth theme compared to SEMI, with a more diversified geographic base. ASX-specific AUM and expense ratio data were not confirmed from the official BlackRock Australia source during the research period; investors should check the BlackRock Australia Product Disclosure Statement directly.
Excluding China removes direct exposure to Chinese-listed and Hong Kong-listed Chinese companies. It does not eliminate geopolitical risk. Taiwan accounts for 32.6% of the portfolio, making Taiwan-China relations the single largest risk variable for the fund. The ex-China label addresses regulatory and delisting risk from Beijing; it does not address the cross-strait concentration that dominates the fund’s country weighting.
The three funds share a common tailwind, the global semiconductor and technology cycle, but sit at different points on the risk-return spectrum.
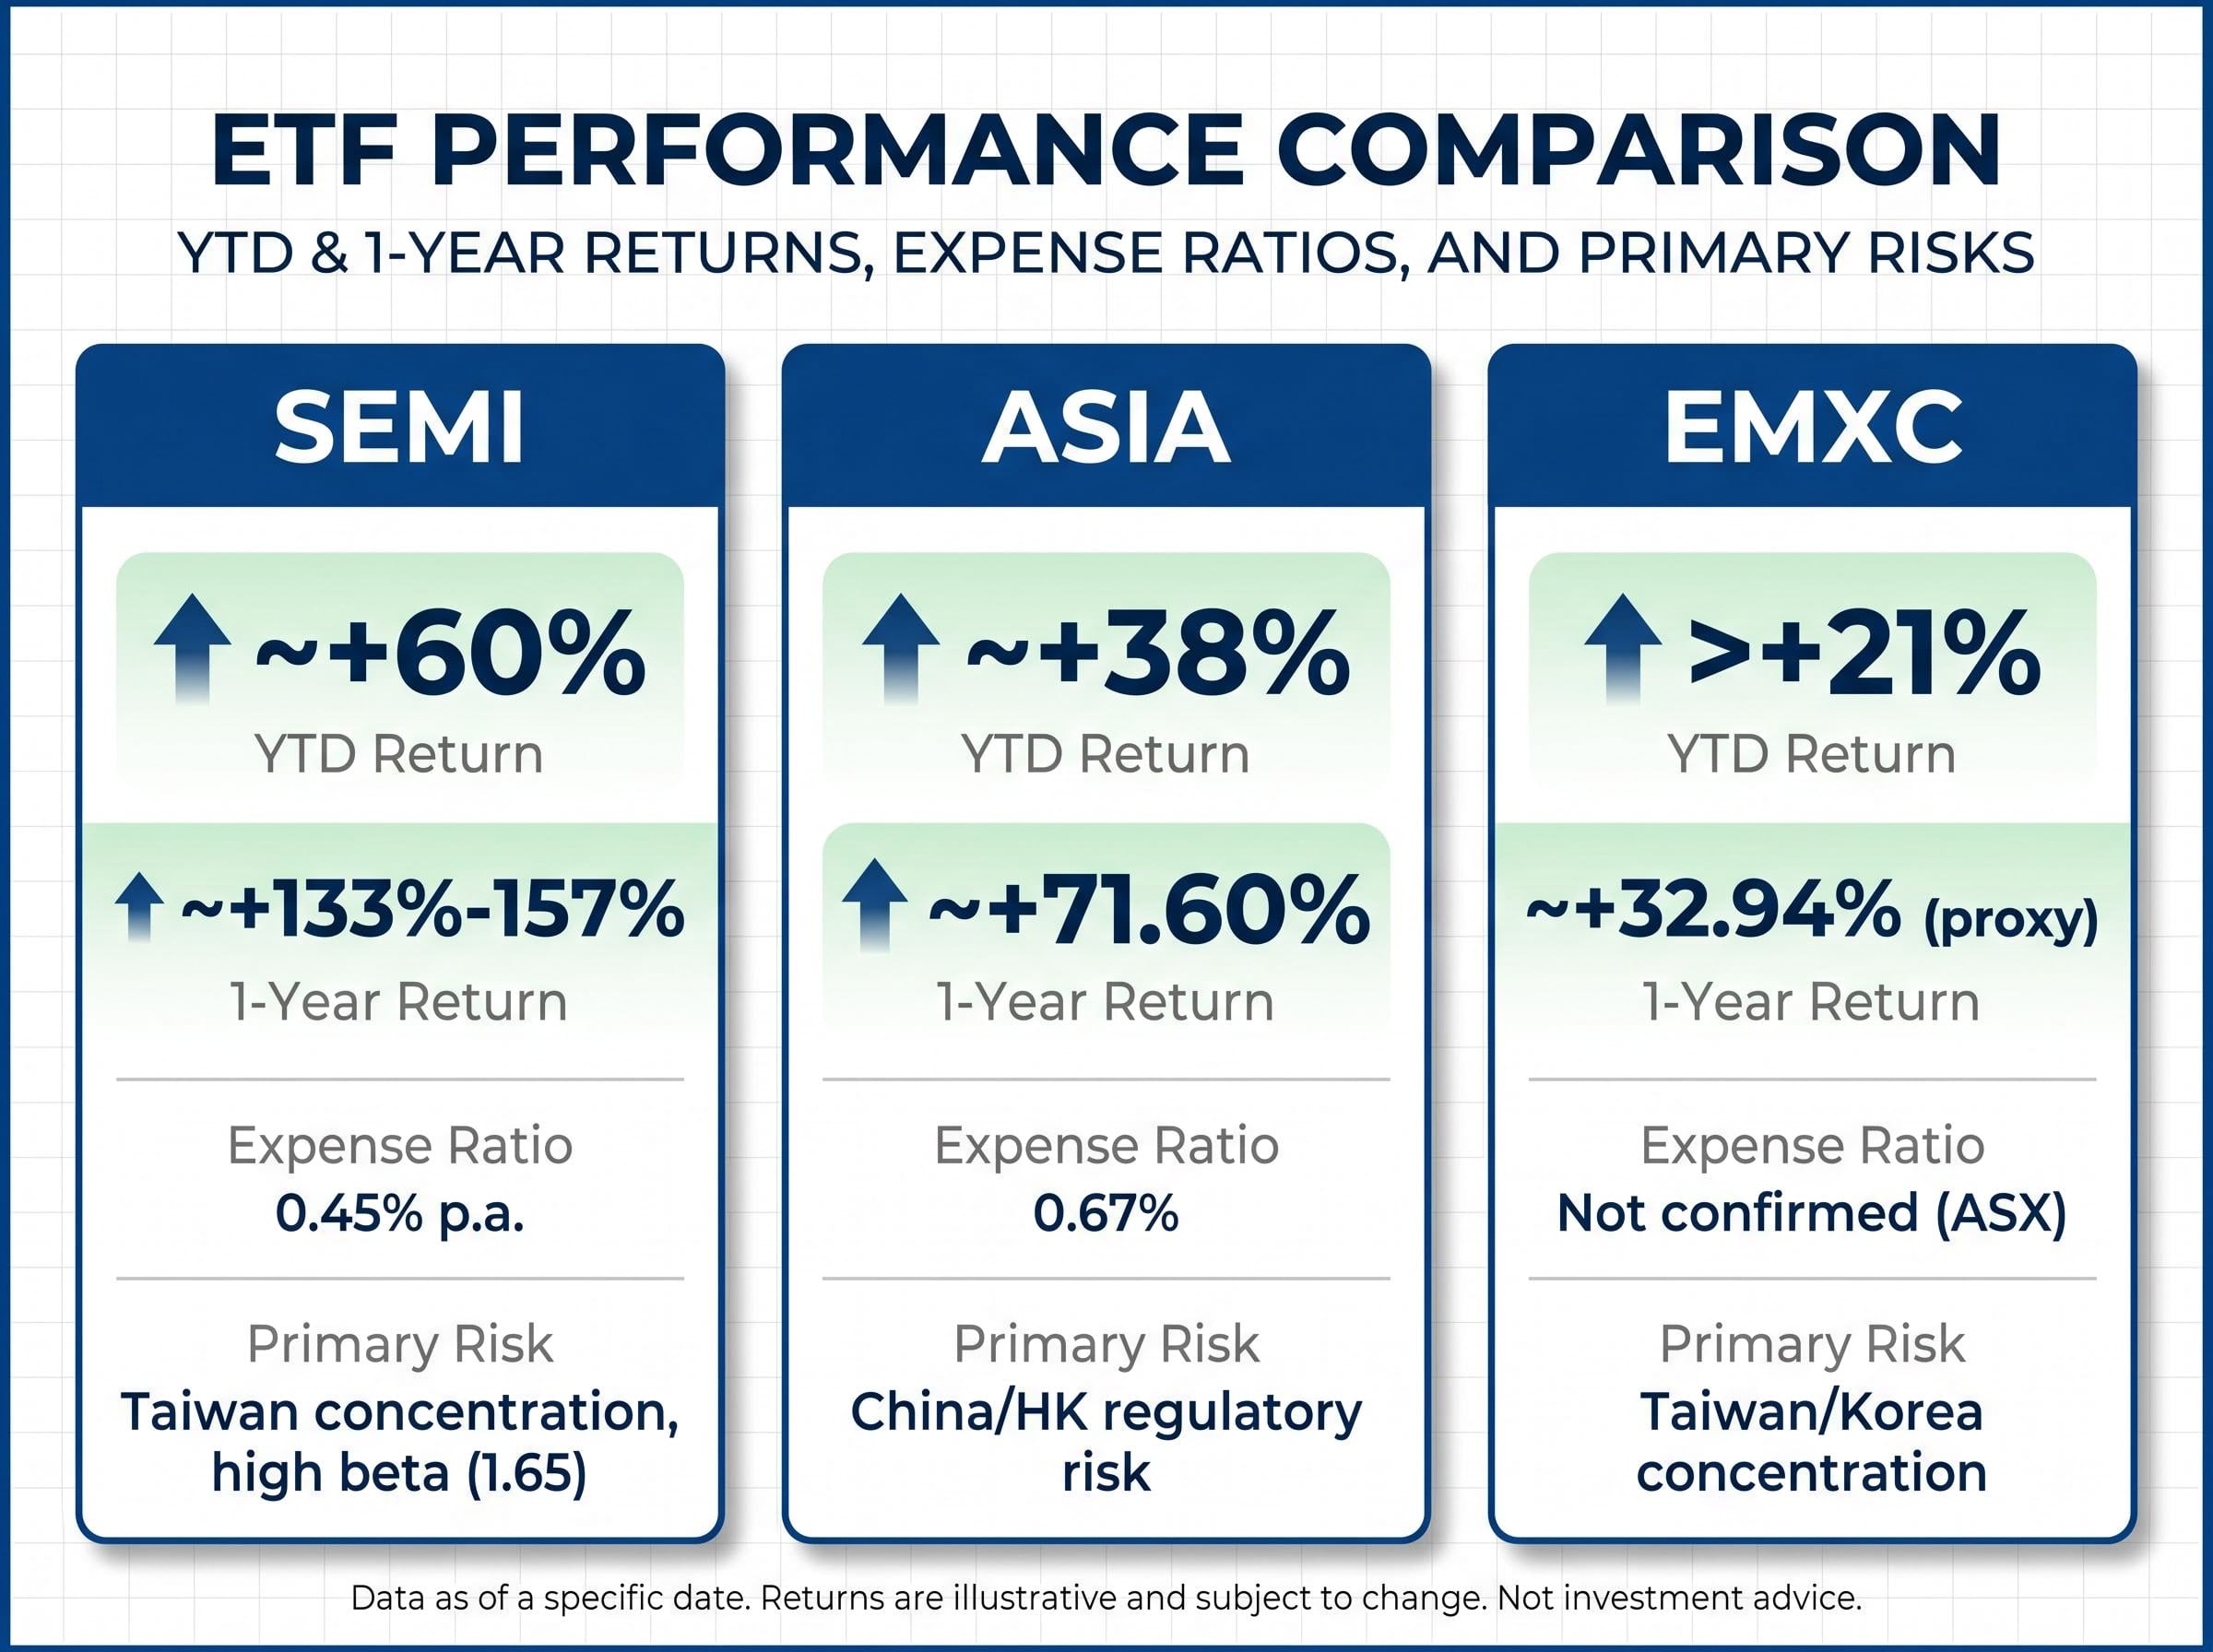
| Fund | YTD Return | 1-Year Return | Expense Ratio | Primary Risk |
|---|---|---|---|---|
| SEMI | ~+60% | ~+133%-157% | 0.45% p.a. | Taiwan concentration, high beta (1.65) |
| ASIA | ~+38% | ~+71.60% | 0.67% | China/HK regulatory risk |
| EMXC | >+21% | ~+32.94% (proxy) | Not confirmed (ASX) | Taiwan/Korea concentration |
SEMI offers the highest return and the highest volatility. ASIA provides the broadest Asian technology exposure, with China included. EMXC delivers the widest geographic diversification within the emerging markets theme while deliberately sidestepping Chinese regulatory risk.
The return dispersion across ASX Asia ETFs in the past year exceeded 46 percentage points, a gap that reflects fundamentally different index construction and sector exposures rather than simple geographic positioning, and one that matters directly when deciding whether ASIA’s concentrated technology mandate is the right fit against lower-cost, broader alternatives.
EMXC’s AUM and expense ratio could not be confirmed from official BlackRock Australia sources during the research period. Investors considering this fund should verify current details via the issuer’s Product Disclosure Statement.
Past performance does not guarantee future results. Financial projections are subject to market conditions and various risk factors.
The three structural drivers behind these funds’ outperformance, AI-driven semiconductor demand, Asia’s technology cycle, and RBA-driven reallocation from domestic equities, remain active themes in mid-2026. Valuations, however, are materially higher than they were at the start of the year.
The shared risk across all three funds is Taiwan semiconductor concentration. It features directly in SEMI and EMXC and indirectly in ASIA via Korean and Taiwanese chipmakers. Any investor allocating to these funds is, to varying degrees, making a bet on the continued stability of the Taiwan semiconductor supply chain.
Investors should review each fund’s Product Disclosure Statement (Global X, BetaShares, BlackRock Australia) before investing, and consider how these funds fit within an overall portfolio rather than treating any single ETF as a standalone allocation.
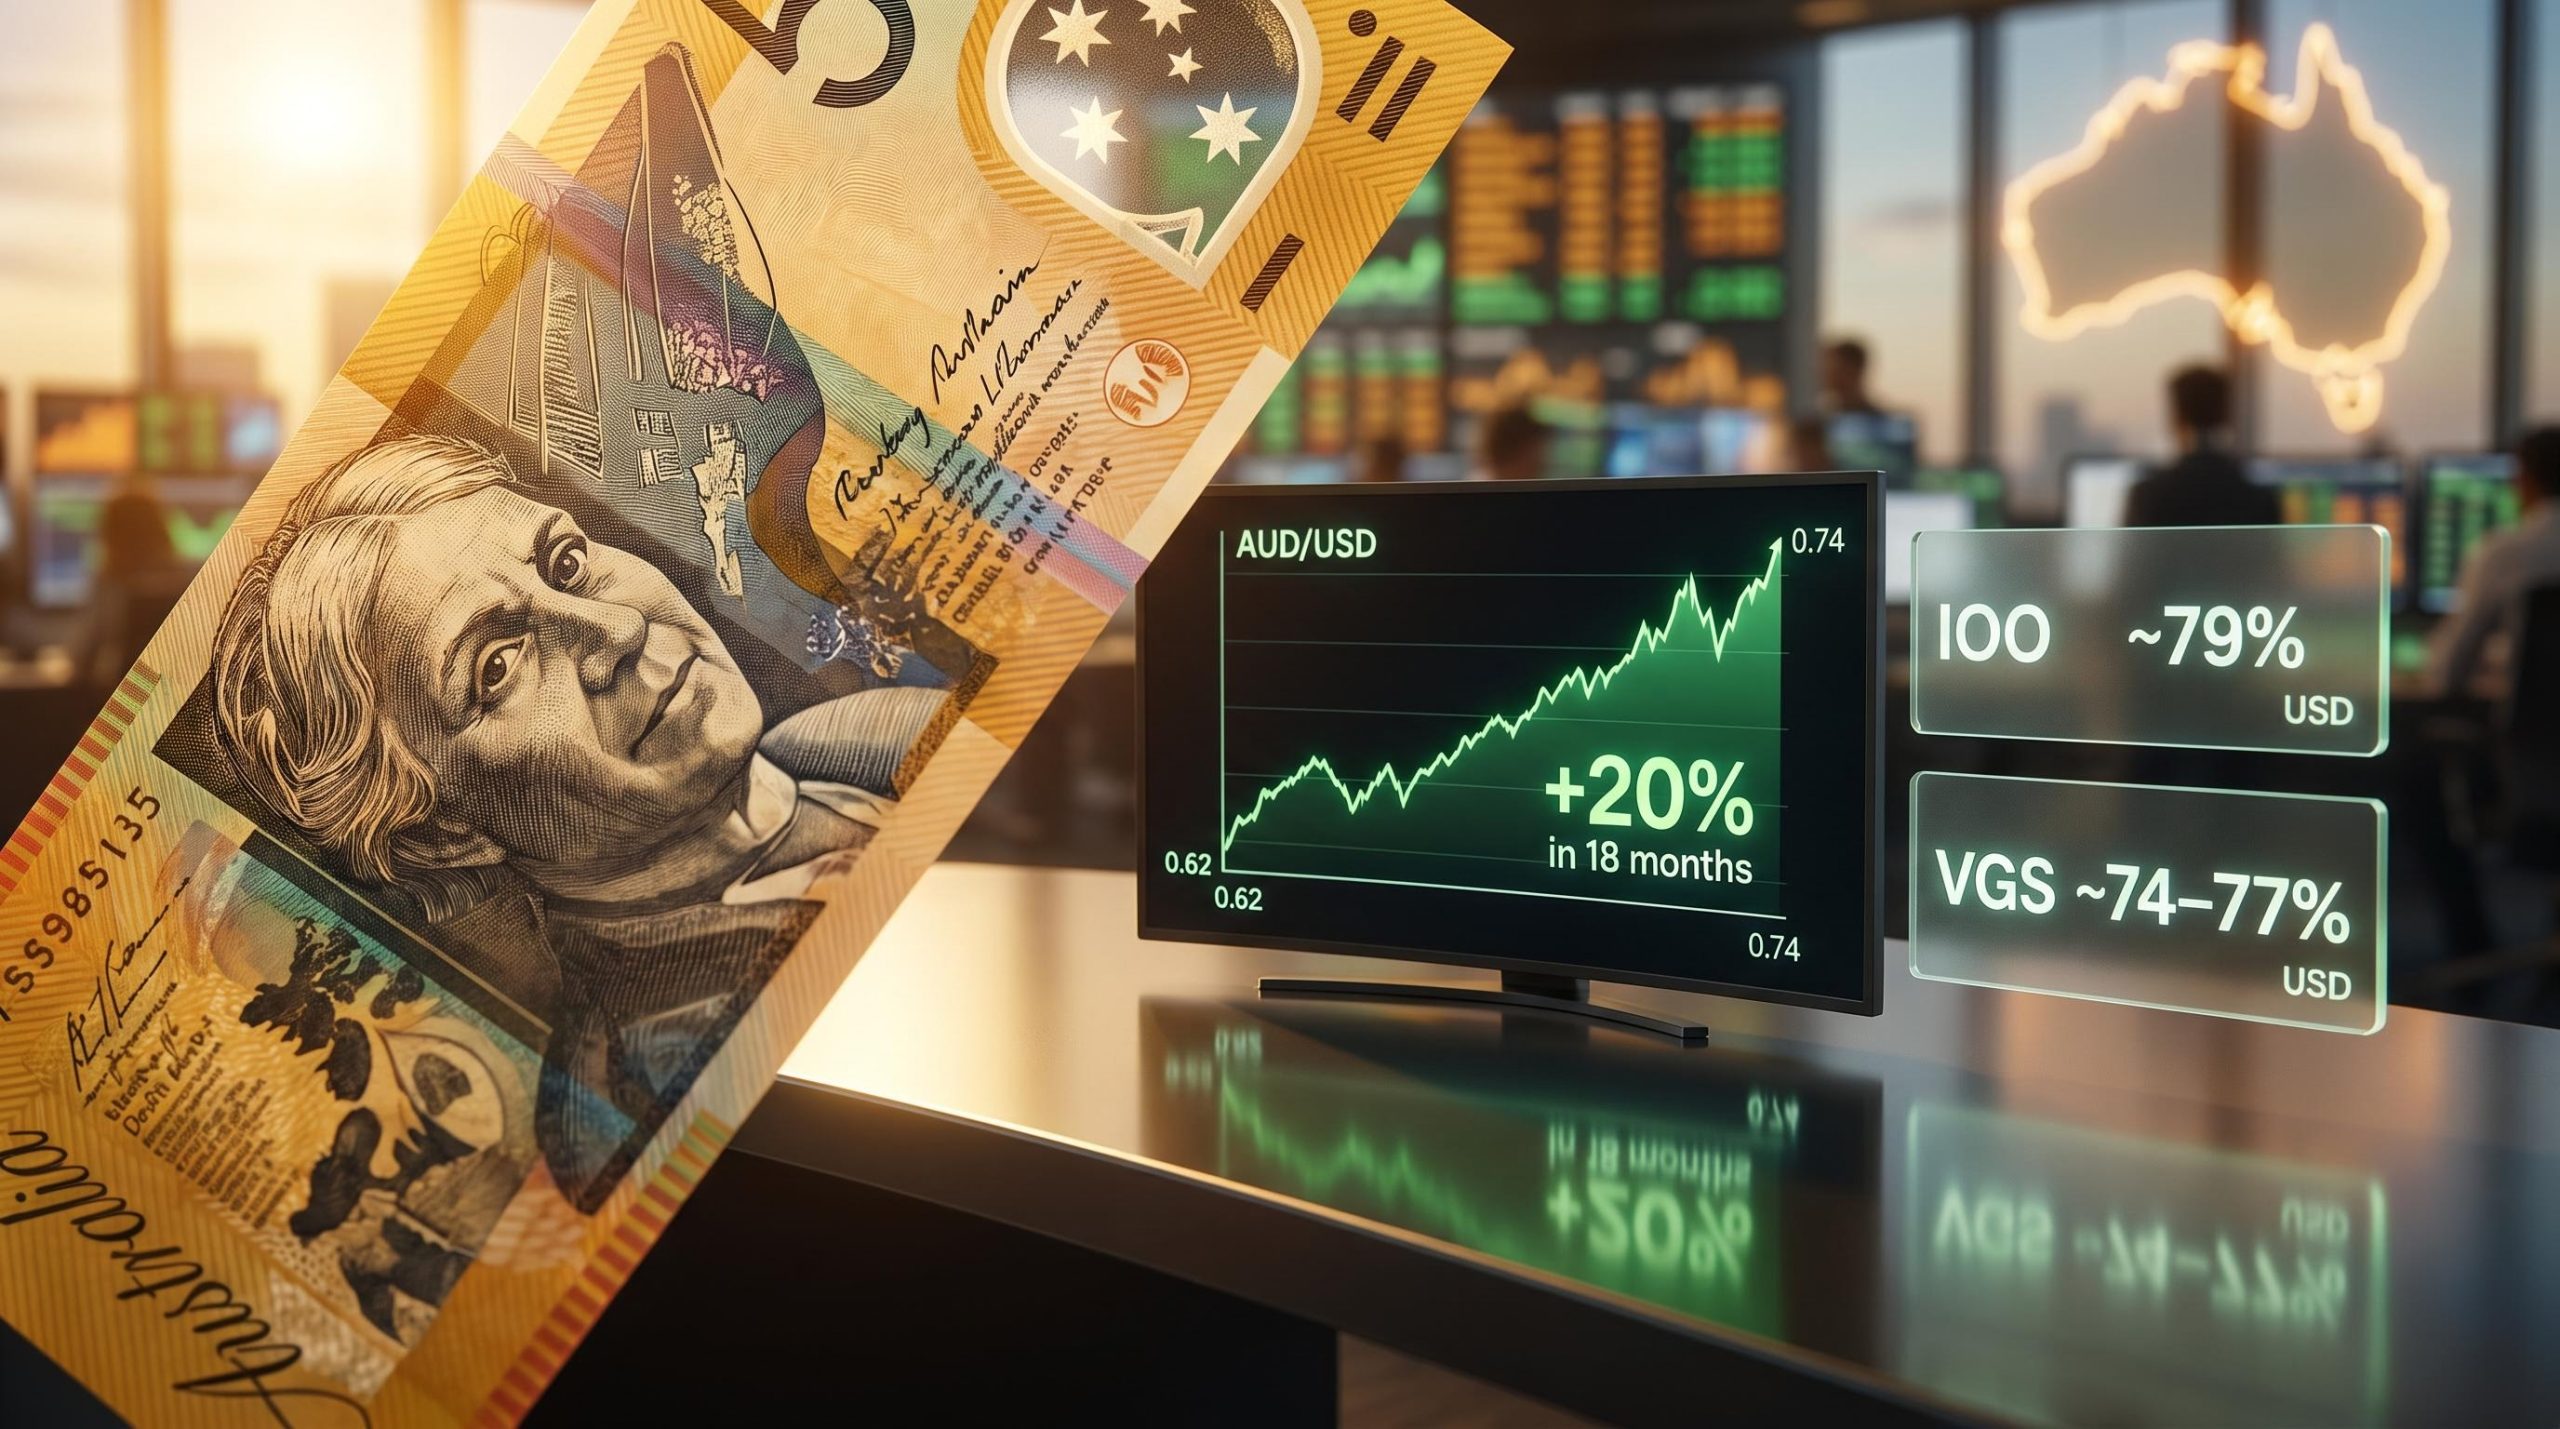
For investors ready to think beyond individual thematic positions and assemble a complete multi-asset structure, our full guide to building a global ETF portfolio on the ASX compares VGS, IVV, and IXI across costs, return profiles, and tax treatment, covering how to construct a core-satellite allocation that can hold these higher-volatility thematic funds without overstating overall risk.
This article is for informational purposes only and should not be considered financial advice. Investors should conduct their own research and consult with financial professionals before making investment decisions.
The three standout performers in 2026 are Global X Semiconductor (ASX: SEMI) with approximately 60% year-to-date returns, BetaShares Asia Technology Tigers (ASX: ASIA) with approximately 38%, and iShares MSCI Emerging Markets ex China (ASX: EMXC) with more than 21%, all significantly outperforming the ASX 200 which is down roughly 2.5% over the past month.
ASX-listed international ETFs trade in Australian dollars on the local exchange while holding underlying portfolios of overseas companies, meaning Australian investors can access global markets through any domestic broker without opening a foreign brokerage account or completing US withholding tax paperwork.
A management expense ratio (MER) is the annual fee deducted from a fund's net asset value to cover portfolio management costs; across SEMI, ASIA, and EMXC, MERs range from 0.45% to 0.67% per annum, and while the difference appears small in a single year, the compounding effect widens meaningfully over a decade-long holding period.
Ex-China means the fund explicitly excludes Chinese-listed and Hong Kong-listed Chinese companies, insulating investors from Chinese regulatory and delisting risk, though it does not eliminate geopolitical risk since Taiwan accounts for 32.6% of the portfolio and cross-strait tensions remain a key risk variable.
The primary shared risk across all three funds is Taiwan semiconductor concentration: SEMI and EMXC hold Taiwanese names directly, while ASIA carries indirect exposure through Korean and Taiwanese chipmakers, meaning any disruption to the Taiwan semiconductor supply chain could negatively affect all three funds.