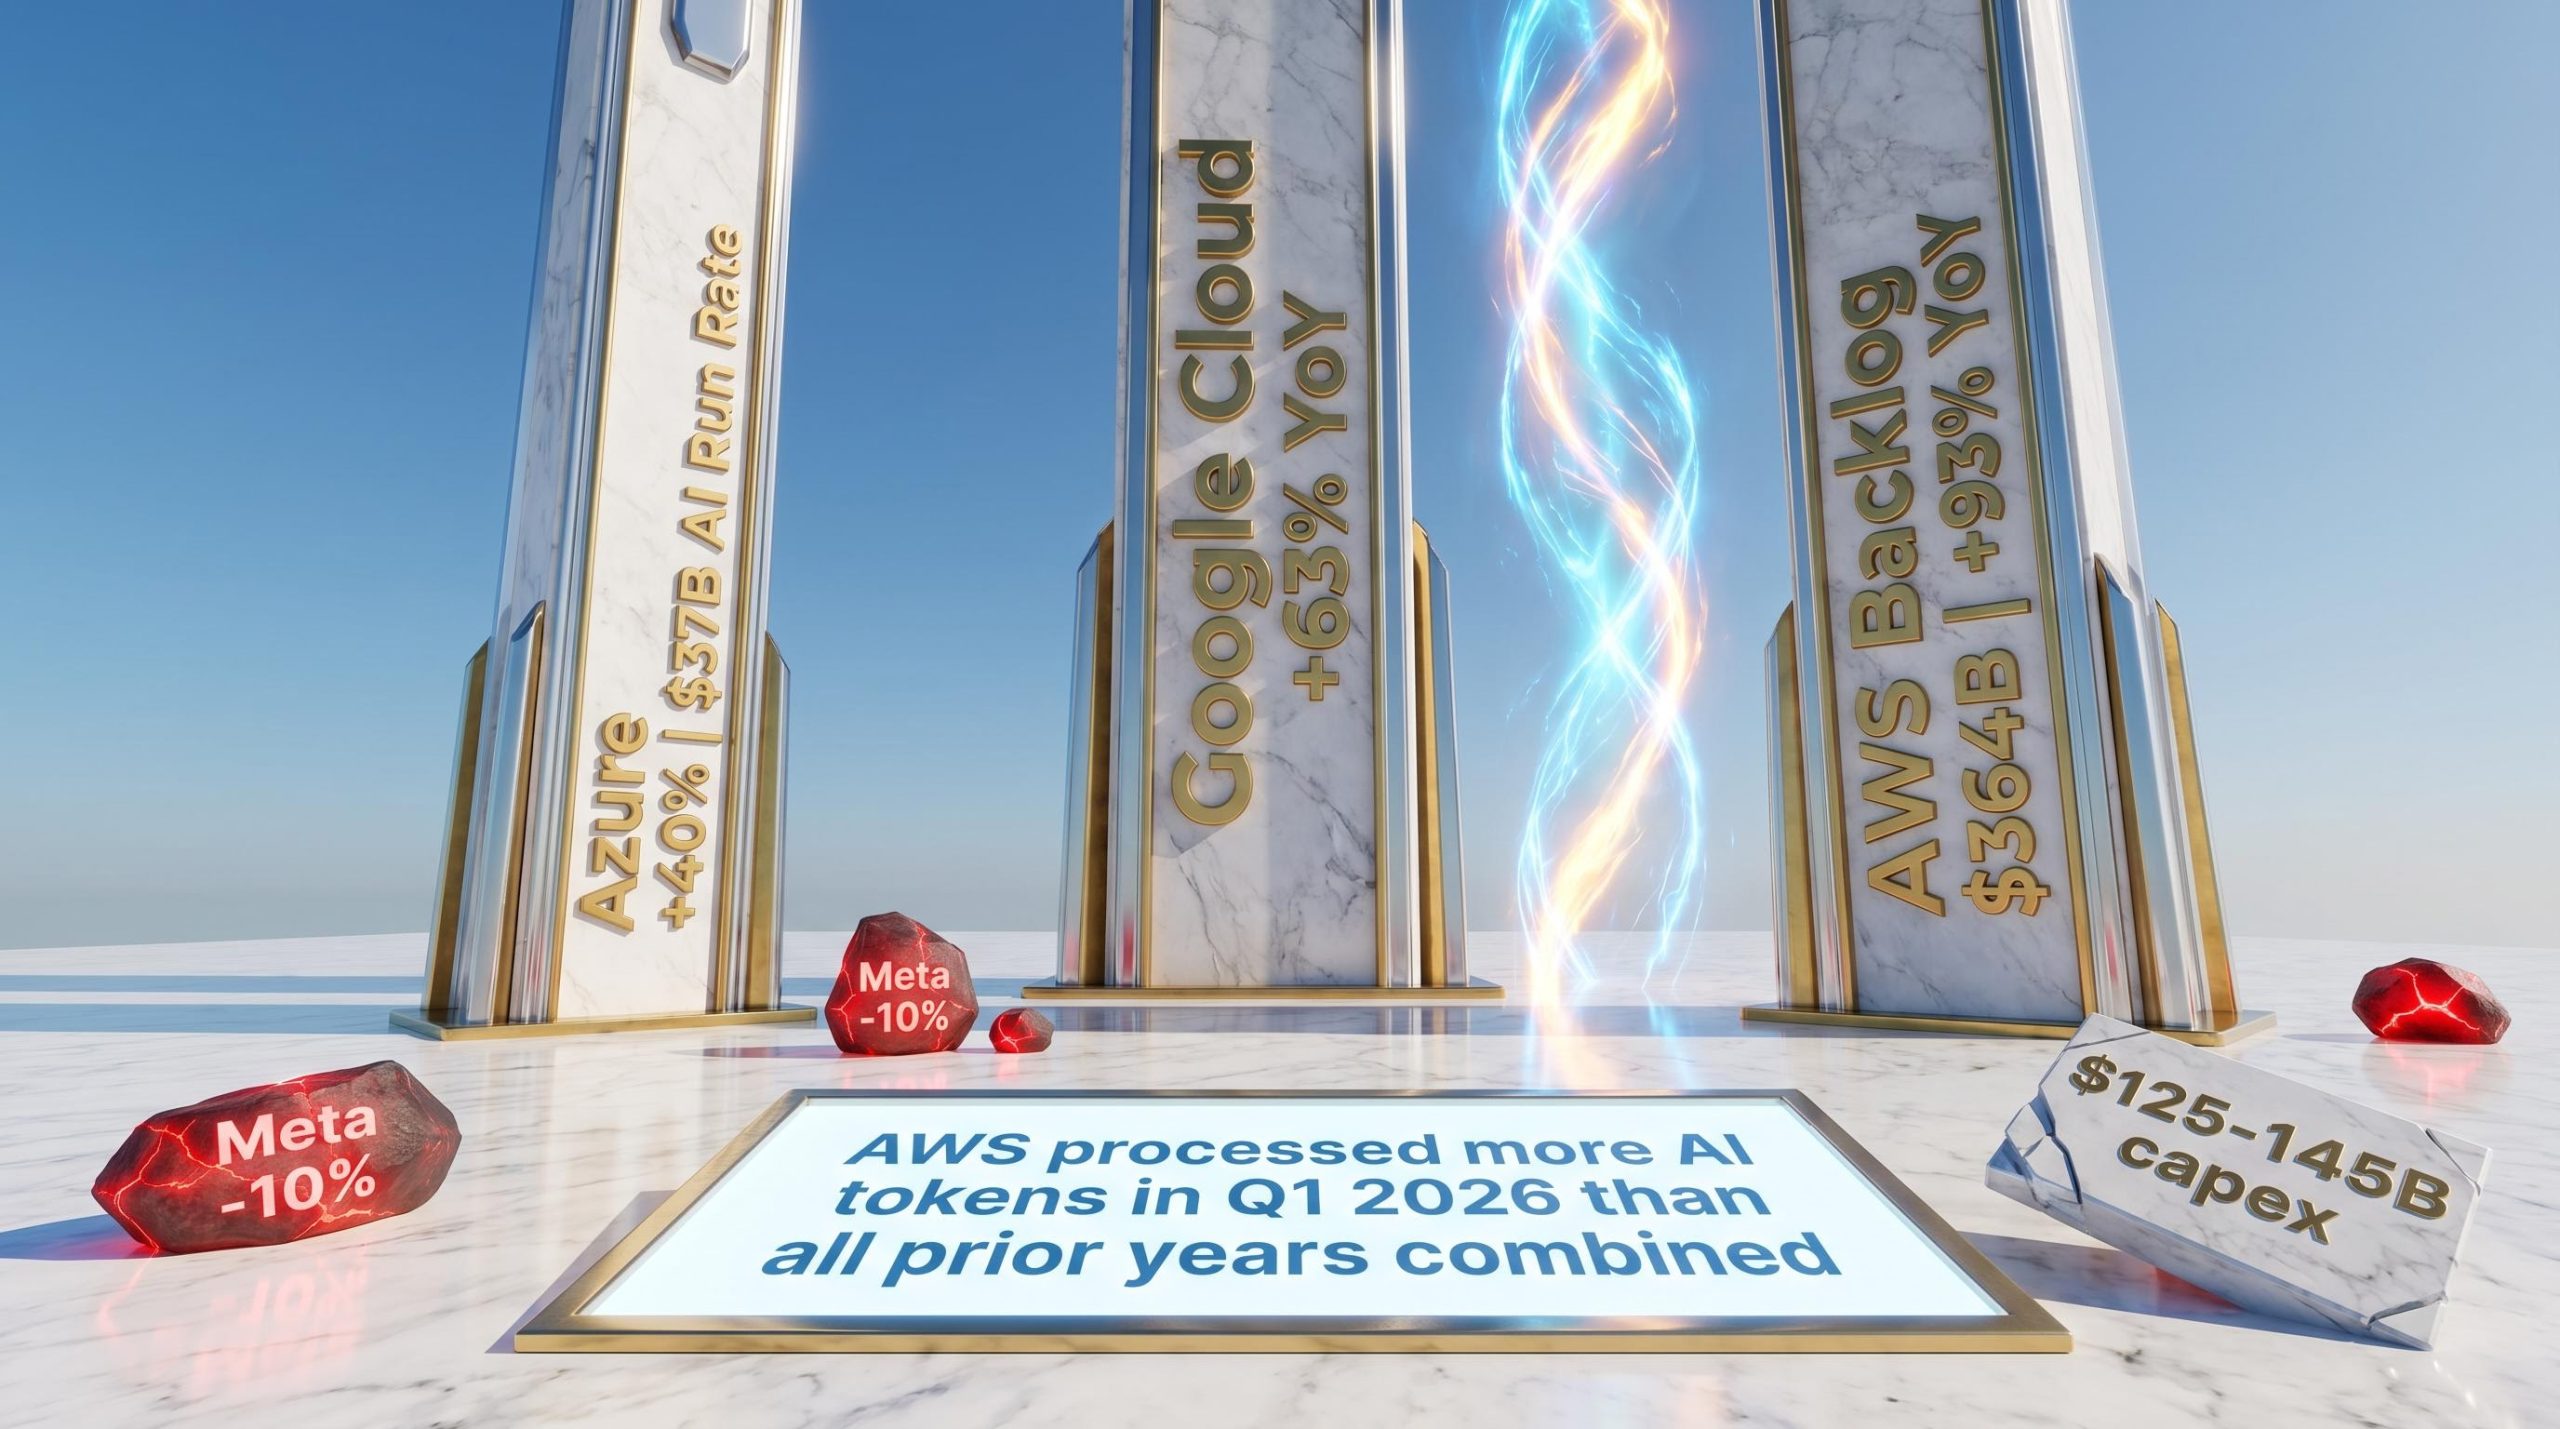
Amazon Web Services processed more AI tokens in Q1 2026 than in all prior years of operation combined. That single data point captures both the scale and the urgency of what the latest hyperscaler earnings cycle is telling investors about AI infrastructure investment. Alphabet, Microsoft, and Amazon all reported results during the same week in early May 2026. The headline numbers were strong: Google Cloud up 63% year-over-year, Azure growing 40%, Amazon’s operating income reaching $23.9 billion. But beneath the top-line growth, a more complicated picture is emerging around capital allocation, profitability quality, and which companies are genuinely pulling ahead in the AI infrastructure race versus which are spending at a pace that unnerves investors. This analysis breaks down what the Q1 2026 results reveal about competitive positioning, explains why Meta’s spending disclosure spooked markets while Alphabet’s did not, and identifies the profitability distortion that Goldman Sachs analysts flagged as a serious risk to how investors read these numbers.
The cloud numbers that define the AI infrastructure race right now
The growth gap between the three major cloud providers tells a sharper story than any single headline figure.
Google Cloud grew 63% year-over-year in Q1 2026, more than doubling its Q1 2025 pace of 28%. Azure came in at 40%, modestly above analyst consensus of approximately 39%, with Microsoft’s AI business reaching a $37 billion annual run rate. AWS posted operating income of $23.9 billion for Amazon’s total business, while its backlog surged 93% year-over-year to approximately $364 billion. Amazon’s AI chip annual run rate hit $20 billion.
“Amazon Web Services processed more AI tokens in Q1 2026 than in all prior years of operation combined.”
Google Cloud’s growth rate is particularly striking because it outpaces both peers by a wide margin from a smaller but fast-scaling base, suggesting Alphabet is capturing a disproportionate share of new AI workload commitments. Google Search also recorded its highest-ever query volume during the quarter, contradicting narratives that AI would cannibalise traditional search demand.
The current earnings cycle sits inside a broader context: the AI investment boom has pushed US IT hardware and software spending to 4.9% of GDP in Q1 2026, surpassing both the dot-com era peak of approximately 4.2% and the cloud buildout peak, a structural backdrop that explains why hyperscalers are committing capital at a pace that would have been unimaginable three years ago.
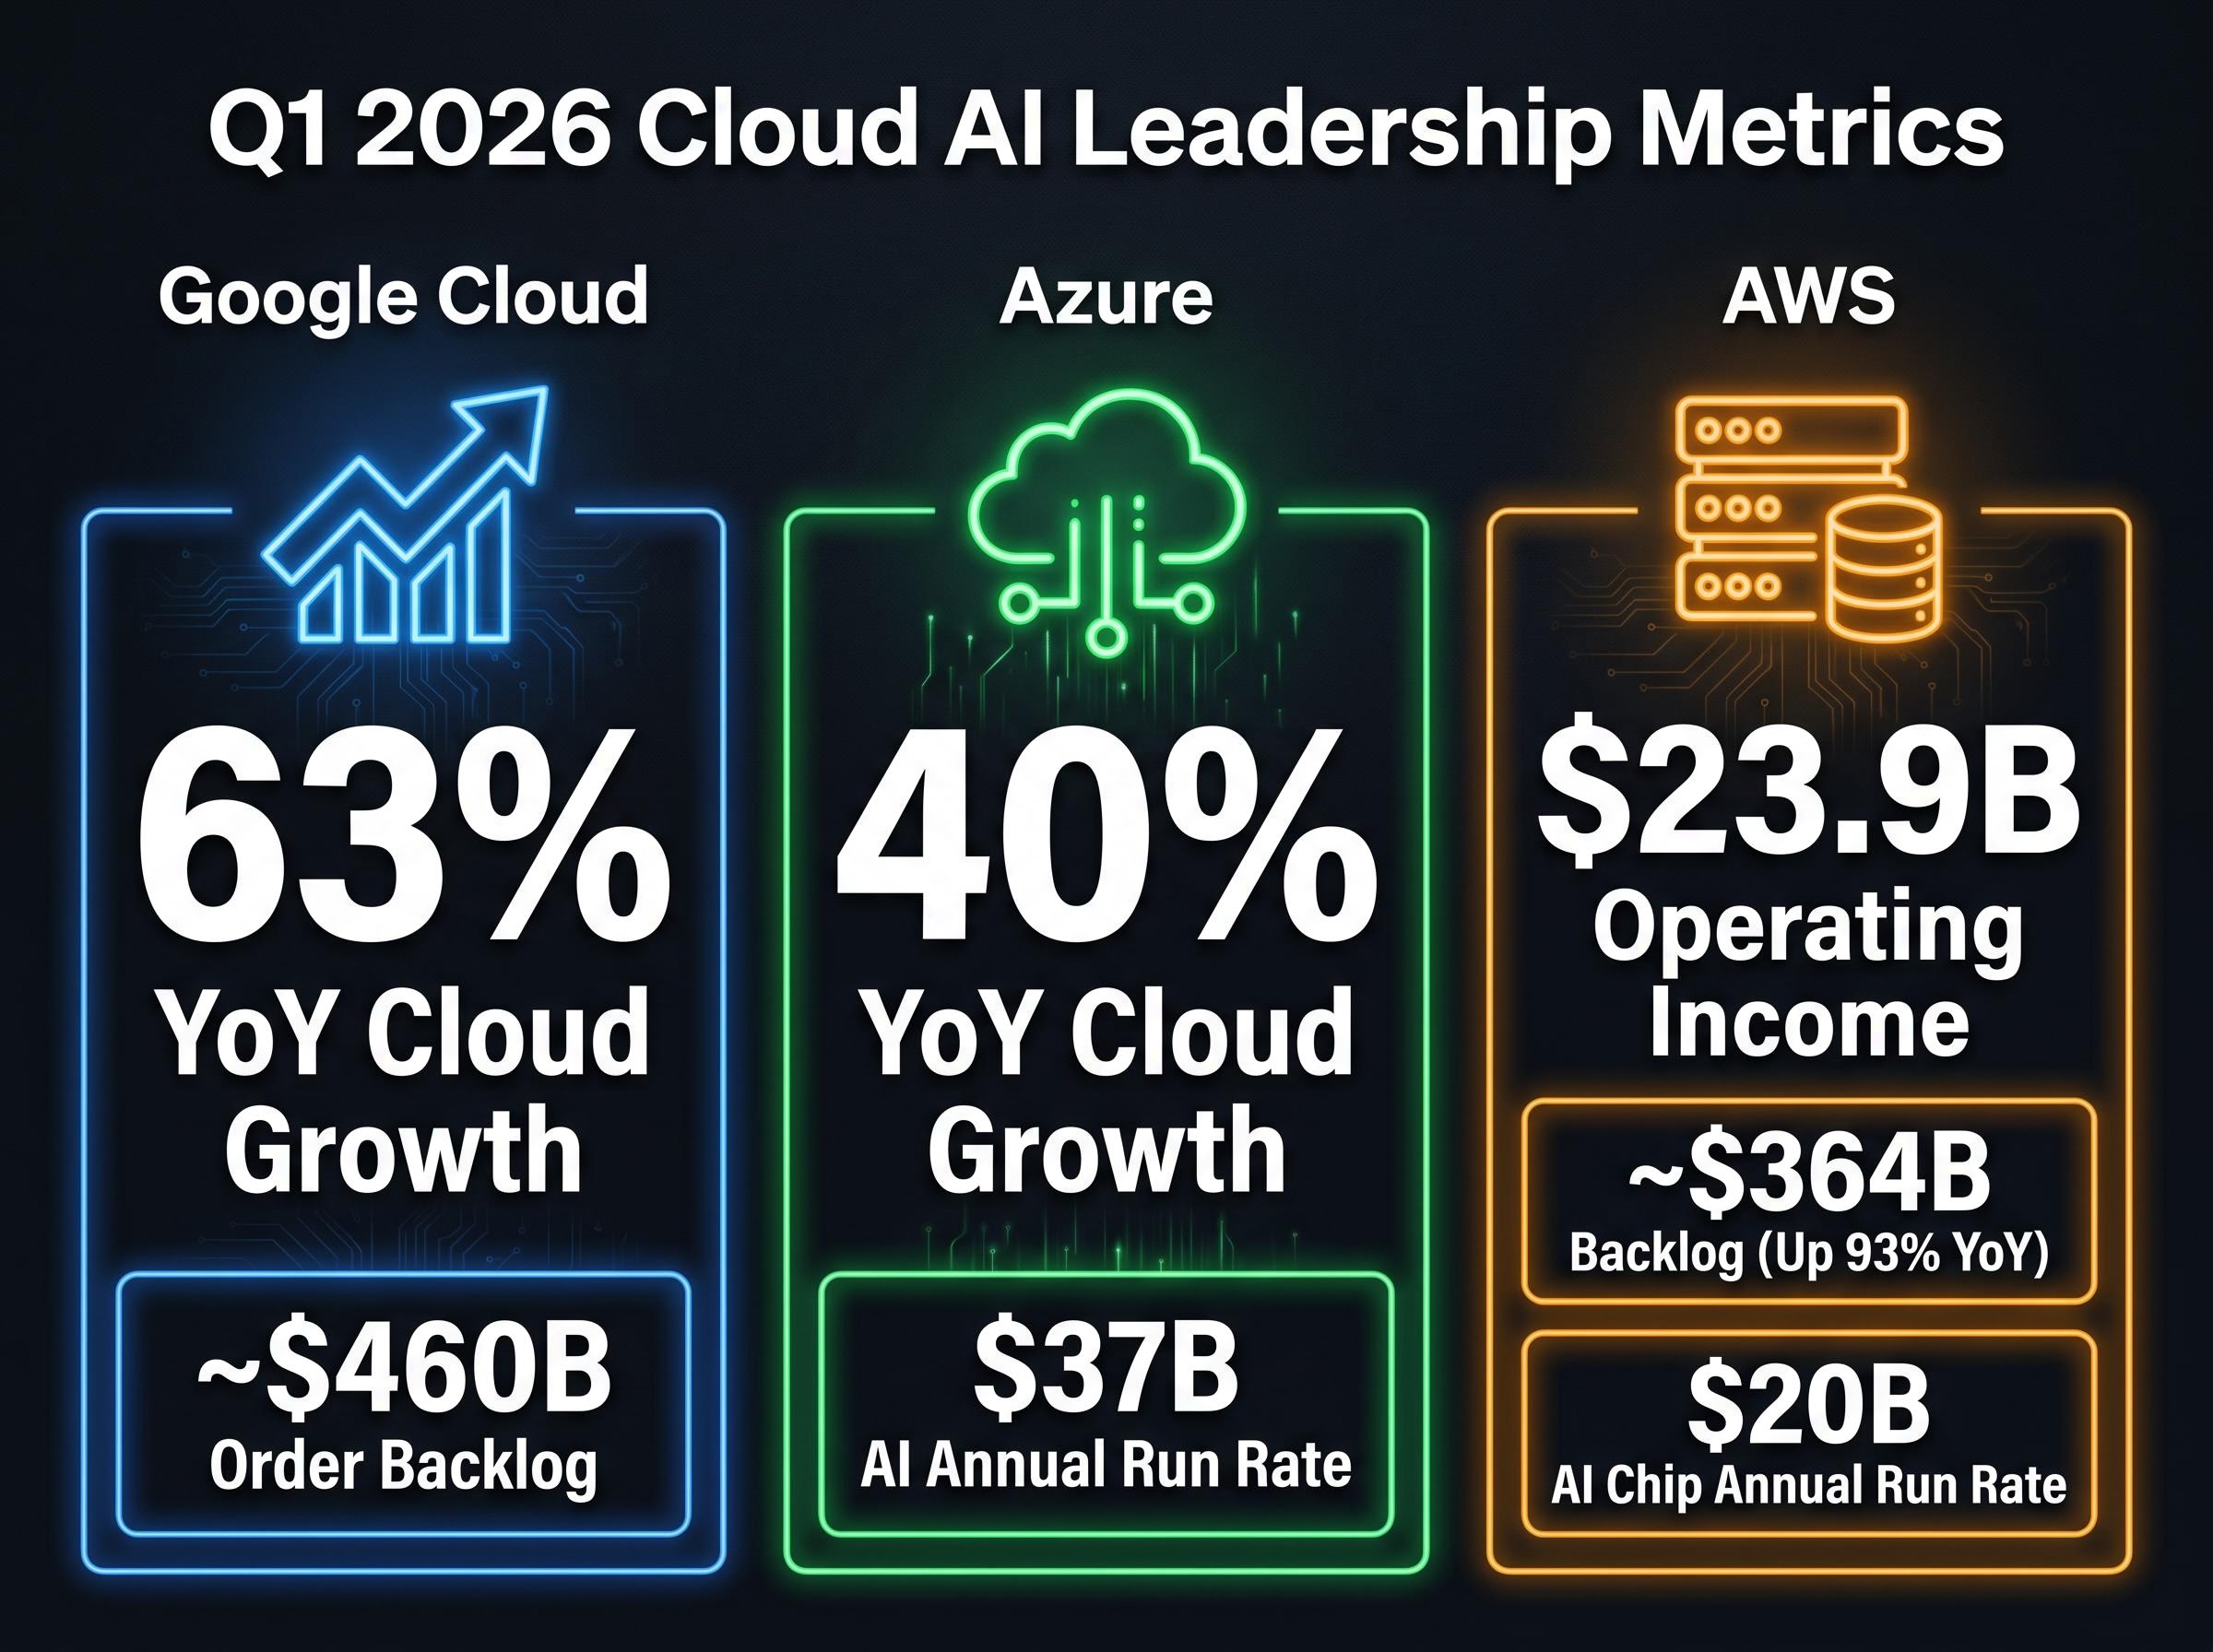
| Provider | Cloud Growth YoY | Key Backlog Figure | AI-Related Run Rate |
|---|---|---|---|
| Google Cloud | 63% | ~$460B order backlog | Not separately disclosed |
| Azure | 40% | Not separately disclosed | $37B AI annual run rate |
| AWS | Operating income $23.9B | ~$364B (up 93% YoY) | $20B AI chip annual run rate |
What the backlog data signals for future quarters
Backlog figures represent committed enterprise spend not yet converted to revenue. They function as one of the clearest forward-looking indicators available to equity investors in the cloud sector.
GCP’s approximately $460 billion order backlog and AWS’s approximately $364 billion backlog suggest the AI infrastructure demand wave is not front-loaded but structurally sustained. A 93% year-over-year backlog increase at AWS means revenue recognition is secured well into future quarters, which materially changes the risk calculus for investors evaluating these companies on near-term guidance alone.
Hardware supply chain bottlenecks represent a parallel constraint on capex deployment: memory shortages and grid power limitations can delay the conversion of approved infrastructure budgets into operational capacity, which means backlog growth alone does not guarantee the revenue recognition timeline that investors are pricing in.
When big ASX news breaks, our subscribers know first
Why the AI race requires understanding what “the stack” actually means
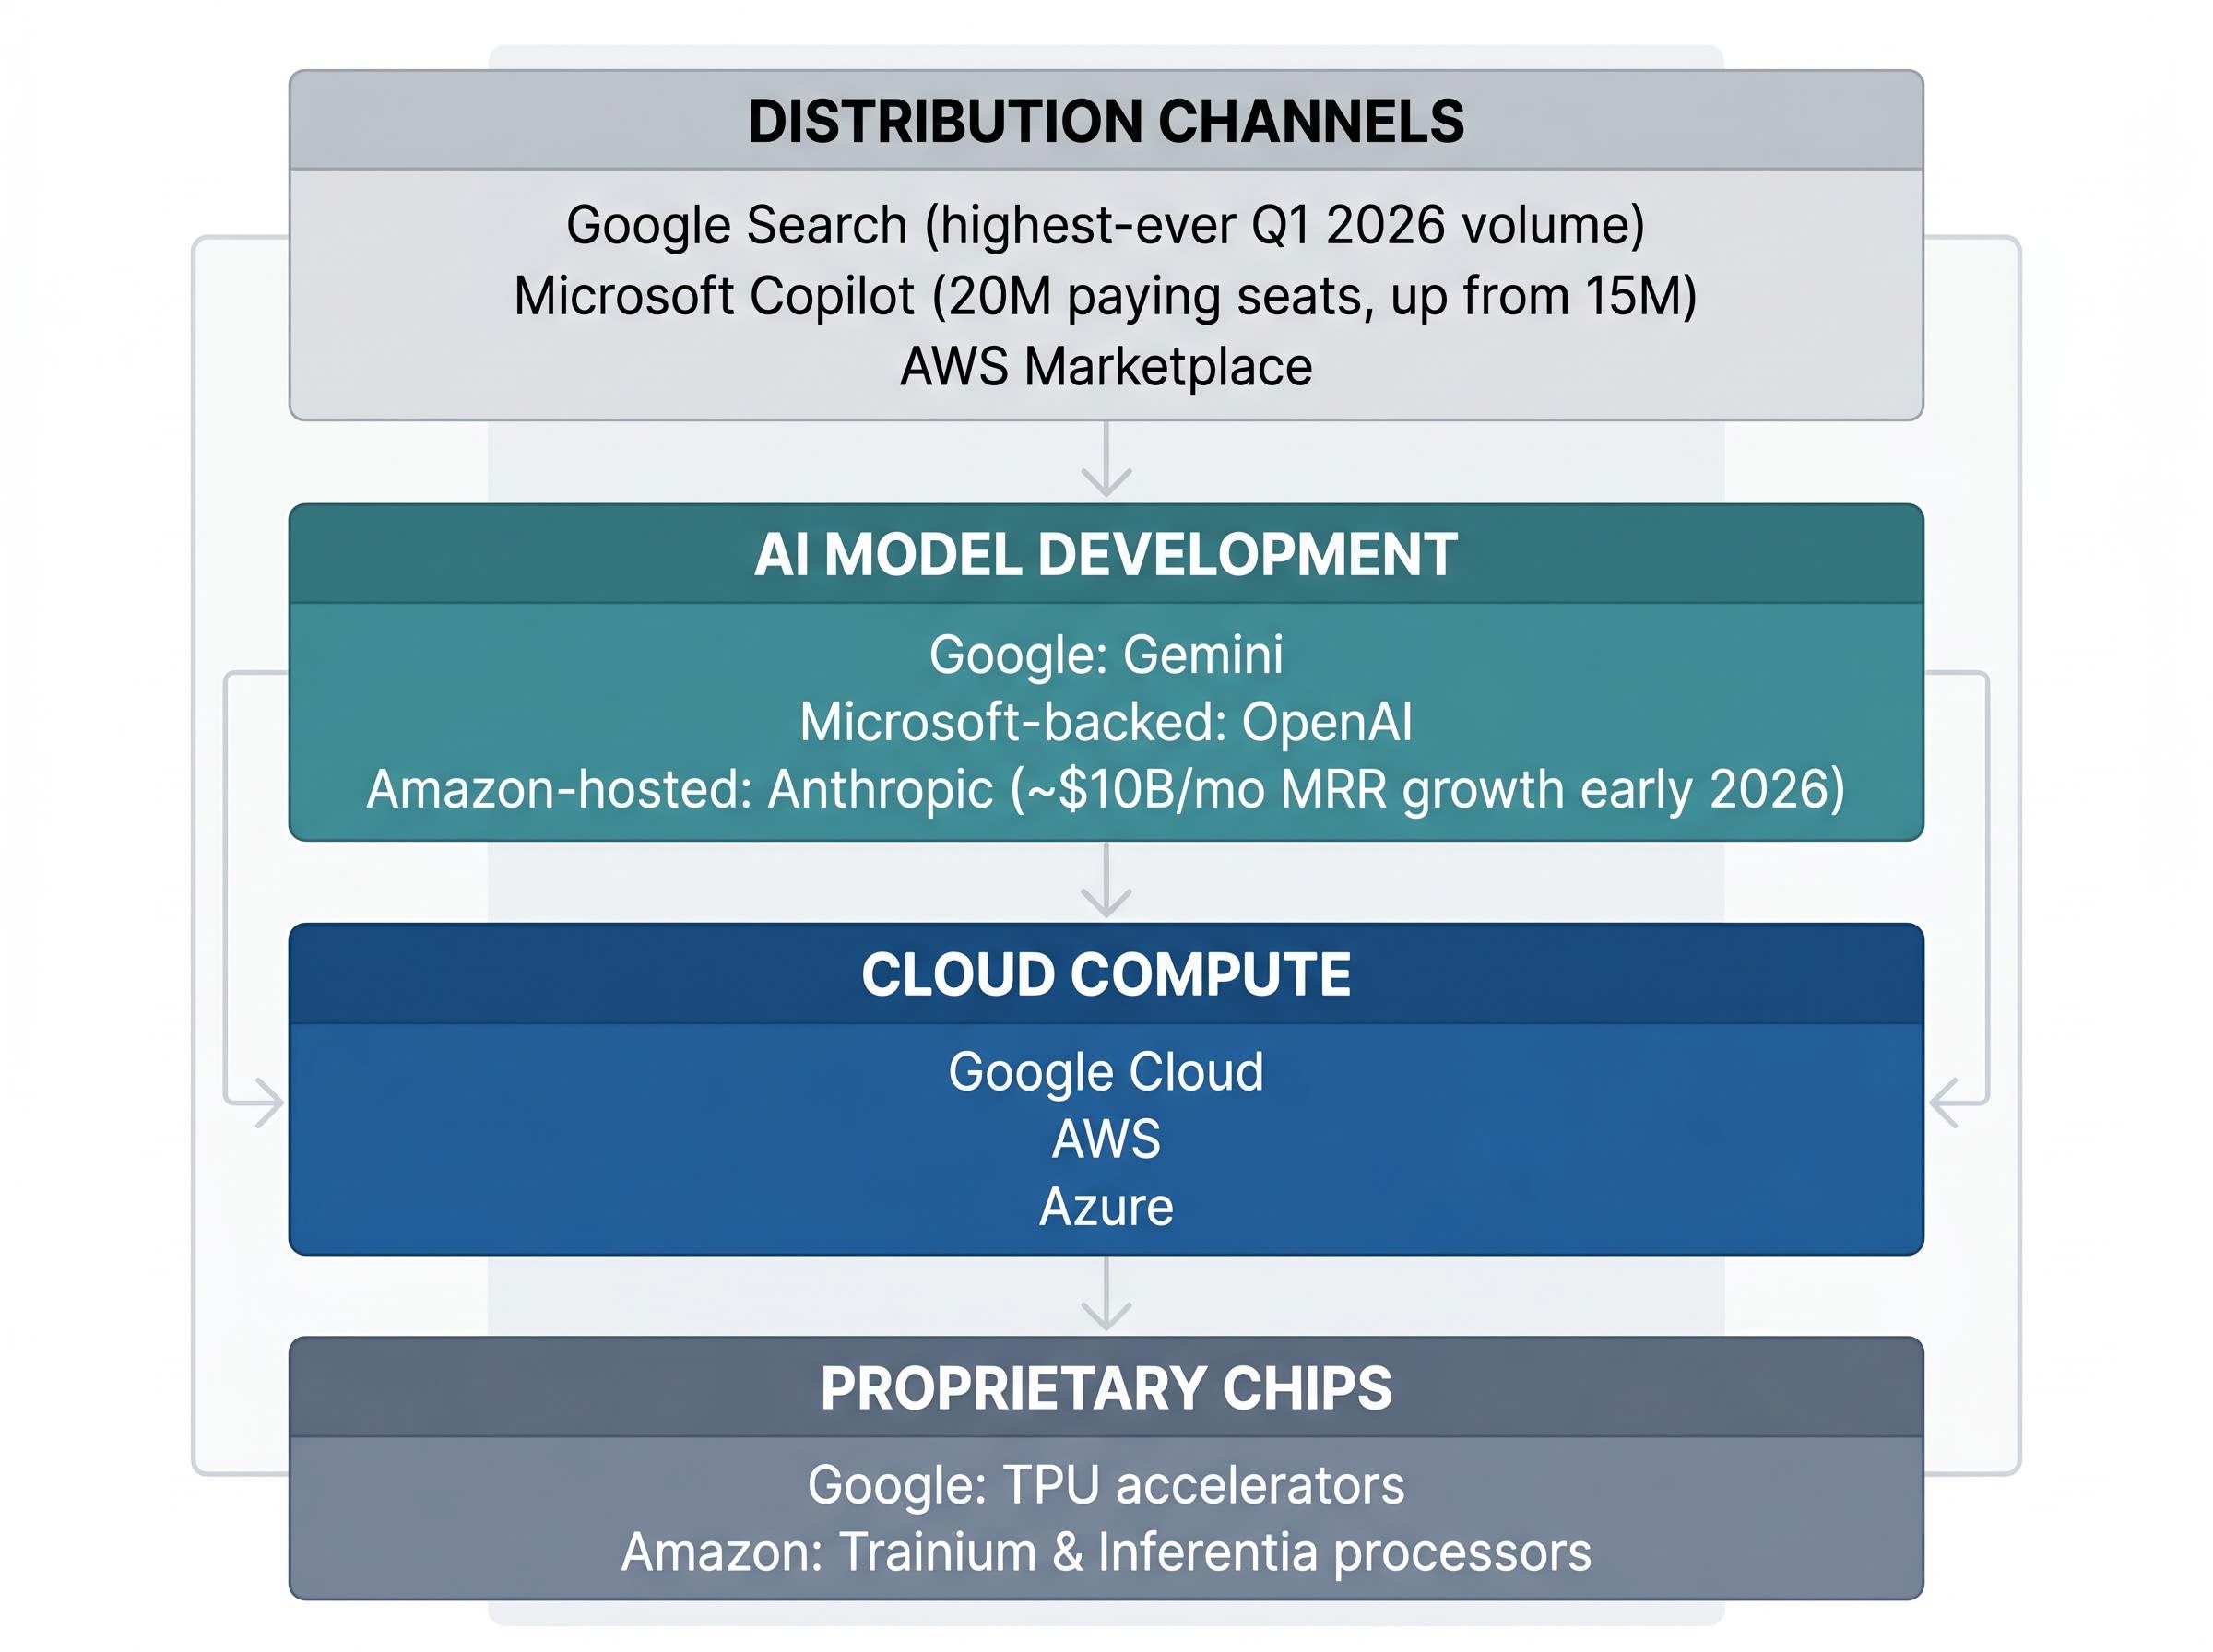
Competitive advantage in AI infrastructure is increasingly determined by control of the full technology stack: proprietary chips, cloud compute, AI model development, and distribution channels. Understanding this structure is what separates a surface-level reading of the growth numbers from a strategically useful one.
The key competitive layers of the AI stack, and where each major player currently stands:
- Proprietary chips: Google’s TPU accelerators, Amazon’s Trainium and Inferentia processors
- Cloud compute: Google Cloud, AWS, and Azure as the primary delivery platforms
- AI model development: Google’s Gemini, Microsoft-backed OpenAI, Amazon-hosted Anthropic (whose monthly recurring revenue run rate grew by approximately $10 billion per month in early 2026)
- Distribution: Google Search (highest-ever query volume in Q1 2026), Microsoft Copilot (20 million paying enterprise seats, up from 15 million), AWS marketplace
Alphabet currently presents the clearest example of full-stack integration, spanning custom TPU chips, Google Cloud infrastructure, Gemini model development, and Search as a distribution channel. Amazon’s $20 billion AI chip run rate signals an intentional move to reduce dependency on third-party GPU suppliers.
For readers less familiar with the term, “AI tokens” are the computational units processed when an AI model handles queries or tasks. Token volume is the primary driver of cloud AI revenue, which is why the AWS token statistic carries such weight.
Investors evaluating AI infrastructure exposure should recognise that not all cloud revenue is equal. A provider with a proprietary chip-to-cloud-to-model stack faces structurally lower input costs and higher switching costs than one reliant on third-party suppliers, with compounding implications for margin trajectory over multi-year holding periods.
Meta’s spending disclosure and why the market reacted so differently
Alphabet soared after earnings. Meta slumped approximately 10%. Microsoft fell roughly 2%. Amazon whipsawed on slightly-below-consensus Q2 guidance.
The market was not punishing heavy spending uniformly. It was punishing spending without visible near-term returns.
“$125-145 billion in AI spending for 2026 alone.”
Meta’s specific problem was not the size of its full-year 2026 AI capex forecast ($125-145 billion, raised from prior guidance) but the combination of raised spending and a -$1.1 billion “other income” loss, which removed the earnings cushion that insulated Alphabet from similar scrutiny. Alphabet’s substantial equity valuation gains from stakes in companies including OpenAI and Anthropic provided reported profit cover that made its $180-190 billion capex commitment appear more manageable.
Amazon’s whipsaw reflected investors weighing strong AWS backlog data against a Q2 operating income guidance midpoint of $22 billion, slightly below analyst consensus of $22.64 billion.
| Company | Stock Reaction | Primary Driver | Key Risk Flagged |
|---|---|---|---|
| Alphabet | Soared | Google Cloud 63% growth, equity gains | Capex at $180-190B for 2026 |
| Microsoft | Fell ~2% | Capex scrutiny despite strong Azure | Spending sustainability |
| Meta | Slumped ~10% | Raised capex + negative other income | ROI timeline on $125-145B spend |
| Amazon | Whipsawed | Q2 guidance below consensus | Margin conversion on 93% backlog growth |
The divergence reveals that market participants are actively distinguishing between companies with visible near-term AI monetisation and those where the return case remains on a longer horizon.
The profitability distortion hiding inside Big Tech earnings
Goldman Sachs analysts flagged a structural complication that most earnings headlines missed: a significant share of Big Tech’s reported profit growth in Q1 2026 was driven by mark-to-market gains on private equity stakes, not core cloud or advertising operations.
The mechanism is specific. Companies holding stakes in private AI firms, notably OpenAI and Anthropic, recorded large “other income” gains as private valuations rose. These gains inflated reported net income in ways that have no direct relationship to cloud business performance.
The two-layer framework makes this visible. Layer 1 is core operational growth: cloud revenue, advertising revenue, sustainable and repeatable. Layer 2 is equity valuation gains: extraordinary, variable quarter-to-quarter, and potentially unsustainable.
The “other income” picture across providers:
- Microsoft: $942 million in other income in Q1 2026, with cumulative $7.2 billion over the prior nine months
- Meta: -$1.1 billion other income loss
- Oracle: $0 other income disclosed
- Alphabet and Amazon: substantial “other income” contributions from private AI company stakes (exact aggregate figures should be verified against primary SEC filings before being cited as confirmed)
Goldman Sachs characterised this as the highest share of total profits attributable to non-core income in at least a decade. An approximate benchmark of $30.6 billion, representing roughly 34% of Big Tech net income in Q1 2026, has been identified as directionally supported, though the specific aggregate figures require primary source verification.
Note: the aggregate “other income” figures referenced here should be verified against primary SEC filings before being treated as confirmed. Individual company breakdowns for Alphabet and Amazon in particular await 10-Q disclosure.
Isolating core business performance when reviewing earnings reports
Investors comparing AI infrastructure businesses should focus on operating income from named segments (cloud, advertising) rather than net income or earnings per share. The 10-Q Management Discussion and Analysis (MD&A) sections filed with the SEC isolate segment-level operating income, which strips out investment gains and reveals core business performance.
The SEC 10-Q MD&A segment disclosure guidance published by Investor.gov details how Management Discussion and Analysis sections isolate segment-level operating income, giving investors a standardised framework for separating cloud business performance from net income figures inflated by investment gains.
Capital expenditure at this scale: what long-term investors should weigh
Alphabet’s $180-190 billion and Meta’s $125-145 billion full-year 2026 capex commitments represent some of the largest single-year infrastructure investments in corporate history. The question for investors is not whether the spending is large. It is whether the companies committing capital have structural advantages that justify the spend.
Four questions worth applying when sizing up AI infrastructure capex commitments:
- Does the company control its own chip supply chain? Amazon’s $20 billion AI chip run rate suggests an intentional vertical integration play; companies reliant on third-party GPU suppliers face different margin risk.
- Is reported profitability attributable to core cloud operations or equity gains? The Goldman Sachs framework applies directly here.
- Does the backlog data convert at defensible margins? AWS’s 93% backlog growth to approximately $364 billion secures future revenue, but margin profiles on that committed revenue are not guaranteed.
- Is there a viable distribution channel converting AI infrastructure into recurring enterprise revenue? Alphabet’s $190 billion full-year revenue guidance and record search query volumes suggest its distribution moat is intact.
The bear case is not trivial. ROI timelines on data centre investment are multi-year. Private AI valuations driving “other income” are sentiment-dependent. A countercultural trend of some enterprises purchasing on-premise computing hardware to avoid escalating cloud AI costs, while currently niche, represents a demand ceiling risk at the enterprise margin.
The AI infrastructure race is real, but the winners are not all priced the same way
Google Cloud’s 63% growth from a full-stack architecture positions Alphabet as the current pace-setter on cloud AI revenue growth. Azure’s 40% growth with a $37 billion AI run rate confirms Microsoft’s structural position but raises valid questions about capex sustainability. AWS is the largest player by market share (29%) with the deepest backlog ($364 billion) but is investing heavily in custom silicon to protect future margins.
Meta’s position is structurally distinct. It is not a cloud provider competing for enterprise AI workloads but a consumer platform betting that internal AI investment will translate into advertising and engagement outcomes on a longer horizon, without the cloud revenue base that buffers Alphabet, Microsoft, and Amazon during the spending phase.
The aggregate picture reinforces the individual company dynamics: combined Q1 2026 capital expenditure across Meta, Alphabet, Microsoft, and Amazon reached a record $130.65 billion, up 71% year over year, with full-year 2026 hyperscaler spending now projected at $725 billion, a figure that reframes the individual company capex commitments discussed here as components of a single coordinated infrastructure cycle.
What investors should watch in Q2 2026 and beyond: whether Google Cloud’s growth rate sustains above 50%, whether Meta’s AI spending begins generating observable revenue correlation, and whether Amazon’s custom silicon run rate scales into a measurable margin tailwind.
Goldman Sachs flagged that the share of total profits from non-core income is the highest in at least a decade.
That observation should function as a standing analytical discipline. Investors should continue stripping out other income from reported profits until private AI valuations normalise or the core cloud businesses demonstrate they can sustain current profit levels independently.
Reading these results as an investor, not a headline chaser
A disciplined reading of this earnings cycle rests on two practical habits. The first is to separate core cloud operating performance from net income figures that have been lifted by equity-gain windfalls. The second is to treat backlog growth as a promising leading indicator that still needs to be converted at defensible margins before it confirms a bullish thesis.
All three of Alphabet, Microsoft, and Amazon cleared a high bar in Q1 2026 on core operational metrics. The AI infrastructure investment cycle they are funding appears structurally real based on token demand, backlog data, and enterprise adoption signals.
The next analytical steps: monitor Q2 2026 guidance execution, watch for SEC 10-Q MD&A segment disclosures that reveal cloud-specific operating margins, and track whether Meta’s capex eventually surfaces in measurable revenue or continues to weigh on reported profitability.
The race is not settled. But the Q1 2026 results identify which companies have already converted infrastructure investment into verifiable cloud revenue growth, and which are still building toward that conversion.
For investors wanting to translate this competitive analysis into portfolio positioning, our dedicated guide to AI infrastructure stock allocation walks through a three-layer hardware, cloud, and software framework with specific weighting rationale, valuation context for each layer, and a comparison of NVIDIA versus Broadcom as lower-multiple alternatives for the hardware exposure.
This article is for informational purposes only and should not be considered financial advice. Investors should conduct their own research and consult with financial professionals before making investment decisions. Past performance does not guarantee future results. Financial projections are subject to market conditions and various risk factors.
—