
According to market data, the combined valuation of Microsoft, Alphabet, Amazon, and Meta now exceeds $10 trillion, largely driven by a singular metric that dictates the trajectory of the broader US equity market. As of late April 2026, the S&P 500 benchmark rests heavily on the pending first-quarter earnings reports from these four entities. Market participants are actively seeking validation of unprecedented infrastructure budgets. This analysis deconstructs the financial pipeline connecting these tech capital expenditures to hardware valuations. The gap between the shock of massive hardware spending and the market’s response reveals distinct vulnerabilities in the current semiconductor boom. Investors must evaluate how this historic reallocation of corporate resources filters through the global supply chain. The coming earnings disclosures will reveal whether the market views this spending as a strategic moat or a developing balance sheet liability.
The Scale of the Current Capex Cycle
Corporate technology budgets have transitioned from routine operational costs to macro-level market drivers. The four major hyperscalers are projected to spend between $610 billion and $650 billion collectively in 2026. This aggregate figure represents a steep acceleration from the $410 billion spent across the industry in 2025. It marks a near-doubling from the spending levels recorded just two years prior.
Investors must understand the raw scale of this capital cycle, as it represents a historic reallocation of corporate resources. According to market data, these four corporations account for precisely 17% of the overall S&P 500 benchmark allocation. This heavy concentration of market weight means individual corporate budgets essentially act as macroeconomic policy for the technology sector.
The influence of these capital expenditures becomes clear when reviewing Reuters market data, which highlights how the heavy concentration of hyperscalers forces passive index investors to indirectly underwrite massive infrastructure projects.
The projected capital outlays demand rigorous validation from forthcoming earnings calls. The sheer magnitude of this investment cycle fundamentally alters traditional valuation models. Analysts are forced to adjust their forward-looking projections to accommodate these massive capital outflows.
| Company | 2026 Projected Capex | Implied Quarterly Run Rate |
|---|---|---|
| Amazon | ~$200 billion | ~$50.0 billion |
| Alphabet | $175-$185 billion | $43.7-$46.2 billion |
| Meta | $115-$135 billion | $28.7-$33.7 billion |
| Microsoft | $110-$120 billion | $27.5-$30.0 billion |
When big ASX news breaks, our subscribers know first
How Infrastructure Budgets Translate to Silicon Valuations
The relationship between cloud infrastructure spending and hardware valuations operates through a direct financial pipeline. Every dollar allocated by a major cloud provider directly translates into forward revenue guidance for silicon manufacturers. This mechanism explains why hardware stocks currently function as high beta derivatives of hyperscaler spending guidance.
This unprecedented hyperscaler capital expenditure directly translates into forward revenue guidance for hardware manufacturers, creating a sustained growth trajectory that challenges conventional valuation models.
When a hyperscaler announces an expanded data centre footprint, the broader semiconductor market captures that capital. The total semiconductor market is projected to grow by 18% to reach $917 billion in 2026. A monitored portfolio of fifty sector-themed equities appreciated between late March and late April 2026. Furthermore, a specialised hardware index grew over the preceding 12 months, reflecting intense market anticipation.
The standard hardware procurement cycle follows a strict sequential process from board approval to final revenue recognition. Understanding this sequence provides a foundational framework to evaluate semiconductor stocks based on upstream data centre announcements.
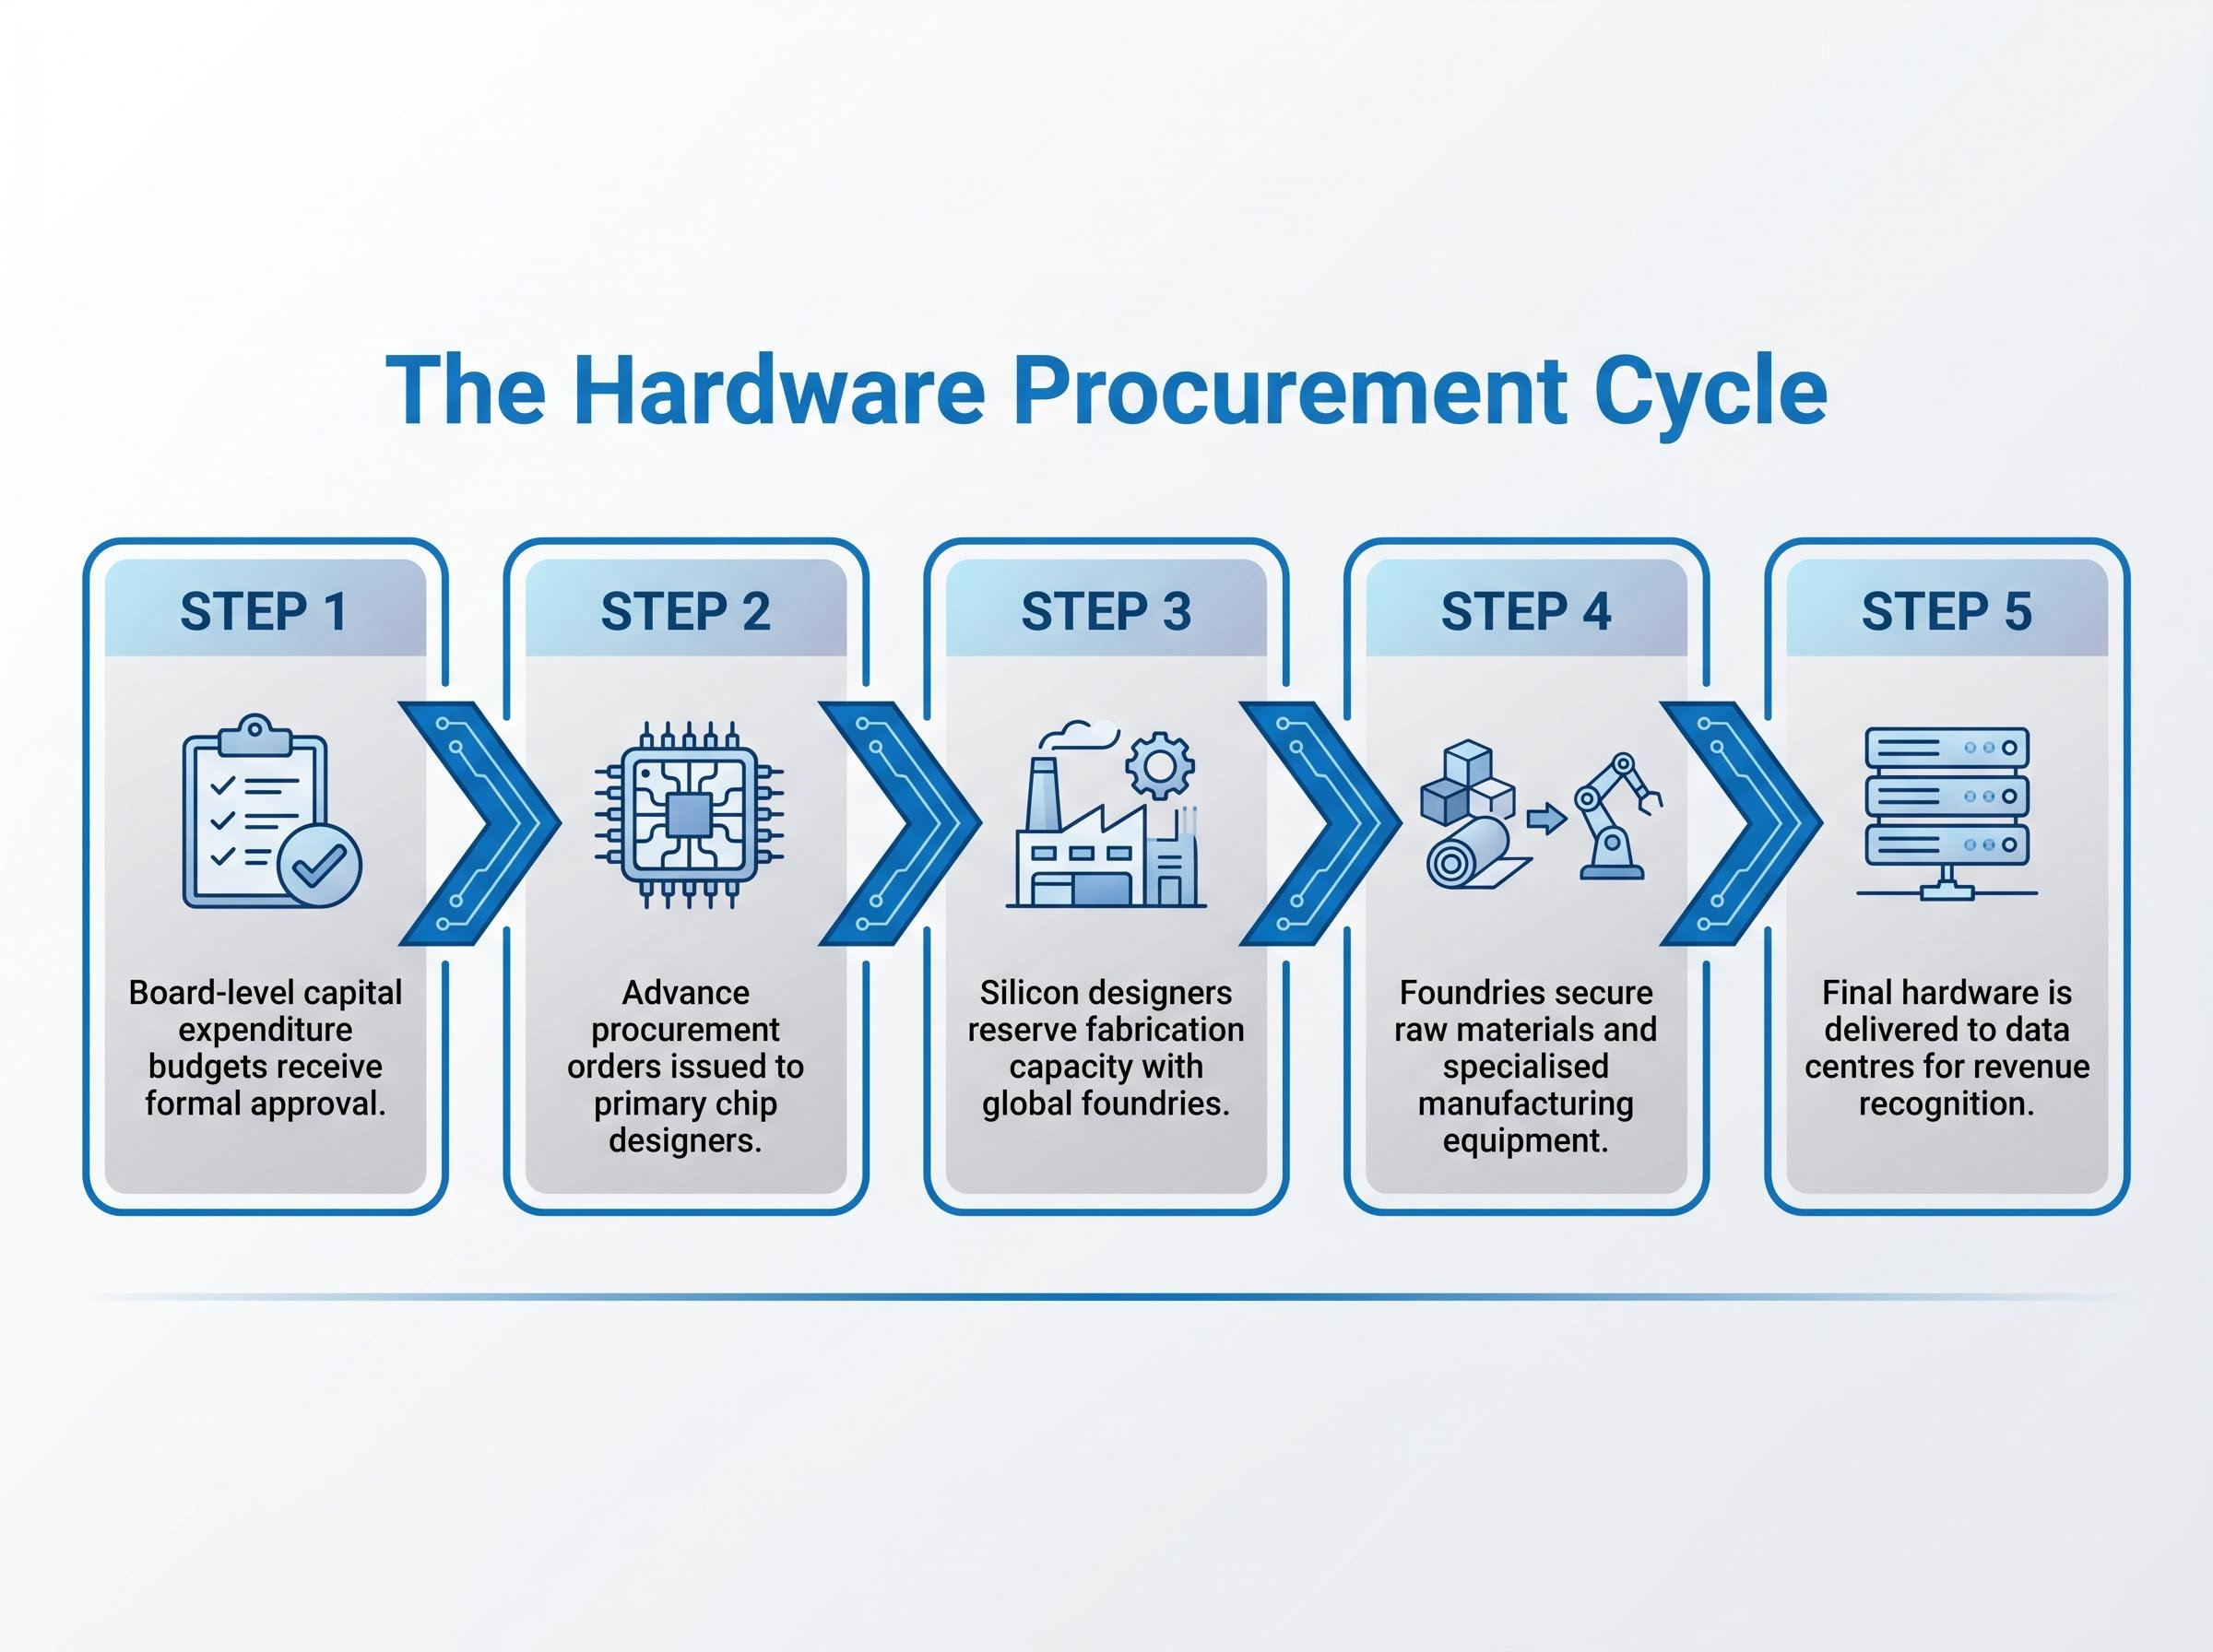
- Board-level capital expenditure budgets receive formal approval during hyperscaler earnings cycles.
- Cloud engineering teams issue advance procurement orders to primary chip designers.
- Silicon designers reserve fabrication capacity with global semiconductor foundries.
- Foundries secure raw materials and specialised manufacturing equipment to execute the fabrication runs.
- Final hardware is delivered to data centres, allowing silicon manufacturers to recognise the revenue.
The Profitability Pivot and Return on Investment Scrutiny
Market sentiment is shifting rapidly from an awe of structural scale to clinical scepticism regarding financial returns. More than $500 billion was spent on artificial intelligence infrastructure in 2025 alone. Total industry-wide spending is expected to reach the $680 billion to $750 billion range over the current cycle.
Wall Street analysts have recalibrated their focus from raw hardware deployment growth to concrete software revenue generation. According to market data, infrastructure outlays for the primary technology leaders are forecast to expand from half of their operating cash flow to approximately 90%. This disproportionate consumption of operating cash flow represents a critical inflection point for institutional investors. It raises immediate concerns regarding debt funding and long-term margin compression.
This reliance on external capital represents a fundamental shift in sector strategy, and Seeking Alpha infrastructure financing analysis highlights how companies are tapping debt markets to maintain their deployment velocity.
Financial Strategist Sentiment “Current valuation multiples require immediate proof of commercial software monetisation, as the market will not sustain infrastructure spending that consumes ninety percent of operating cash flow without corresponding revenue expansion in the next twelve months.”
Massive spending can quickly shift from being viewed as a bullish growth indicator to a bearish balance sheet liability. If the rate of capital deployment slows without delivering proportional financial returns, severe valuation corrections become highly probable.
Physical Bottlenecks Choking the Supply Chain
Financial willingness to spend is no longer the only variable determining growth in the technology sector. The unprecedented scale of hyperscaler investment is fundamentally reshaping and straining physical global supply networks. Rapid investment has exposed severe limitations in land markets, energy grids, and manufacturing capacity.
Beyond the widely documented constraints on logic processors, the enterprise data storage market has also experienced extreme supply shock, with major hardware vendors selling out production capacity completely.
Physical constraints now dictate growth limits, creating massive vulnerabilities for investors banking on uninterrupted expansion. Acute hardware shortages are preventing companies from fully deploying their approved budgets. This tension demonstrates that financial capacity cannot override the mechanical reality of global supply chains. Real-world bottlenecks force analysts to heavily discount the aggressive deployment timelines originally promised by corporate management.
The sector faces three distinct operational constraints that limit immediate deployment:
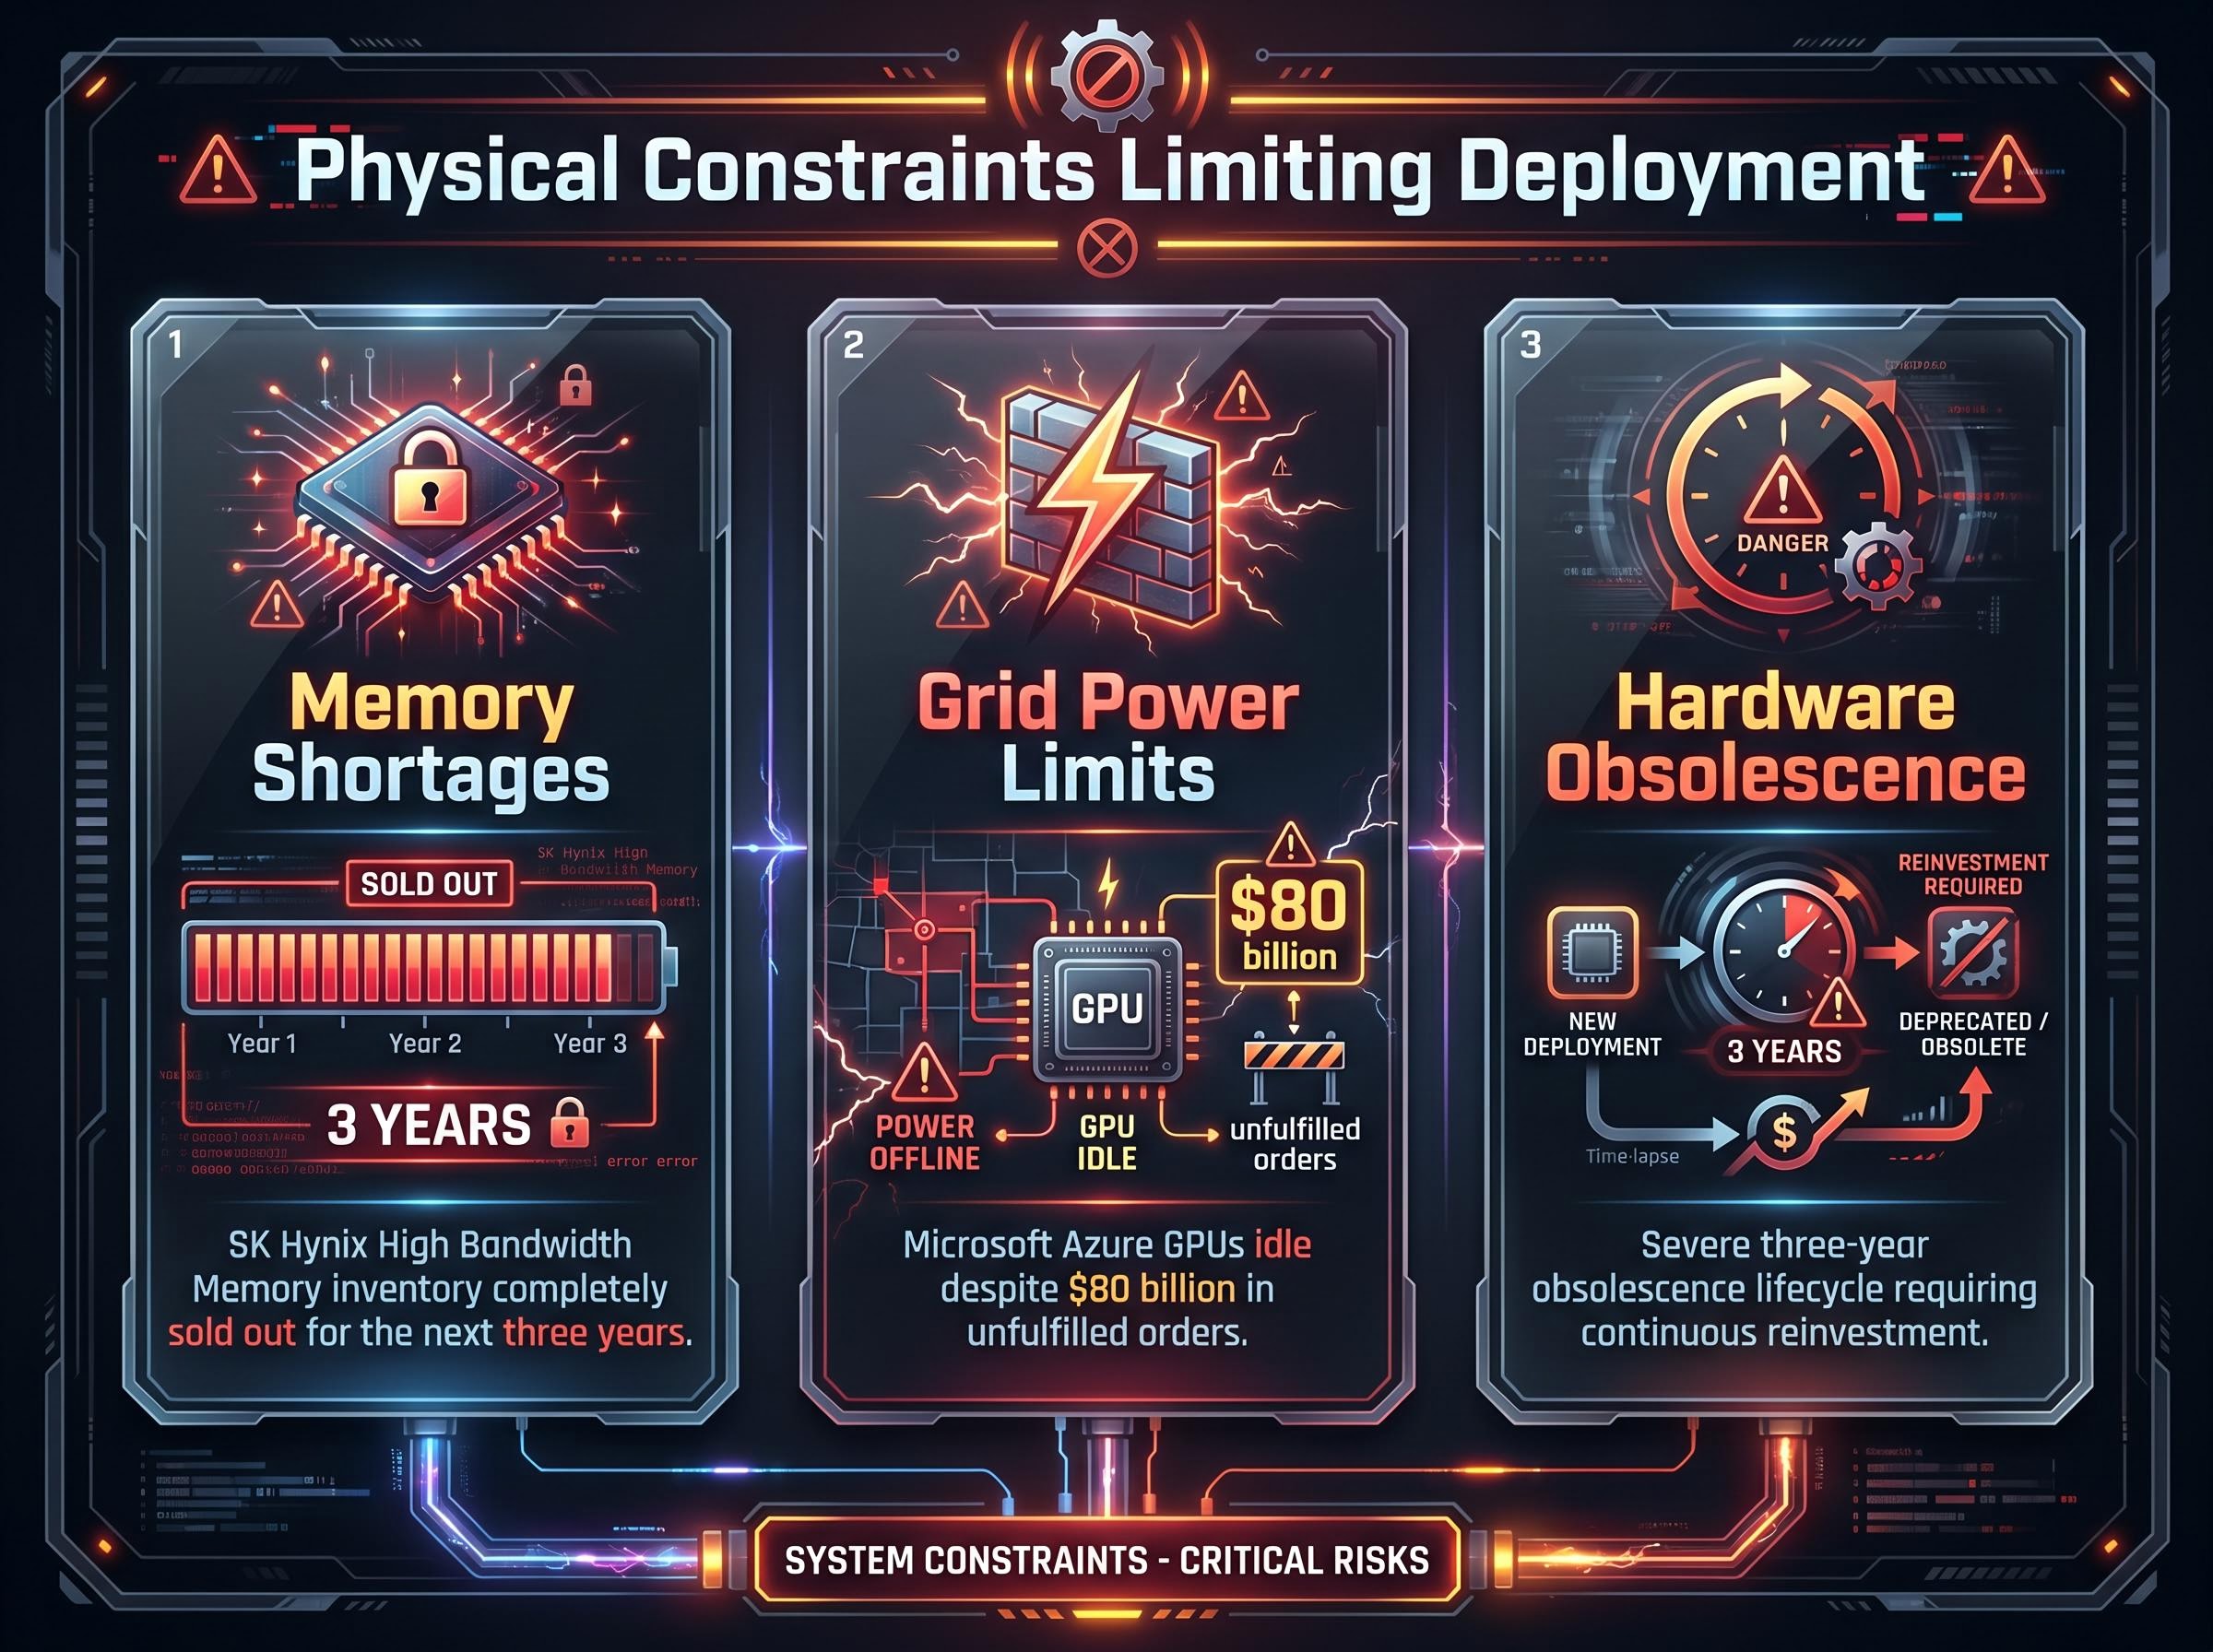
Memory Shortages: SK Hynix reports its High Bandwidth Memory inventory is completely sold out for the next three years, creating a hard ceiling on immediate expansion. Grid Power Limits: Local energy constraints have left Microsoft Azure graphics processing units sitting idle, despite the company holding $80 billion in unfulfilled orders. * Hardware Obsolescence: Infrastructure hardware currently faces a severe three-year obsolescence lifecycle, requiring continuous reinvestment just to maintain current computational capacity.
Pricing the Risk in Derivatives Markets
Derivatives markets are actively pricing the risk associated with the late earnings disclosures. Any prospective reduction in projected budgets would trigger an immediate and violent valuation downturn across related hardware supply sectors. Hardware equities recently experienced a notable decline following media reports regarding unmet commercial targets, highlighting this extreme sensitivity.
Current options market pricing illustrates potential market complacency regarding the upcoming disclosures. Investors are currently gauging whether semiconductor stocks are adequately discounting the possibility of a spending slowdown. This provides actionable insight into how the market quantifies risk heading into a critical earnings window. Option premiums remain surprisingly muted given the scale of capital at stake.
Implied Volatility Versus Historical Averages
According to market data, derivatives markets anticipate post-disclosure equity movements ranging between 4% for Amazon and 7.1% for Meta. However, according to market data, historical averages across the preceding 12 quarters show actual movements of 6% for Amazon and 8.4% for Meta. This pricing structure suggests options traders might be underestimating the potential for significant structural re-pricing.
The simultaneous release of financial data from sector leaders heavily amplifies systemic risk. A guidance downgrade from any single hyperscaler could force a correlated sell-off across the entire semiconductor index.
Investors exploring the broader index vulnerabilities will find our detailed coverage of megacap tech concentration risk, which examines how the combined market weight of these four entities distorts passive equity portfolios during volatile earnings seasons.
The Fragile Equilibrium of Technology Valuations
The broader semiconductor market’s health remains entirely dependent on sustained hyperscaler infrastructure budgets. The pending $630 billion aggregate capital expenditure target for 2026 serves as the ultimate baseline for current market stability. The tension between the physical constraints of deployment and the financial necessity of proving returns will dictate equity performance through the remainder of the year.
These localized pressures arrive at a time when broader S&P 500 market risk is already elevated, driven by shifting geopolitical tensions and persistent commodity inflation that threaten to compress corporate profit margins.
Investors must closely monitor specific language regarding software monetisation during the upcoming first-quarter earnings calls. A shift in corporate tone from capacity accumulation to efficiency optimisation would signal the peak of the current spending cycle. Any indication that returns on investment are compressing could trigger a rapid recalculation of hardware valuations.
This article is for informational purposes only and should not be considered financial advice. Investors should conduct their own research and consult with financial professionals before making investment decisions. Past performance does not guarantee future results. Financial projections are subject to market conditions and various risk factors.