Four of the world’s most valuable technology companies disclosed Q1 2026 earnings within days of each other, and the combined AI infrastructure bill they handed investors landed at a record $130.65 billion in a single quarter. The Magnificent 7 earnings season is functioning as a real-time stress test for Wall Street’s conviction in AI spending, and the results on 30 April 2026 showed just how unevenly that conviction is distributed.
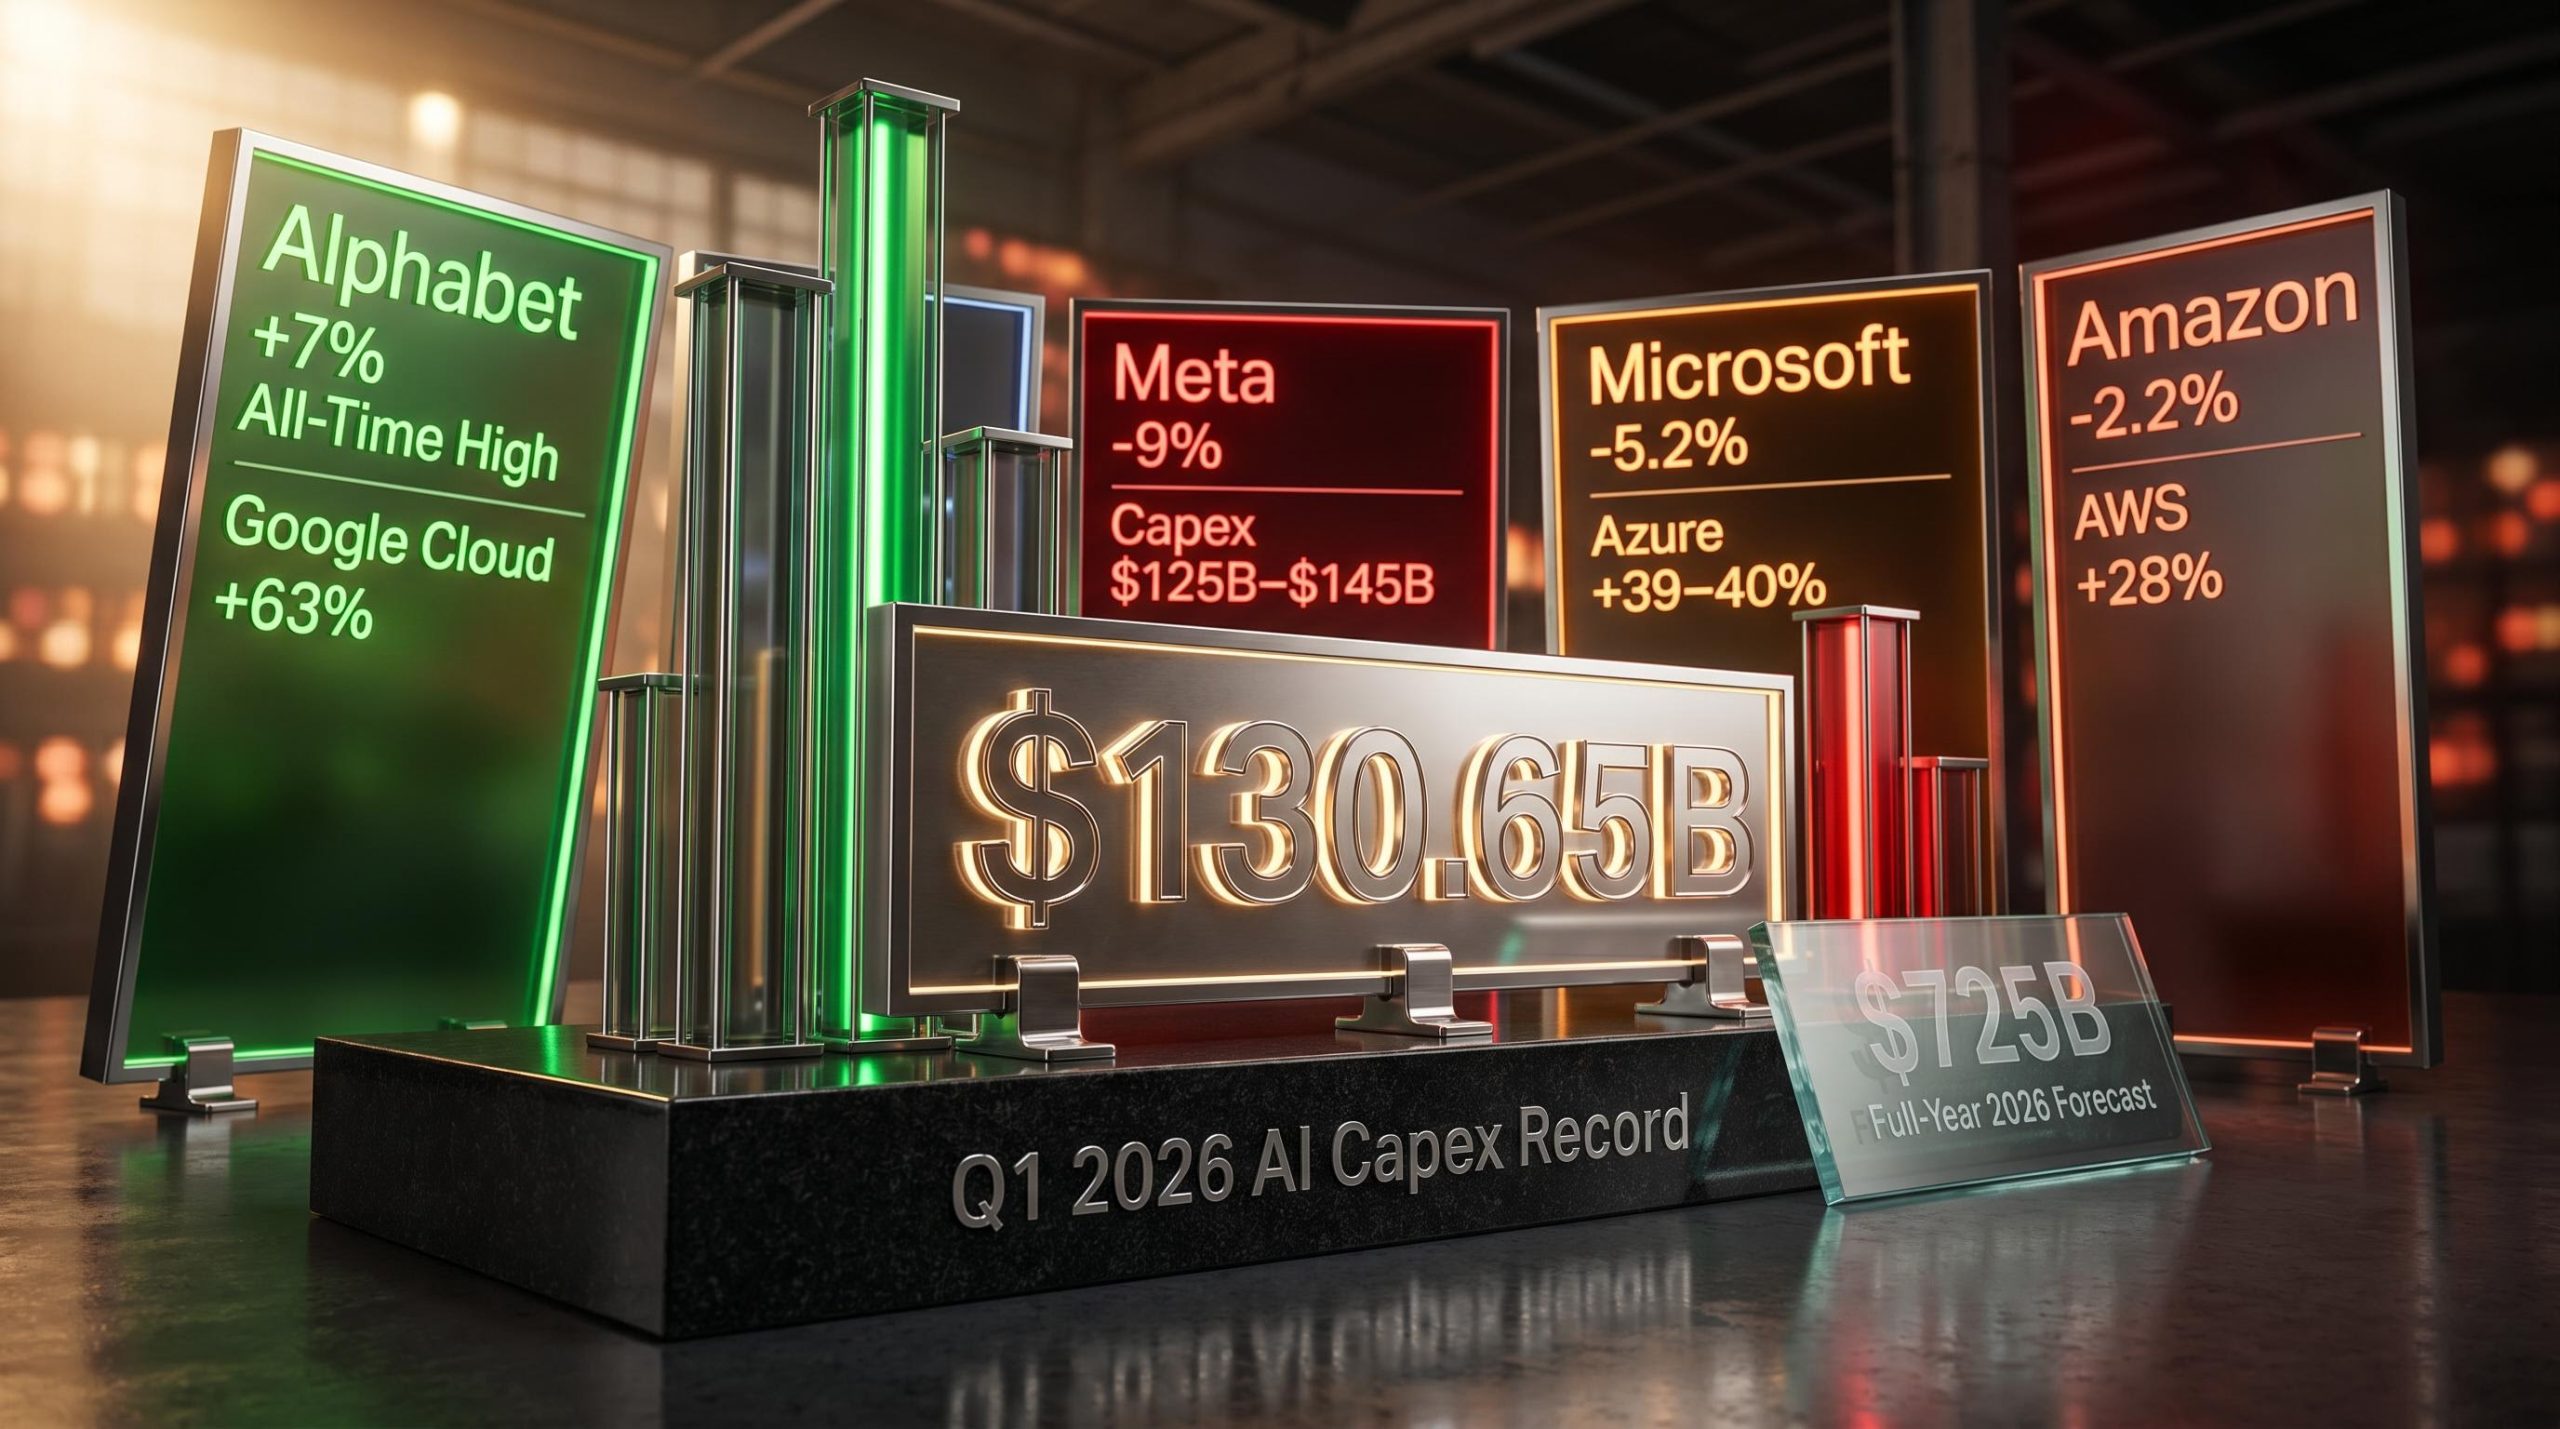
Alphabet shares climbed more than 7% to an all-time high while Meta fell more than 9% on the same trading day, despite both companies reporting strong revenue growth. With Apple reporting after the market close on 30 April, the full picture remains incomplete.
What follows breaks down what each company reported, why the stock reactions diverged so sharply, and what the $130.65 billion capex figure signals about where the AI infrastructure buildout is headed.
A record $130 billion AI spending quarter sets the tone
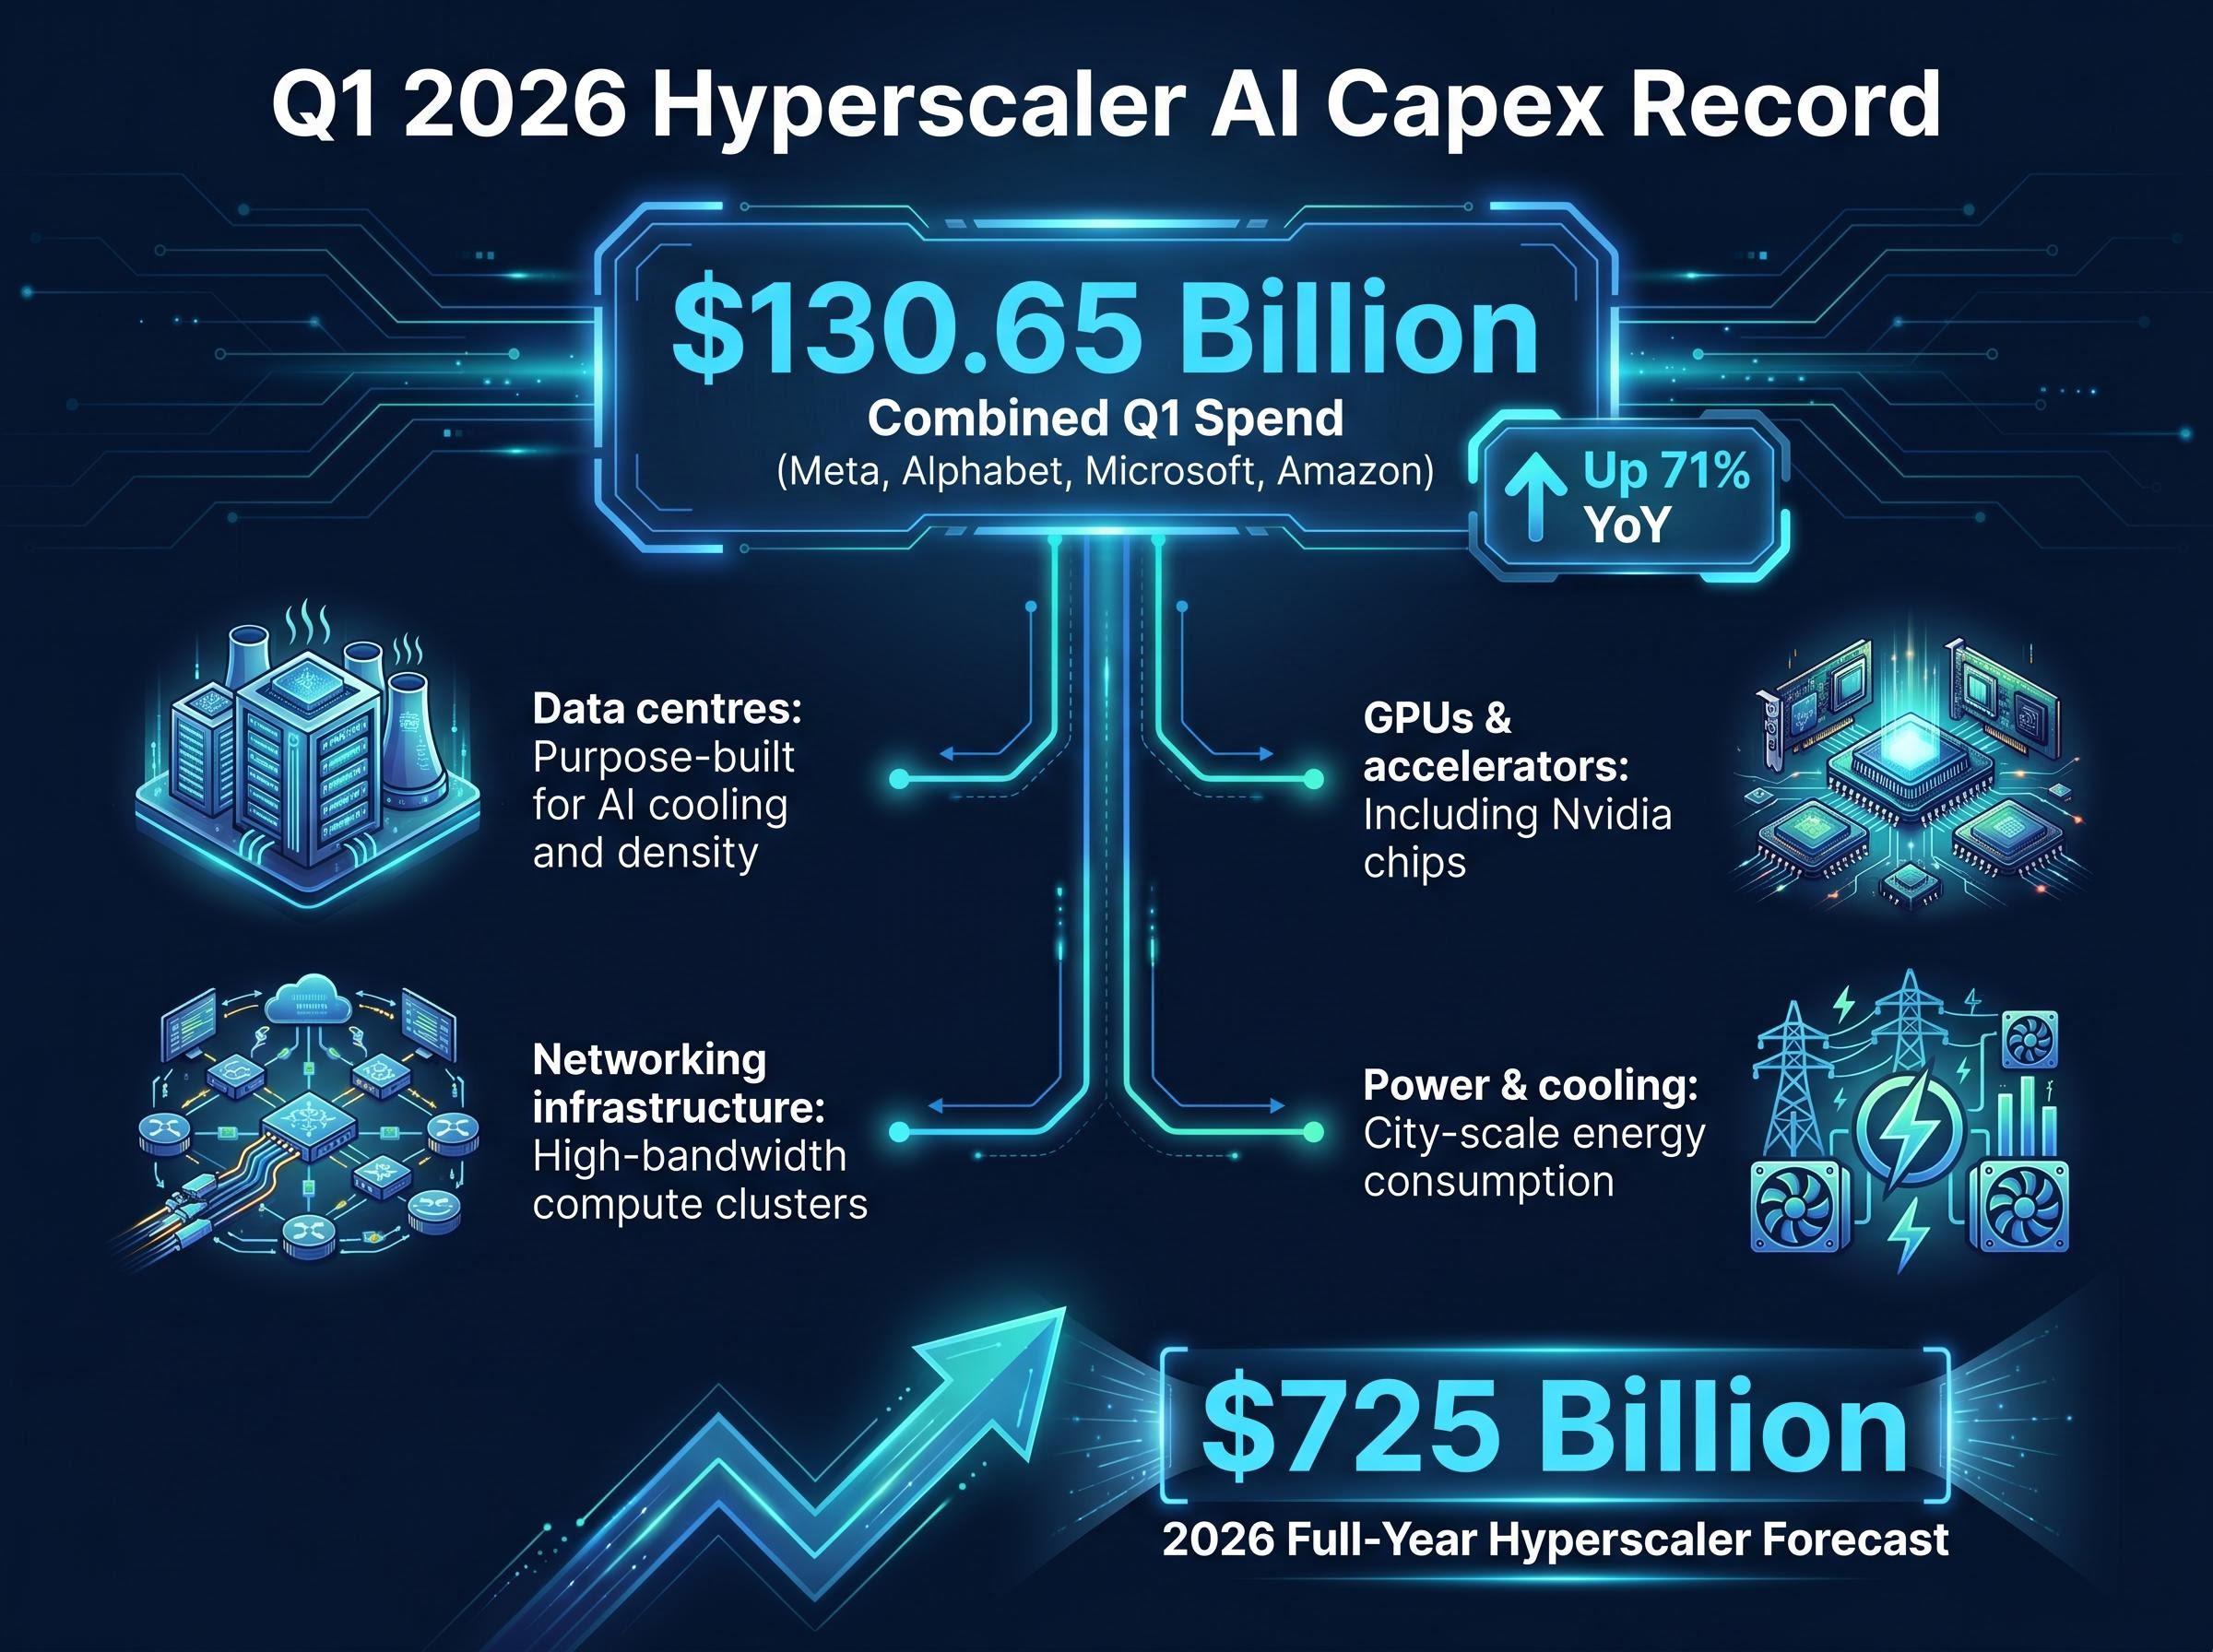
The number demands attention before the nuance: Meta, Alphabet, Microsoft, and Amazon collectively spent $130.65 billion on capital expenditure in Q1 2026, a record for a single reporting quarter and a 71% increase over the same period in 2025.
$130.65 billion: Combined Q1 2026 capital expenditure for Meta, Alphabet, Microsoft, and Amazon, up 71% year over year and a single-quarter record for the hyperscaler group.
The full-year projection is steeper still. Across the broader hyperscaler group, 2026 capex is forecast to reach $725 billion, a figure that reframes each quarterly disclosure as a down payment on an infrastructure bet of historic proportions.
Financial Times reporting on Big Tech’s $725 billion AI spending plans confirmed the full-year projection on 30 April 2026, placing the quarterly disclosures in context of a multi-year infrastructure commitment that now dwarfs any prior technology spending cycle.
Aggregate earnings growth across the Magnificent 7 came in at approximately 19% for Q1 2026, a pace strong enough to anchor broader S&P 500 performance. The question investors are now pricing, company by company, is whether that growth rate can absorb the spending rate. The four contributing companies:
- Meta Platforms
- Alphabet (Google)
- Microsoft
- Amazon
When big ASX news breaks, our subscribers know first
What Alphabet and Amazon reported, and why markets cheered
Alphabet posts 81% net income growth as cloud momentum accelerates
Alphabet reported $109.9 billion in revenue for Q1 2026, a 22% increase year over year. Net income reached $62.58 billion, up 81%, with earnings per share at $5.11.
The figure that mattered most to investors was Google Cloud revenue growth of 63% year over year, the clearest evidence yet that enterprise AI adoption is translating into actual recurring revenue. Shares rose more than 7% on 30 April, reaching an all-time high.
The market’s response was not simply a reaction to strong earnings. It reflected a judgment that Alphabet’s capex is producing a visible return at a rate that justifies continued spending.
Amazon’s AWS hits fastest growth since 2022
Amazon reported revenue of $181.5 billion and net income of $30.3 billion. AWS growth accelerated to 28% year over year, the fastest rate since 2022.
A notable non-operating item lifted the headline: a $16.8 billion pre-tax gain from Amazon’s investment in Anthropic. Investors separating the one-time valuation gain from the underlying cloud acceleration saw a mixed picture. Shares briefly touched a record high on 30 April before reversing to close approximately 2.2% lower.
| Metric | Alphabet | Amazon |
|---|---|---|
| Revenue | $109.9B (up 22% YoY) | $181.5B |
| Net Income | $62.58B (up 81% YoY) | $30.3B |
| Cloud Growth Rate | 63% YoY (Google Cloud) | 28% YoY (AWS) |
| Stock Reaction (30 April) | Up 7%+ (all-time high) | Down ~2.2% (reversed from intraday high) |
Understanding AI capex: what hyperscalers are building and why it costs this much
The $130.65 billion quarterly figure represents physical infrastructure on a vast scale. AI capital expenditure funds the construction and equipping of specialised facilities designed to train and run large-scale machine learning models.
The primary categories of spending include:
- Data centres: Purpose-built facilities designed for the density and cooling requirements of AI workloads
- GPUs and accelerators: Specialised processors, including chips from Nvidia and custom silicon, purchased in quantities large enough to create supply-chain bottlenecks
- Networking infrastructure: High-bandwidth interconnects linking thousands of processors into unified compute clusters
- Power and cooling systems: Energy infrastructure capable of supporting facilities that consume electricity at rates comparable to small cities
The cost curve is steep because each category carries its own supply constraint. Chip scarcity, power availability, and the lead time on purpose-built facilities all compress the timeline for deployment. According to CFRA Research, the sustained AI capex budgets represent a deliberate long-term bet on value creation rather than a short-term spending cycle. Bloomberg analysts have characterised the hyperscaler group’s commitment as a signal that these companies view capacity constraints, not overspending, as the greater competitive risk.
Power grid constraints have become one of the most binding limits on the speed at which this capex can convert into deployed capacity: data centres for AI workloads are projected to consume 9% of US domestic electricity by 2030, up from 4% in 2023, and the gap between approved spending and available grid infrastructure is compressing deployment timelines across the hyperscaler group.
Why Meta’s strong earnings still sent shares down more than 9%
Meta Platforms reported $56.31 billion in revenue for Q1 2026, up 33% year over year. Net income reached $26.77 billion, a 61% increase. Adjusted earnings per share came in at $7.31.
These were strong results by any conventional measure. The stock fell anyway.
$125 billion to $145 billion: Meta’s revised 2026 capital expenditure guidance, raised by $20 billion from prior forecasts.
The trigger was the upward revision to Meta’s full-year 2026 capex guidance, lifted by $20 billion to a range of $125 billion to $145 billion. Shares declined approximately 7% in extended trading following the 29 April earnings release, then fell more than 9% during the 30 April session.
The contrast between what Meta reported and how investors responded illustrates the tension at the centre of this earnings season:
- What Meta reported: 33% revenue growth, 61% net income growth, an EPS beat
- What spooked investors: A $20 billion upward revision to capex guidance with no near-term margin expansion timeline attached
The selloff was not a verdict on Meta’s business health. It was a repricing of the timeline for AI spending to convert into margin-expanding returns, a distinction that matters for interpreting every subsequent Magnificent 7 earnings report.
The AI monetisation timeline matters here because cloud revenue acceleration is the primary mechanism through which infrastructure spending is expected to pay back: AWS reaching a $15 billion annualised AI run rate and Google Cloud posting 63% growth are early data points, but the multi-year lag between capital deployment and fully monetised capacity means investors are pricing expected curves rather than demonstrated results.
Microsoft’s cloud growth lands in line, but shares still slip 5%
Microsoft reported Azure and cloud services revenue growth of 39% to 40% in constant currency for its fiscal Q3 2026 (calendar Q1). Management guided toward further acceleration in the second half of 2026 as AI demand continues to build.
Shares fell approximately 5.2% on 30 April. Comprehensive revenue and EPS figures for the full fiscal Q3 2026 were not available in verified sources at time of publication; the Azure growth metrics were confirmed from Reuters and Bloomberg reporting dated 29 April 2026.
The decline is best understood in contrast with Alphabet’s reception. Alphabet beat expectations and was rewarded. Microsoft met them and was punished. When a stock is priced for outperformance, delivering consensus can register as a disappointment. Investor standards across this group have become sharply differentiated, and in-line results no longer guarantee a neutral reaction.
Apple’s results and the road ahead for the Magnificent 7
Apple reported after the market close on 30 April 2026, making its results the final data point of this Magnificent 7 earnings cycle. Verified figures from the release were not yet available at the time of publication.
The broader picture is now coming into focus. Across the group, aggregate earnings growth of approximately 19% in Q1 2026 remains a structural support for the S&P 500, which closed at 7,167.14 on 30 April (up 0.4%). The Nasdaq rose just 0.1%, reflecting how the Alphabet gain and Meta decline nearly offset each other.
The Nasdaq’s near-flat 0.1% close on 30 April, despite Alphabet’s all-time high, is a precise illustration of index portfolio distortion: when offsetting gains and losses from a handful of stocks determine the benchmark’s daily return, cap-weighted passive exposure becomes a concentrated directional bet rather than a diversified market position.
A quick reference for the four stock reactions reported on 30 April:
- Alphabet: Up more than 7%, reaching an all-time high
- Amazon: Down approximately 2.2%, reversing from an intraday record
- Microsoft: Down approximately 5.2%
- Meta: Down more than 9%
Deutsche Bank characterised the overall results as a “decent set” for the group. The question this earnings season has crystallised is specific: at what pace will $130 billion-plus in quarterly AI capex convert into margin-expanding revenue, and which company will demonstrate that conversion first? With full-year 2026 hyperscaler capex projected at $725 billion, the answer will define the second half of the year.
A season defined by conviction, cost, and divergent verdicts
This Magnificent 7 earnings cycle exposed a market that is no longer evaluating AI spending as a single trade. Record infrastructure investment of $130.65 billion in a single quarter drew four distinct investor verdicts, ranging from an all-time high to a 9% selloff, based almost entirely on perceived return timelines.
The aggregate 19% earnings growth across the group remains a powerful anchor for broader market performance. What has changed is the granularity of the market’s judgment. Revenue growth alone no longer settles the question; investors are now pricing each company’s capex-to-revenue conversion speed individually.
Two forward indicators are worth monitoring in the coming days: how markets digest Apple’s just-released results, and whether analyst commentary refines the $725 billion full-year capex trajectory or begins to question its sustainability.
Investors exploring how derivatives markets were positioning for these outcomes before the results landed will find our deep-dive into the options market setup ahead of these earnings, which details the implied move pricing across all four companies, the $750 billion valuation swing Wall Street was modelling, and why Microsoft was identified as carrying the most concentrated downside risk entering the reporting window.
This article is for informational purposes only and should not be considered financial advice. Investors should conduct their own research and consult with financial professionals before making investment decisions. Past performance does not guarantee future results. Financial projections are subject to market conditions and various risk factors.