How ASX’s CHESS Overhaul Became a $250M Governance Failure
37 mins ago
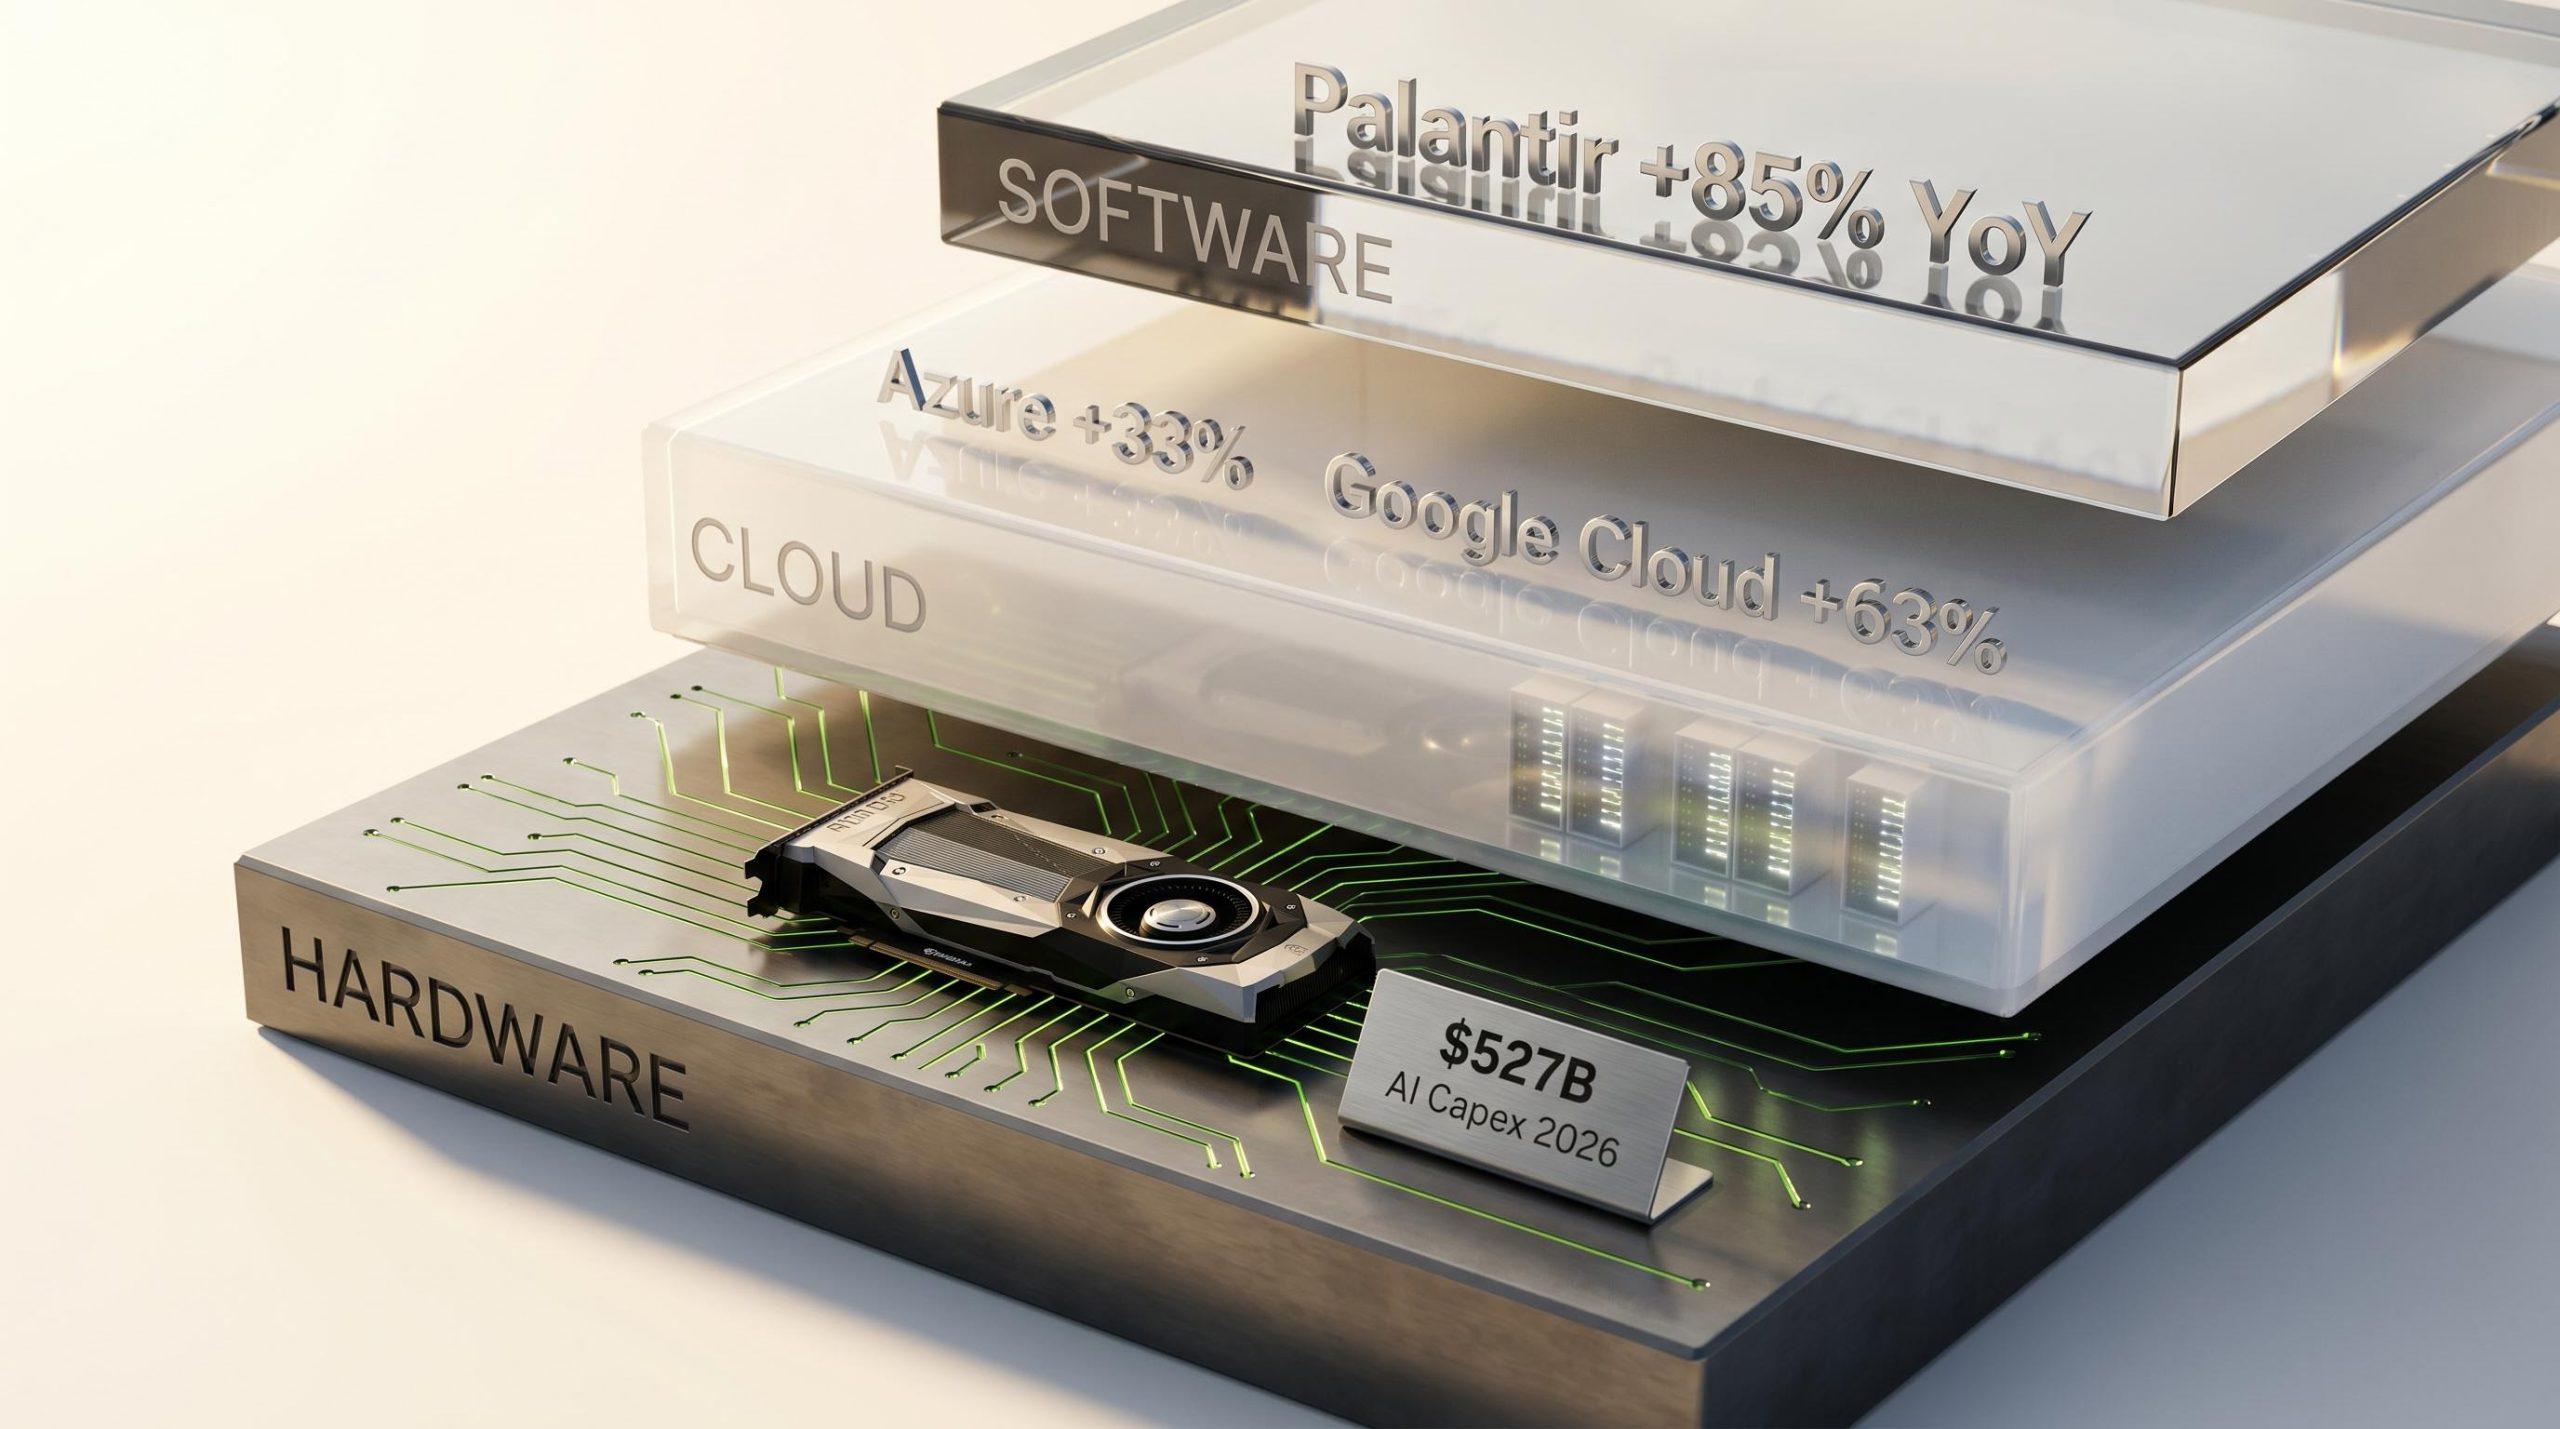
Hyperscalers are on track to spend $527 billion on AI capital expenditure in 2026 alone, according to Goldman Sachs. That figure reframes AI infrastructure not as a speculative theme but as an industrial buildout with identifiable beneficiaries at every layer of the stack. The challenge for most investors is not whether to gain exposure, but where in the value chain their money actually sits, how risk profiles differ between a GPU maker and a cloud platform, and how to construct a position that does not collapse into a single-point bet on one company. This guide walks through a three-layer investment framework covering hardware, cloud, and software, explains the distinct growth drivers and risk characteristics of each layer, identifies the key equities within each, and provides actionable guidance on how to weight and combine these segments into a coherent AI infrastructure portfolio allocation.
The most common mistake investors make with AI exposure is treating it as a single trade. Buying one or two familiar names without understanding where they sit in the value chain creates a portfolio that looks diversified on the surface but concentrates risk in a single segment.
Capital flows through the AI value chain in a specific sequence: hardware manufacturers supply the compute, cloud providers deliver it at scale to enterprises, and software companies build the applications that generate end-user revenue. Each layer has a different demand visibility profile:
AI spending as a share of GDP reached 4.9% of US output in Q1 2026, a level that surpasses both the dot-com era peak of approximately 4.2% and the cloud buildout peak of approximately 3.8%, which helps explain why the $527 billion Goldman Sachs capex figure is not an anomaly but a continuation of a structural reallocation that has already broken historical precedent.
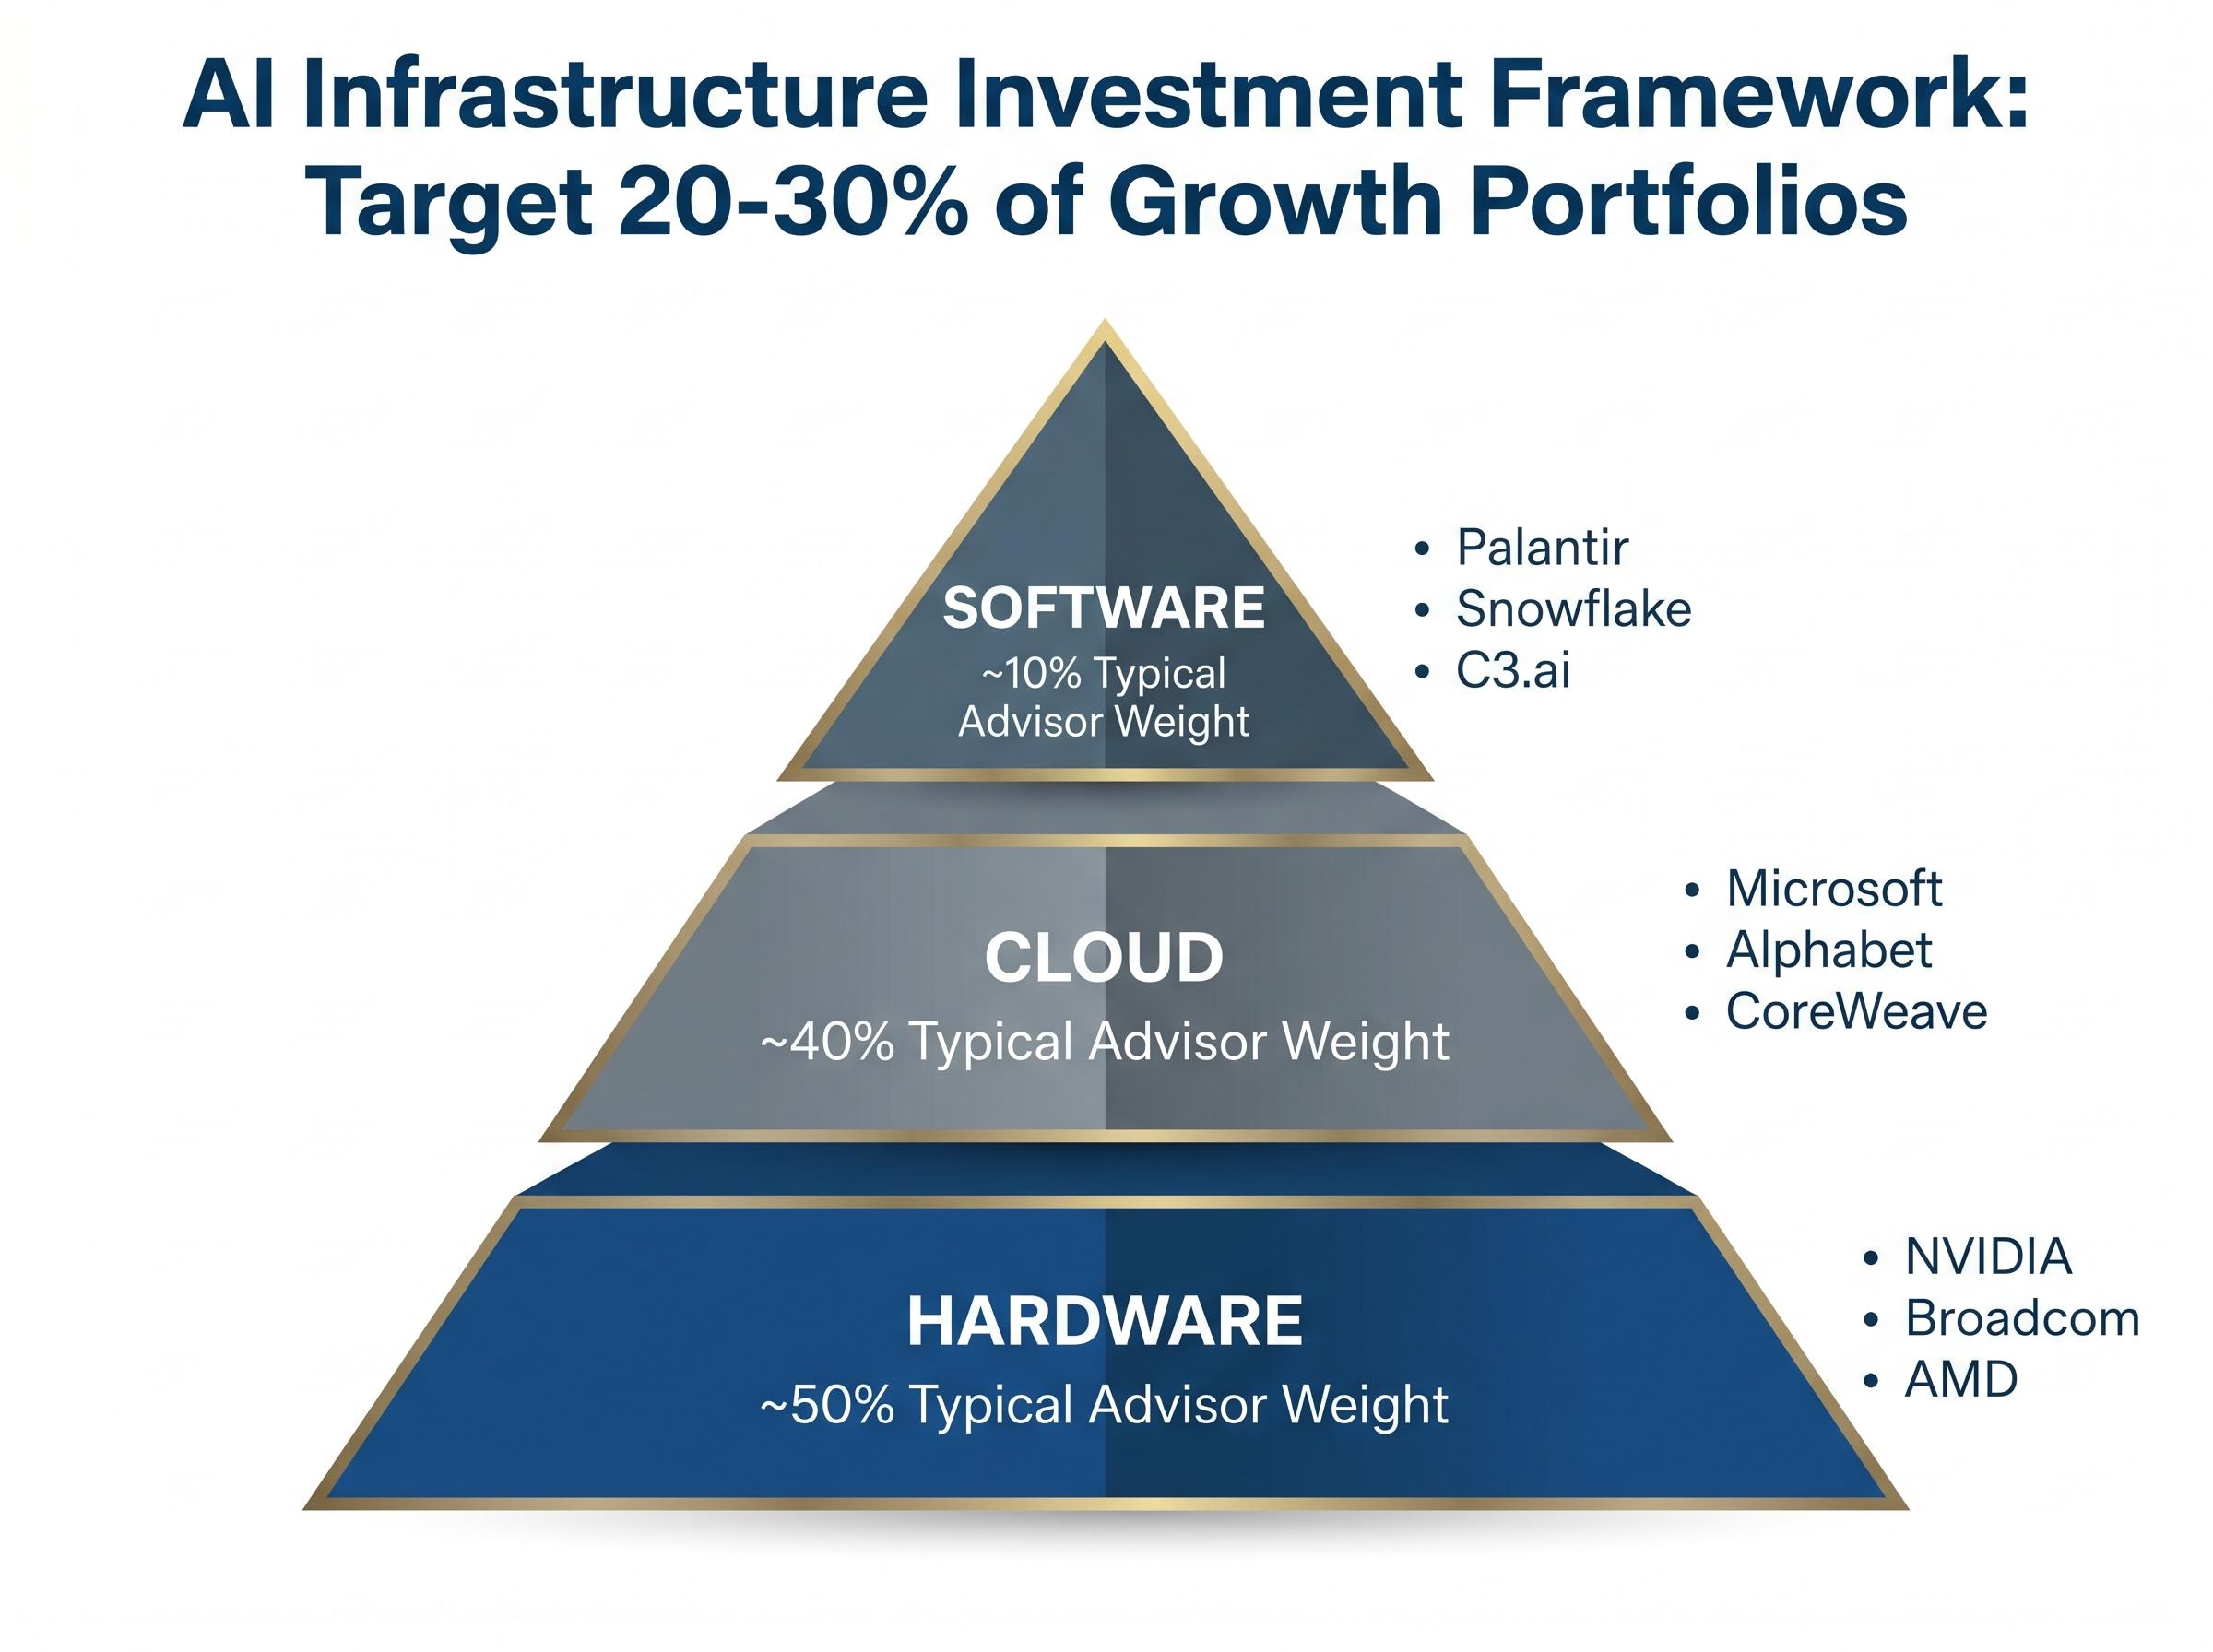
US financial advisors currently recommend 20-30% AI infrastructure allocation in growth portfolios, with a typical layer distribution of approximately 50% hardware, 40% cloud, and 10% software. The table below maps the framework.
| Layer | Representative Names | Primary Revenue Driver | Risk Profile | Typical Advisor Weight |
|---|---|---|---|---|
| Hardware | NVIDIA, Broadcom, AMD | GPU/ASIC procurement orders | High conviction, high multiple | ~50% |
| Cloud | Microsoft, Alphabet, CoreWeave | Enterprise AI workload consumption | Moderate; diversified revenue floor | ~40% |
| Software | Palantir, Snowflake, C3.ai | Enterprise AI platform adoption | High multiple, sentiment-sensitive | ~10% |
Investors who conflate all AI stocks into one category routinely mismatch risk tolerance with actual exposure. The three-layer structure is the prerequisite for building a position that performs the way they intend it to.
NVIDIA remains the anchor of the hardware layer, holding approximately 90% GPU market share. Its most recent verified quarterly revenue was $44.1 billion in Q1 FY2026 (reported 28 May 2025). Analyst price targets range from $150 to $200, with JPMorgan at $185, Morgan Stanley at $190, and Barclays more cautious at $155 on supply chain concerns. The trailing price-to-earnings multiple sits at approximately 70x as of early May 2026.
The upgrade cycle supporting that premium is real. UBS noted in April 2026 that the Blackwell architecture delivers twice the performance per watt compared to Hopper, a technical leap that keeps hyperscaler procurement budgets flowing toward NVIDIA silicon.
UBS Research (April 2026): “Blackwell 2x perf/watt vs. Hopper”
NVIDIA’s Q1 FY2027 results are scheduled for 20 May 2026 and had not been released as of the date of this article. Forward estimates will be revised following that report.
Broadcom offers a structurally different kind of hardware exposure. Its custom ASIC business serves major hyperscalers directly, including Google TPUs and Meta MTIA chips, with a backlog exceeding $10 billion. Piper Sandler projects ASICs will account for 30% of Broadcom’s AI revenue by FY2027. The company’s forward P/E sits at approximately 28x on consensus FY2026 EPS of roughly $14.20, and Goldman Sachs set a price target of $225 on 8 May 2026, against an analyst median of approximately $210. Broadcom’s Q2 FY2026 earnings are scheduled for 3 June 2026.
AMD provides a third option, with Data Centre revenue reaching approximately $7.2 billion in Q1 2026, up 80% year-on-year, competing on price against NVIDIA’s premium positioning.
The choice between these names is not about which is “better” but about portfolio role. NVIDIA is a high-conviction, high-multiple, high-concentration bet suited to investors with higher volatility tolerance. Broadcom offers a lower multiple, a more diversified ASIC customer base, and meaningful networking silicon exposure via its Tomahawk 6 platform.
Key risks across this layer include:
Cloud is the layer where AI infrastructure spending and AI revenue generation overlap. Microsoft and Alphabet are not simply technology conglomerates; they function as the toll roads through which enterprise AI usage flows, and their recent earnings make the growth story legible in a way that raw hardware demand figures are not.
Microsoft’s Q3 FY2026 results, released 29 April 2026, reported net income of $31.78 billion and earnings per share of $4.27. The Intelligent Cloud segment generated approximately $28.5 billion in revenue, up 21% year-on-year, with Azure growing 33% year-on-year. The company’s FY2026 capex guidance sits at approximately $56 billion, up roughly 50% year-on-year. Morgan Stanley projects Azure growth of 35-40% for calendar year 2026, with total AI revenue estimated at $45 billion by FY2027.
Alphabet’s Q1 2026 results, also released 29 April 2026, reported total revenue of $109.9 billion. Google Cloud revenue reached $20.0 billion, up 63% year-on-year, with Q1 capex of $17 billion (up 65% year-on-year). JPMorgan projects Google Cloud reaching a $70 billion annual run-rate by the end of 2026.
| Metric | Microsoft Azure | Google Cloud |
|---|---|---|
| Recent Cloud Revenue | ~$28.5B (Q3 FY2026) | $20.0B (Q1 2026) |
| YoY Growth Rate | +33% (Azure) | +63% |
| 2026 Capex Guidance | ~$56B | $17B (Q1 alone) |
| Forward AI Revenue Estimate | $45B FY2027 | $70B run-rate by end 2026 |
| Analyst Growth Projection | +35-40% CY2026 (Morgan Stanley) | +30% CY2026 (JPMorgan) |
Cloud names offer investors AI infrastructure exposure with the partial buffer of diversified revenue streams, making them an appropriate core holding even for investors with moderate risk tolerance. The non-AI segments of these businesses provide a revenue floor that pure-play AI companies cannot match.
For investors seeking maximum AI cloud exposure, CoreWeave (with $2 billion+ in annual recurring revenue, backed by SoftBank funding) and Lambda Labs (estimated at approximately $1.2 billion ARR) offer alternatives. The trade-off is direct: higher AI revenue purity comes with no revenue diversification buffer and significantly higher capital intensity. These names are not suitable for conservative allocations and should represent a small satellite position at most.
The software layer captures something the other two layers do not: leverage economics. Once the hardware is built and the cloud infrastructure is running, software companies sit on top of that stack and capture margin expansion as AI adoption scales. Their unit economics improve without proportional cost increases, which is why this layer commands the highest valuation multiples in the AI stack and why position sizing here is the most consequential decision investors face.
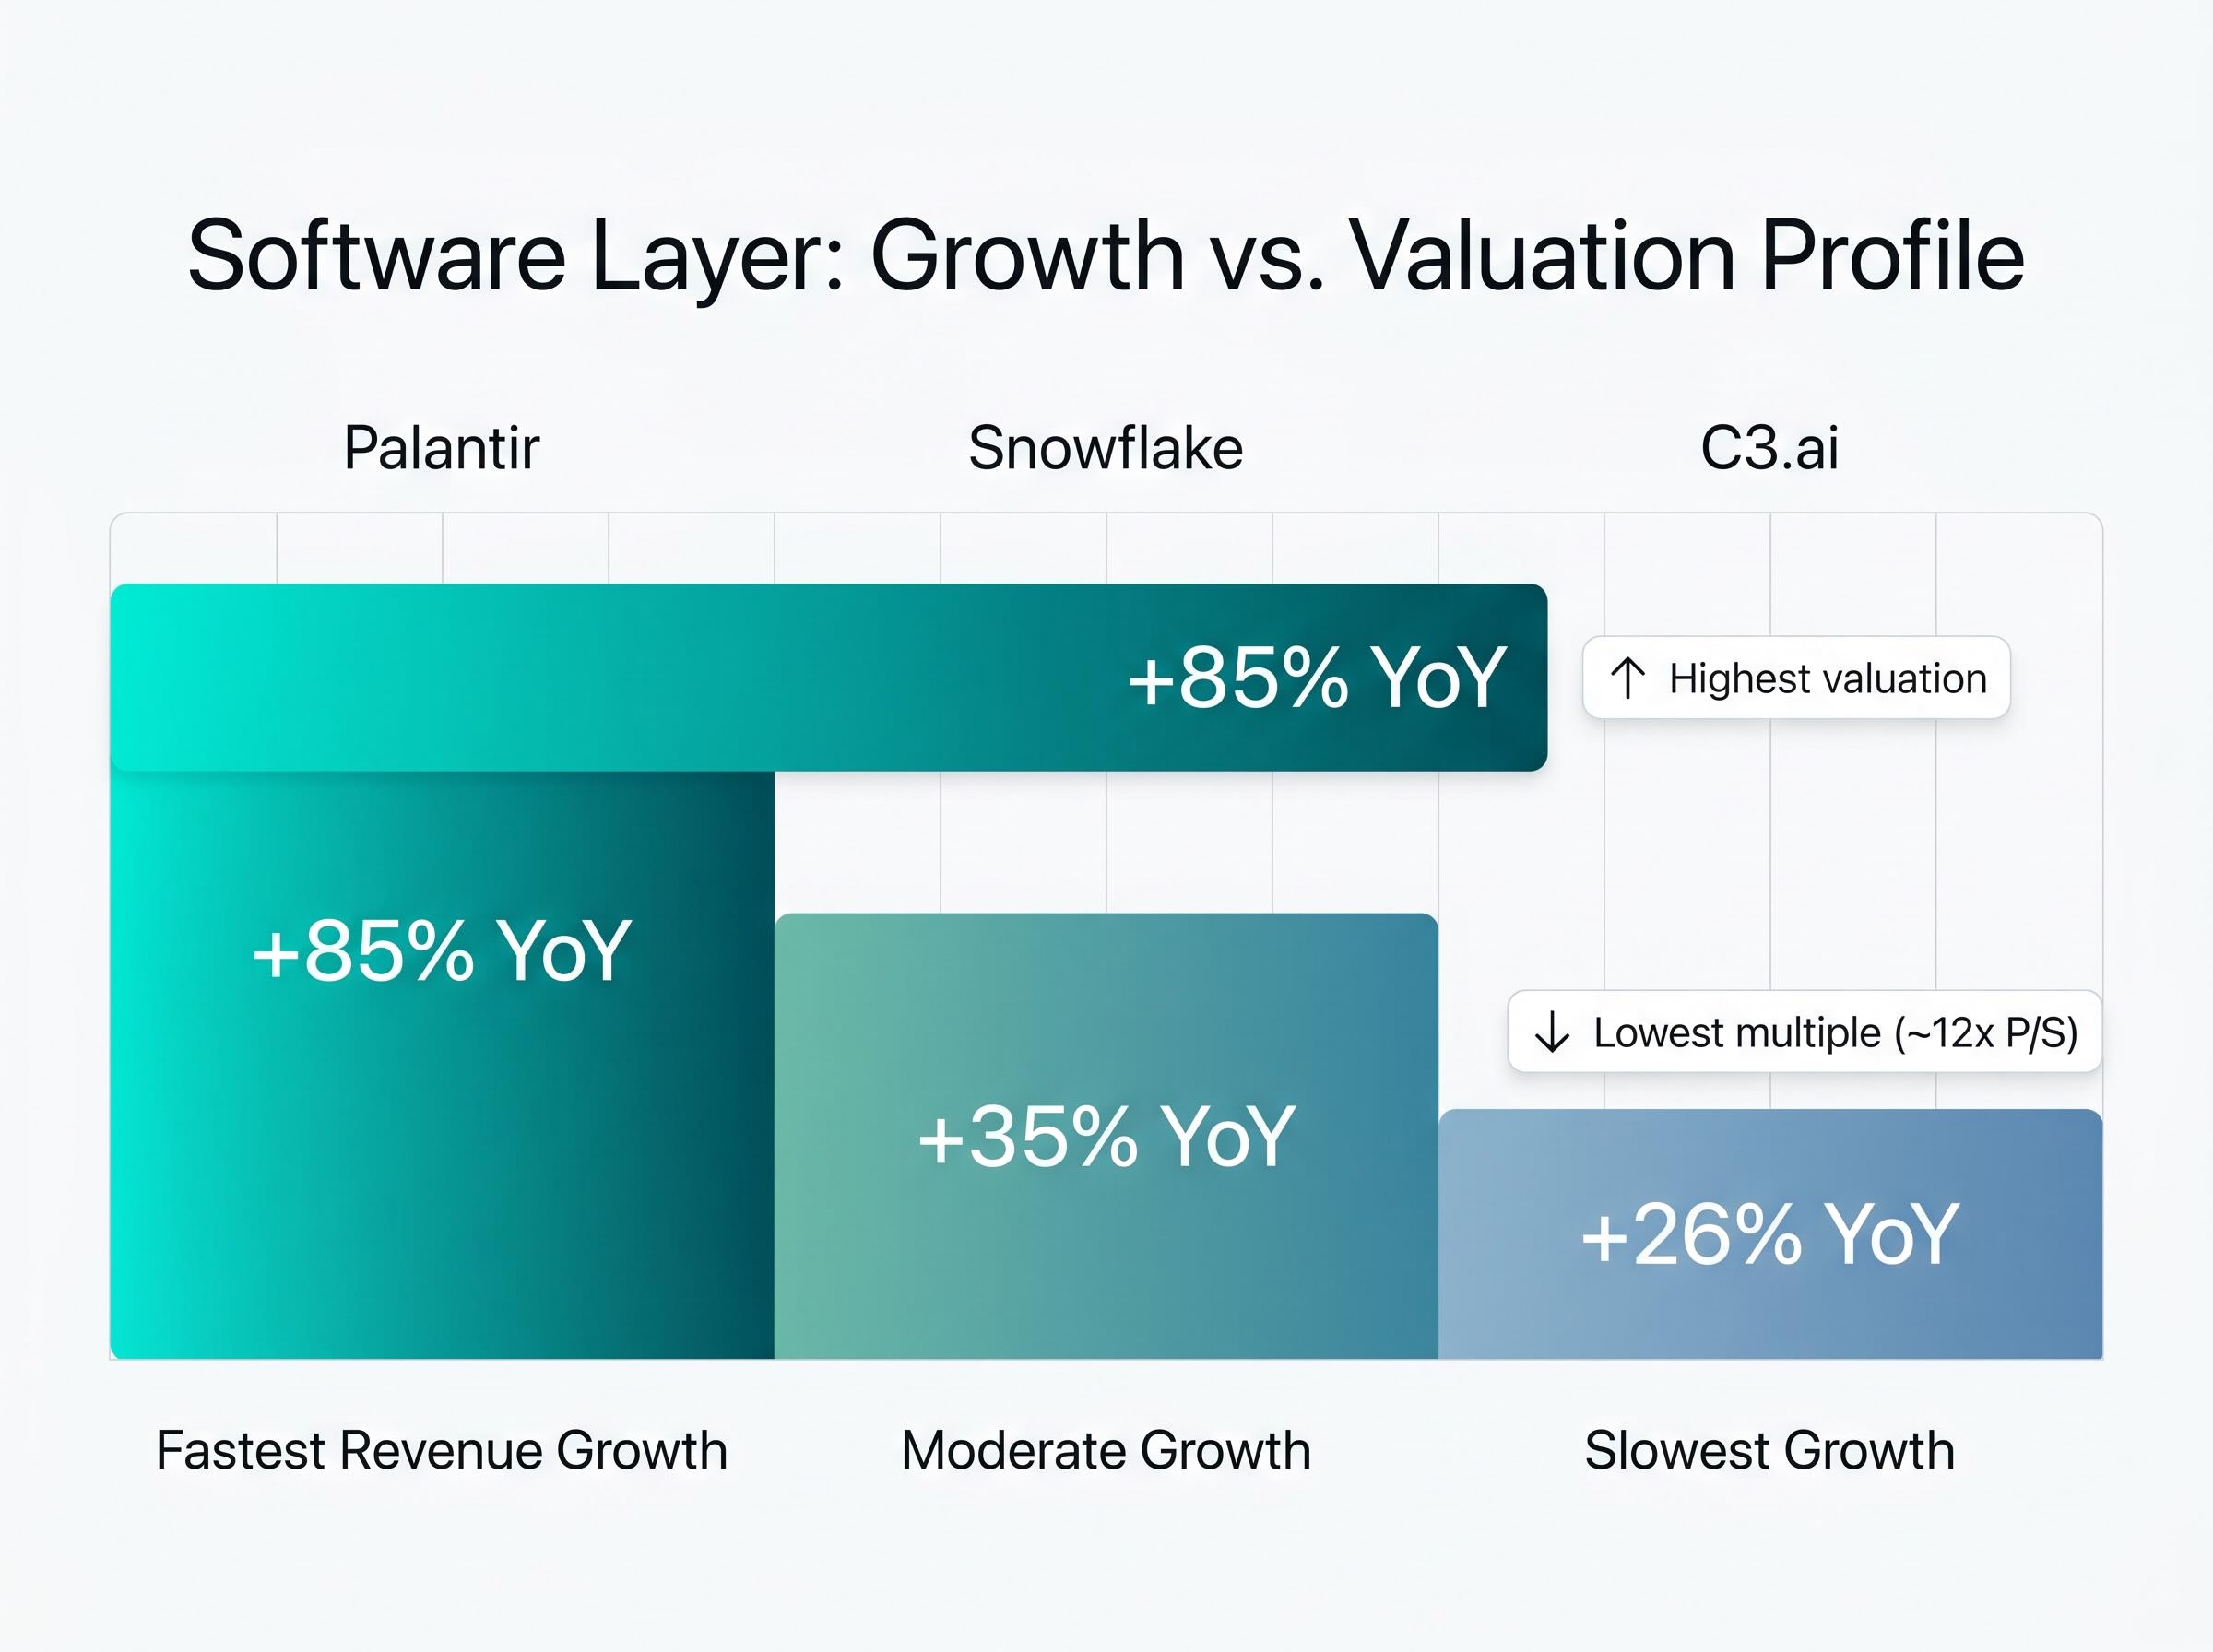
Palantir is the primary case study. Q1 2026 US revenue reached $1.282 billion, with US Commercial revenue guidance raised to +120% year-on-year growth for FY2026. Total company revenue grew 85% year-on-year, and management raised full-year guidance to 71% year-on-year growth. As of 9 May 2026, Palantir’s market capitalisation sat at approximately $306-$330 billion. At that scale, the implied valuation multiples are significantly elevated; specific EV/Revenue and P/S ratios should be sourced from FactSet or Bloomberg for current figures. Palantir’s dual revenue mix spanning government and enterprise contracts provides more stability than a pure-play enterprise software name, but the premium the market assigns to that growth reflects expectations that leave limited room for disappointment.
Wedbush (May 2026): “Palantir ahead of C3.ai on margins”
The software layer is not a single-name bet. Snowflake’s AI Data Cloud generated approximately $900 million in Q1 2026 revenue, up 35% year-on-year, at a lower valuation multiple than Palantir. C3.ai reported Q4 FY2026 revenue of approximately $98 million (up 26% year-on-year) with a P/S ratio of roughly 12x, offering slower growth at a more compressed price.
Enterprise AI adoption rates help explain why the software layer commands the highest valuation multiples but also why those multiples are fragile: only an estimated 12-20% of enterprises achieve meaningful operational AI embedding, and 70-80% of pilots fail or stall, which means the addressable market for Palantir, Snowflake, and C3.ai is structurally smaller than headline AI spending figures suggest.
The 10% software weighting in advisor models reflects valuation risk and volatility, not lack of conviction in the growth story. GMO and other value-oriented observers flagged AI software multiples in April 2026 as the most stretched part of the stack, particularly at trailing P/E multiples above 70x. This is a sizing discipline issue. Even investors who believe software captures the highest long-duration upside in AI should calibrate position size to account for the reality that multiple compression in this layer can erase months of gains in a single earnings cycle.
The framework has identified the layers and the names. The practical question is how to combine them into a position. A four-step process provides a starting point:
Vanguard’s March 2026 model allocation suggests 25% NVDA/AVGO, 30% MSFT/GOOG, 15% PLTR/SNOW, and 30% broad tech. Bank of America maintains an “Overweight” rating on AI infrastructure as of May 2026.
For investors who prefer ETF exposure, three vehicles cover the space. Portfolio volatility for AI-heavy allocations is estimated at 20-30% annualised, which makes diversified vehicles particularly relevant for moderate risk profiles.
| ETF Name/Ticker | AUM | Key Holdings Concentration | Launch | Primary Layer |
|---|---|---|---|---|
| Global X BOTZ | $3.2B | ~40% NVIDIA/Broadcom | Pre-2026 | Hardware-heavy |
| WisdomTree AIIQ | ~$500M | ~40% NVIDIA/Broadcom | Feb 2026 | Cross-layer |
| STOXX Global AI Infra | $1.2B inflows Q1 2026 | Diversified | Pre-2026 | Cross-layer |
Total flows into AI-themed ETFs reached approximately $25 billion in H1 2026, according to ETF.com data from 8 May 2026.
For investors who have already built an AI infrastructure allocation and are now managing drift as hardware names appreciated significantly in 2024 and 2025, our dedicated guide to portfolio rebalancing after equity rallies covers the Vanguard 5% drift threshold methodology, the tax-efficient execution sequence, and specific strategies for restoring a portfolio to its intended risk level without triggering unnecessary capital gains.
A three-layer framework manages diversification risk within the AI infrastructure theme. It does not eliminate sector-level or regulatory risks that could affect all three layers simultaneously. Each layer carries specific vulnerabilities that require active monitoring.
Hardware risks:
The BIS export controls on advanced AI chips impose case-by-case license review requirements for advanced computing semiconductors destined for China and Macau, with stringent certification conditions that create direct revenue exposure for NVIDIA and AMD given their dependence on that market.
Cloud risks:
Software risks:
GMO (April 2026): The firm flagged valuation bubble risk, particularly at trailing P/E multiples of 70x+, as the most vulnerable point in the AI investment thesis.
Three signals form the monitoring framework: regulatory filings and FTC developments for hardware, hyperscaler earnings capex guidance revisions for cloud, and the P/S multiple relative to revenue growth rate for software. The investor who tracks these specific inputs is better positioned to act before a risk becomes a loss.
Near-term catalysts include NVIDIA’s Q1 FY2027 results scheduled for 20 May 2026 and Broadcom’s Q2 FY2026 results scheduled for 3 June 2026.
The three-layer framework turns a macro thesis into a structured, risk-aware equity position. Hardware offers near-term earnings visibility, cloud provides diversification alongside growth, and software offers long-duration upside with elevated multiple risk. The asymmetry across layers is the point: each serves a different portfolio function and tolerates a different level of volatility.
The actionable step is straightforward. Review current AI holdings against the three-layer model. Identify which layer is over- or under-represented. Use the 50/40/10 baseline and the Vanguard allocation benchmarks as a recalibration guide. The buildout is real, the revenue is verifiable, and the framework exists to ensure the position reflects intention rather than accident.
This article is for informational purposes only and should not be considered financial advice. Investors should conduct their own research and consult with financial professionals before making investment decisions. Past performance does not guarantee future results. Financial projections referenced in this article are subject to market conditions and various risk factors.
AI infrastructure stocks are equities in companies that build, supply, or operate the foundational technology required to run artificial intelligence systems, spanning hardware manufacturers like NVIDIA and Broadcom, cloud platforms like Microsoft and Alphabet, and enterprise software companies like Palantir and Snowflake.
US financial advisors typically recommend a 50/40/10 split across hardware, cloud, and software within a total AI infrastructure allocation of 20-30% of a growth portfolio, with hardware receiving the largest weighting due to its higher near-term earnings visibility.
NVIDIA holds approximately 90% GPU market share and offers high-conviction but high-multiple, high-volatility exposure, while Broadcom serves hyperscalers through custom ASICs with a lower forward P/E of roughly 28x and a more diversified customer base including Google and Meta.
AI software companies like Palantir trade at significantly elevated multiples because their economics benefit from leverage as adoption scales, but GMO flagged in April 2026 that trailing P/E multiples above 70x leave limited room for error, meaning a single quarter of growth deceleration can trigger sharp price declines.
Sector-wide risks include FTC antitrust scrutiny of NVIDIA's GPU market dominance, US export controls on advanced AI chips destined for China, geopolitical concentration risk through TSMC in Taiwan, and the possibility that hyperscaler capex outpaces enterprise AI workload consumption, stranding capital across the stack.