What JB Hi-Fi’s Sales Data Says About ASX Discretionary Stocks
45 mins ago

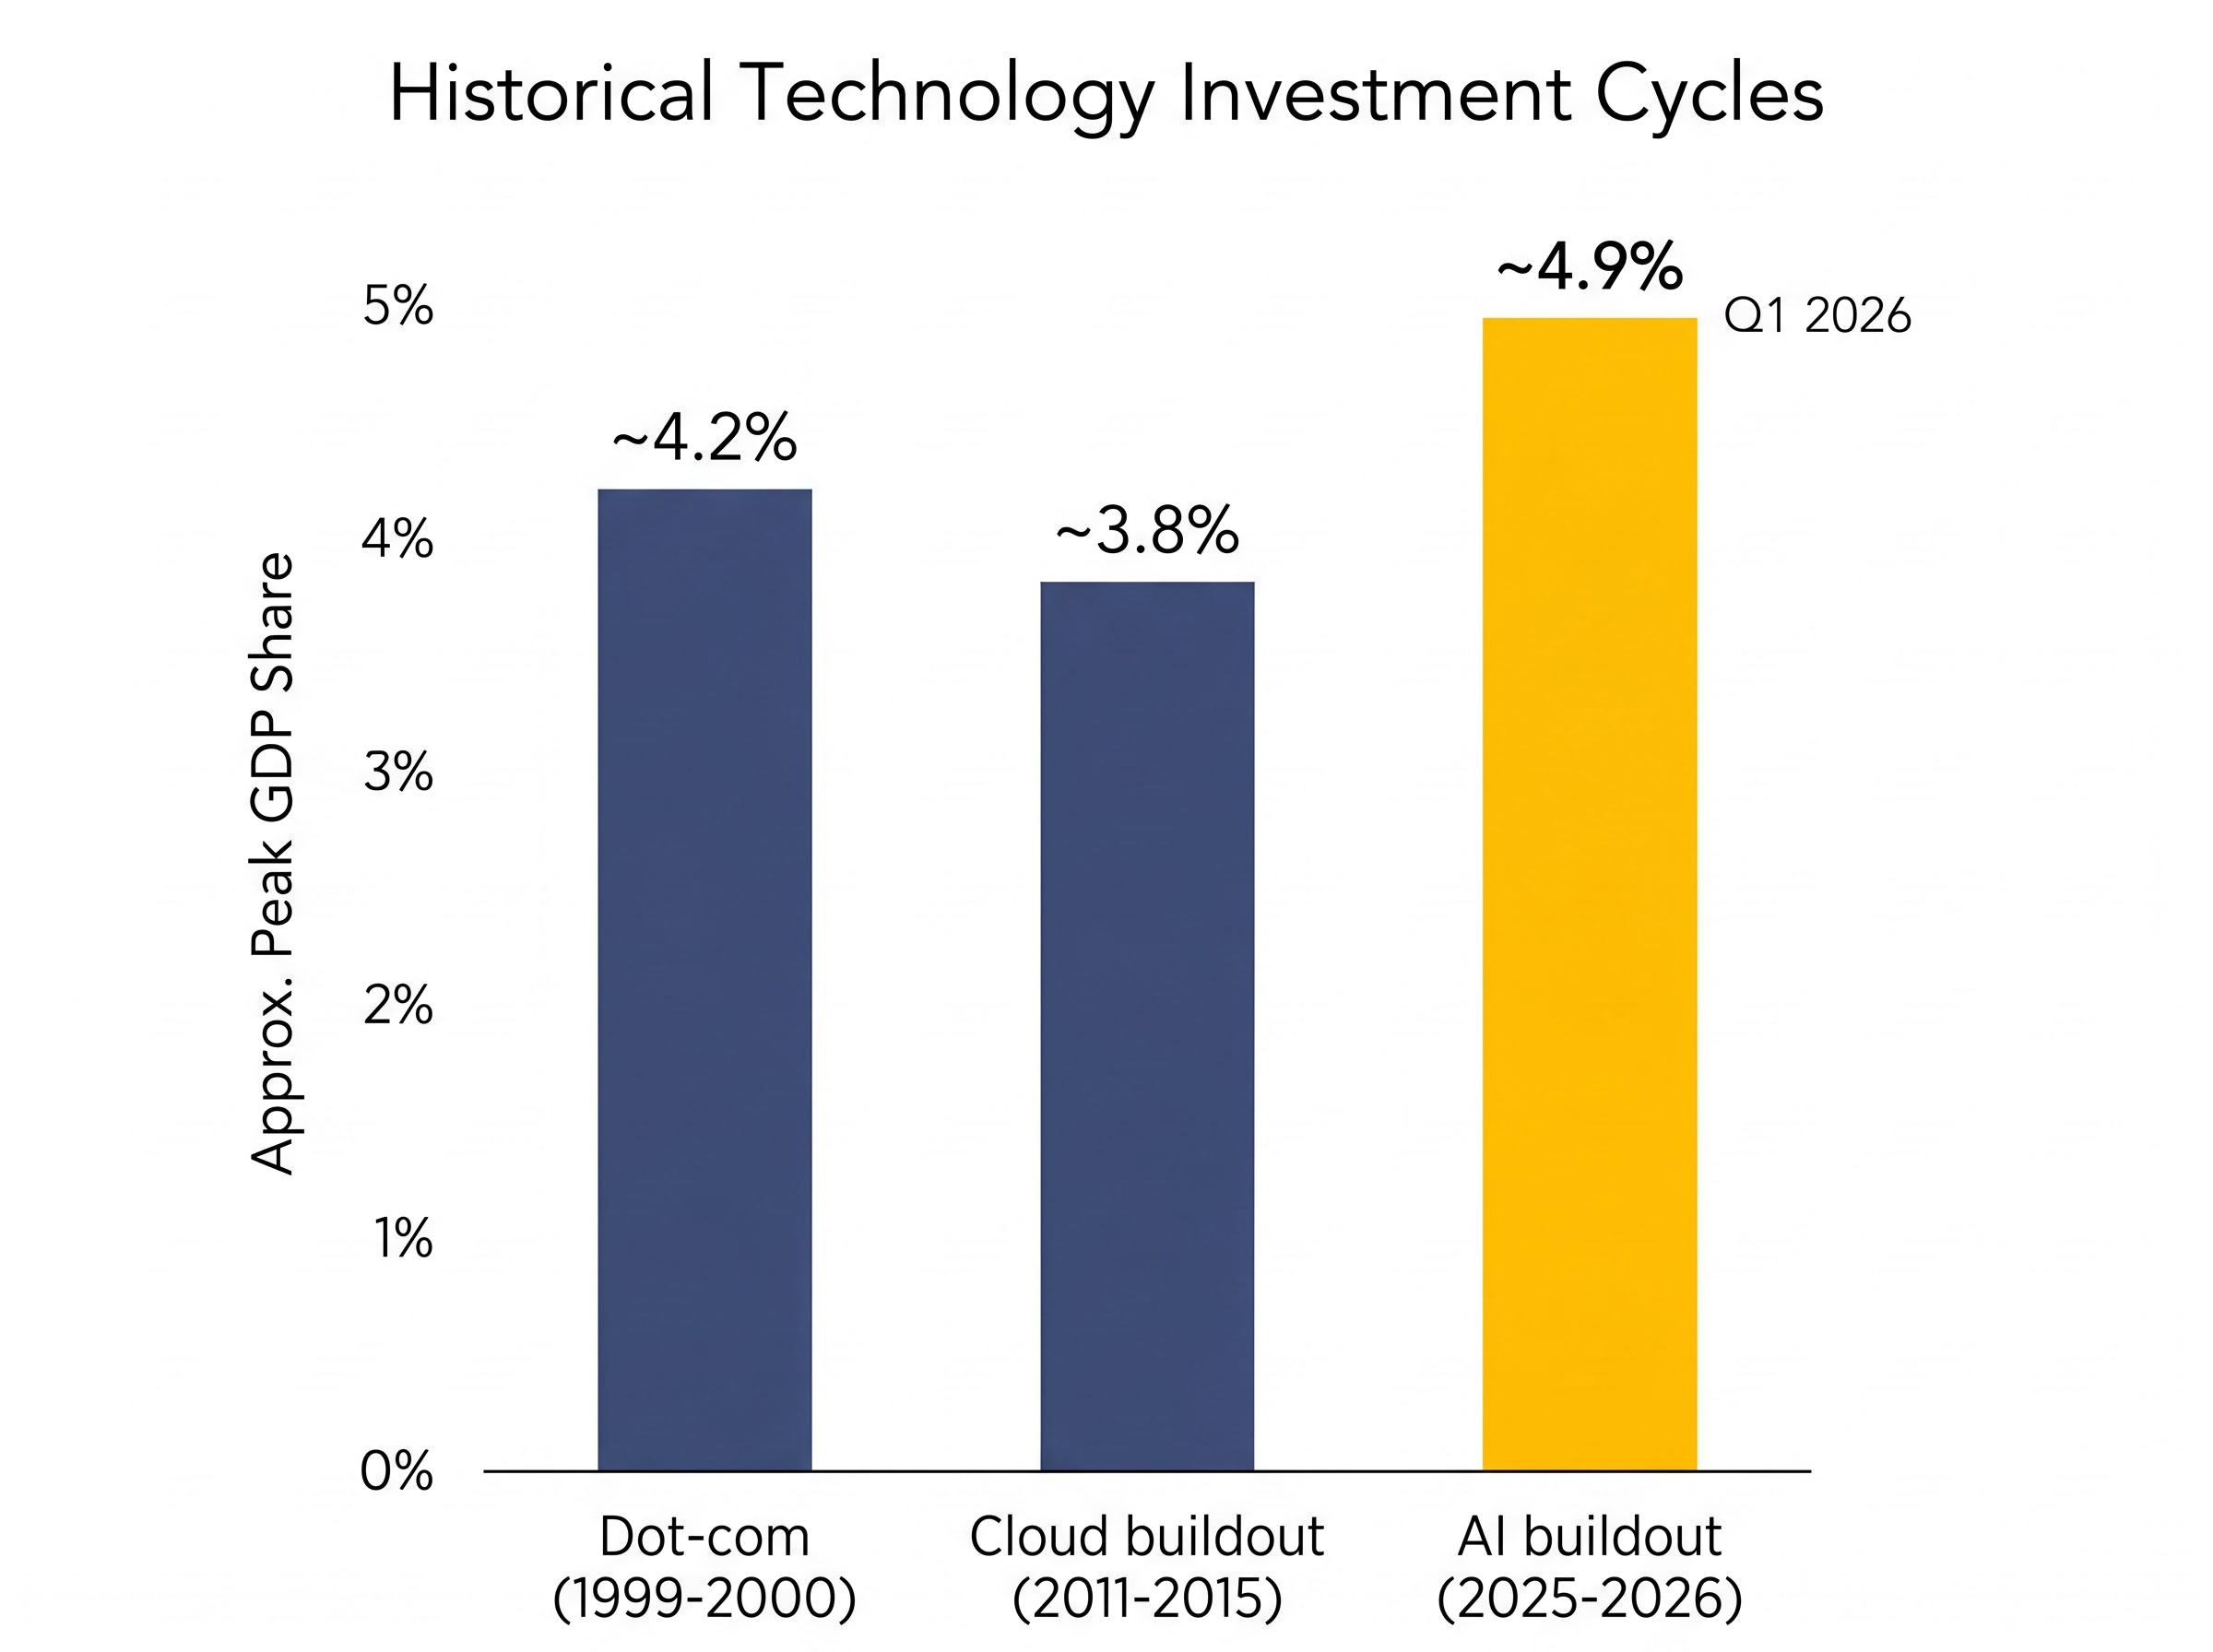
IT hardware and software spending reached 4.9% of GDP in Q1 2026, according to BCA Research, surpassing every prior technology investment peak on record. That figure sits above the dot-com era’s approximate 4.2% peak and the cloud buildout’s 3.8%, placing the current AI-driven capital cycle in territory no prior technology wave has occupied. For investors holding technology or growth-oriented portfolios, the number raises a direct question: is this cycle’s engine built to last, or is the market approaching the same cliff the 1990s internet boom eventually hit?
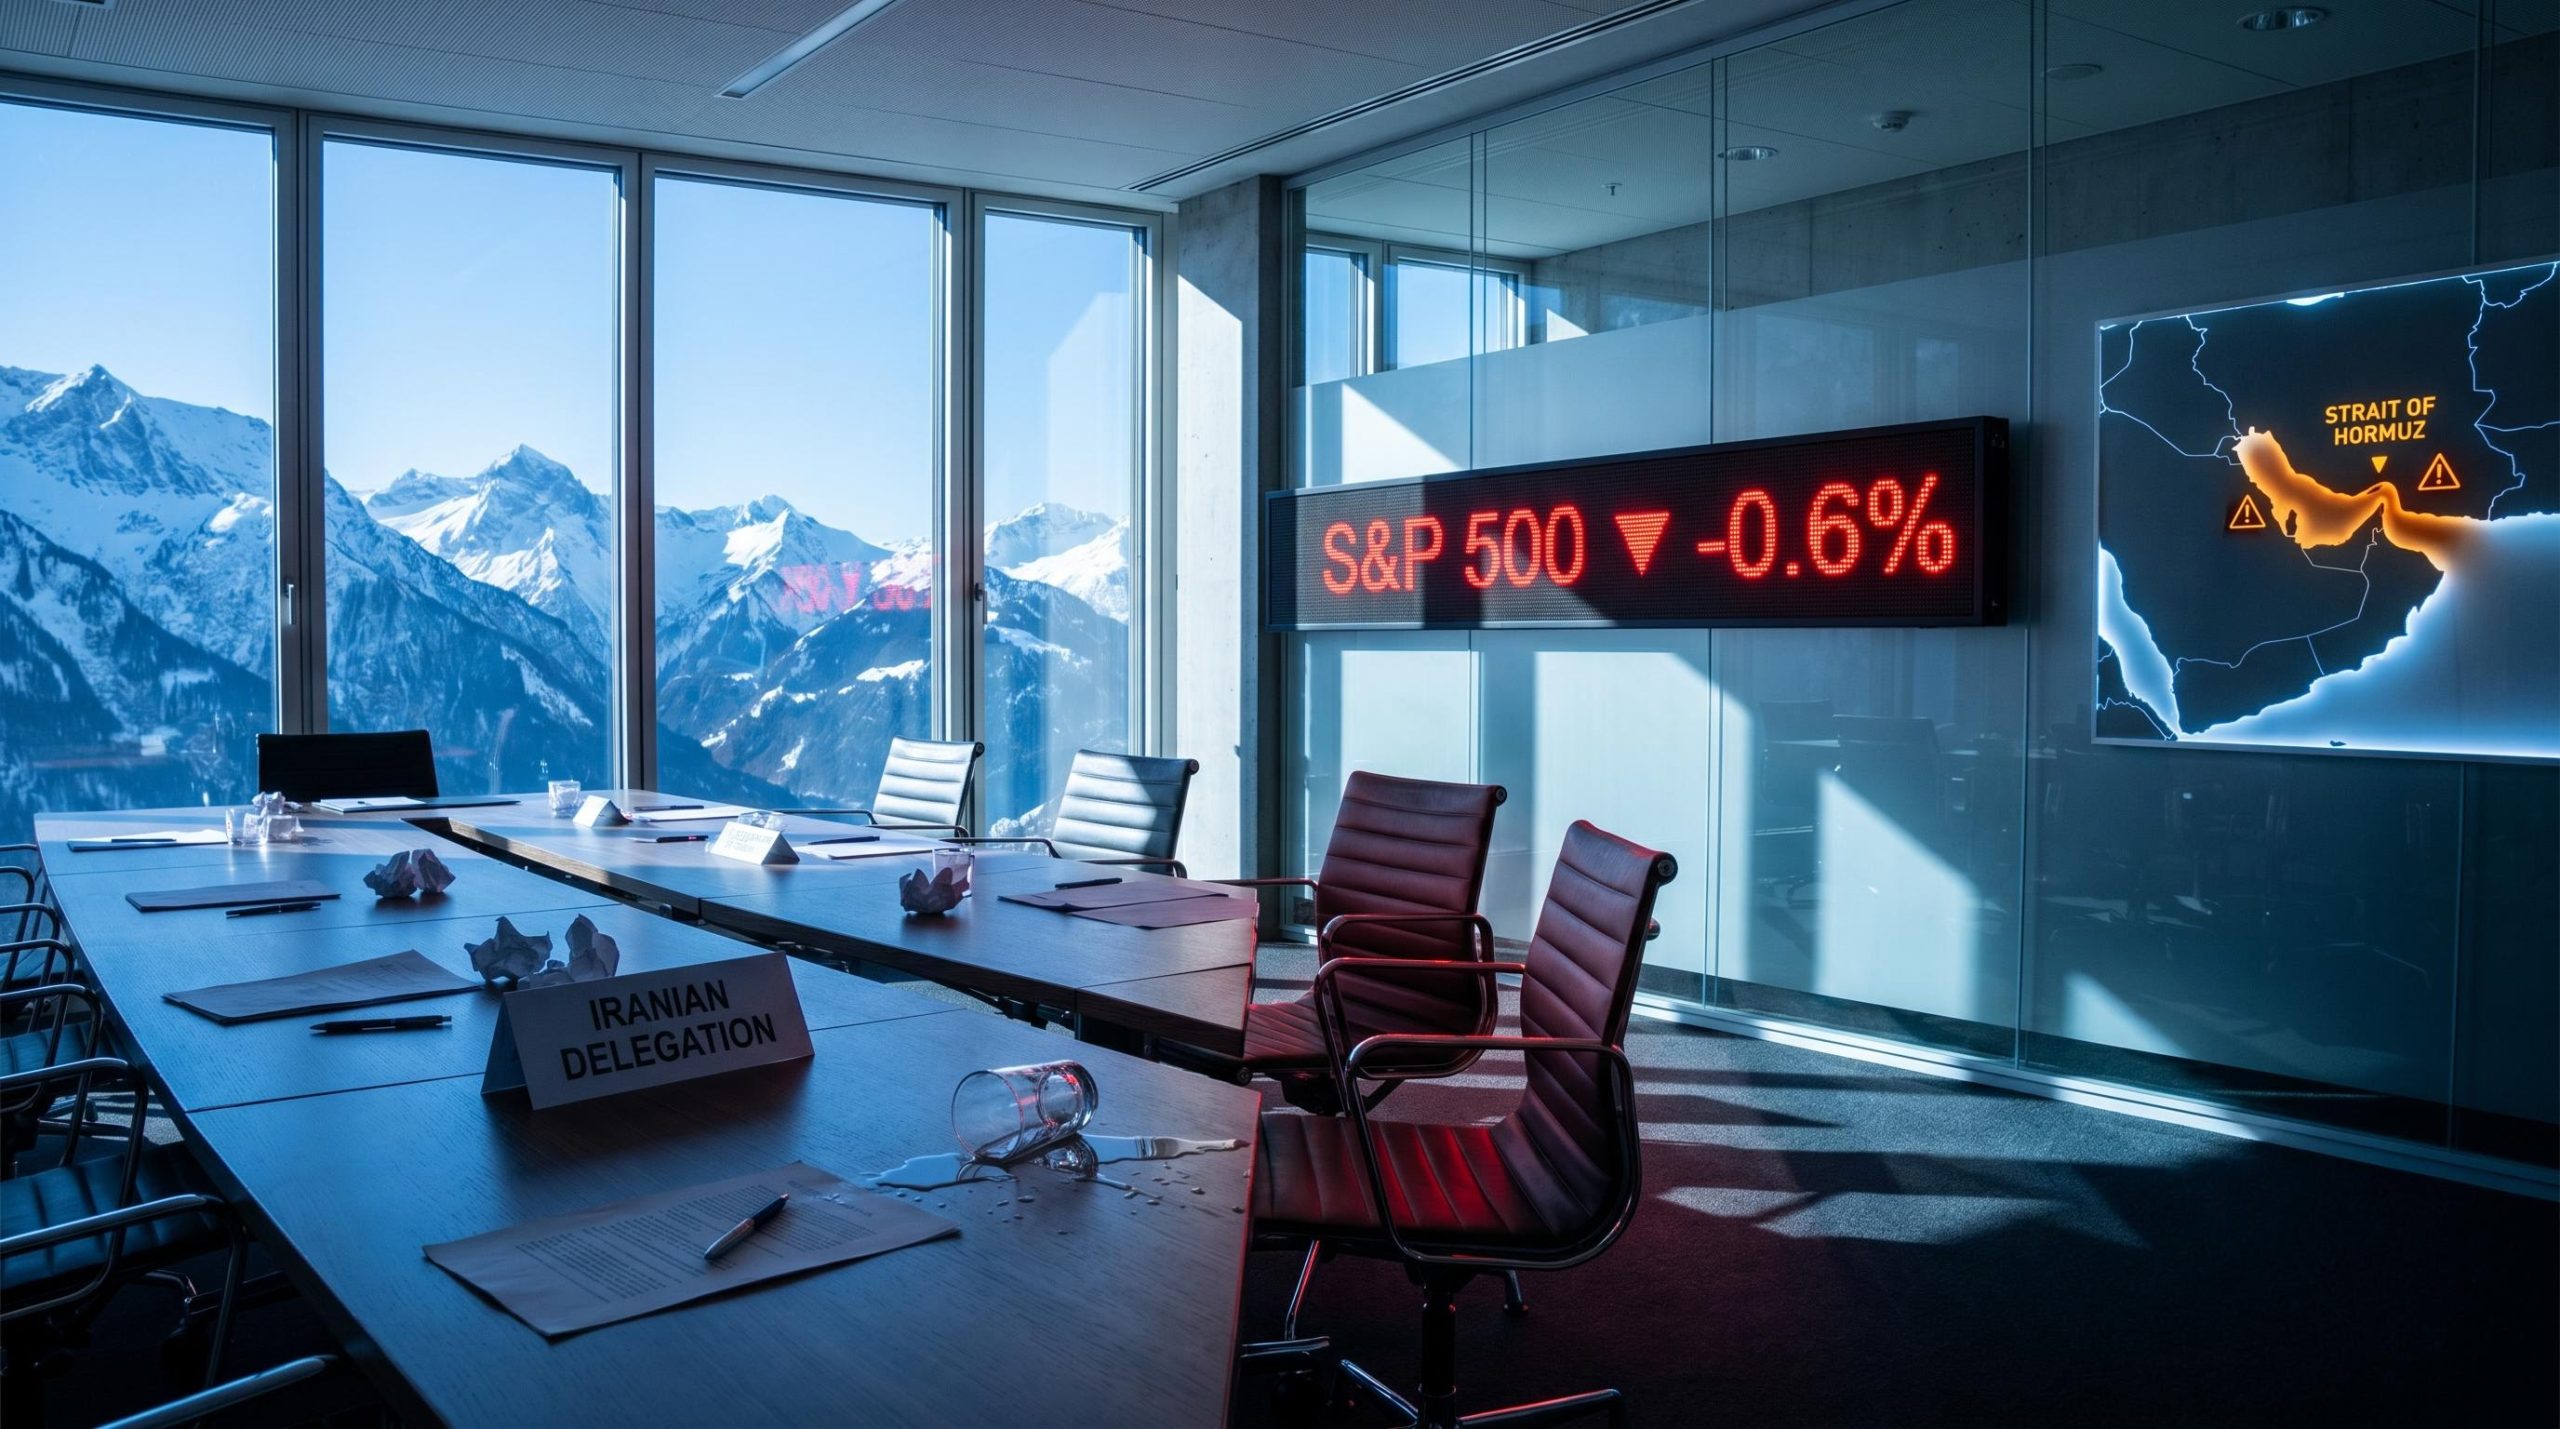
The 4.9% figure arrives against a complicated macro backdrop. Oil prices have surged above $110 per barrel following Strait of Hormuz disruptions, creating cost pressures for energy-intensive data centre operators. Yet hyperscaler capital expenditure commitments for 2026 collectively sit in the $600-$805 billion range, showing no deceleration. This analysis maps what the record IT spending figure means in practical terms for US equity investors: which sectors sit in the direct line of capital flow, where the risks concentrate, how the current cycle compares to historical analogues, and what positioning decisions the data supports as the AI investment boom matures.
The number deserves a moment before context softens it. 4.9% of GDP committed to IT hardware and software in a single quarter means the United States is allocating a larger share of its economy to technology infrastructure than at any point in modern history, including the period when the dot-com bubble was at its most inflated.
BCA Research reported the figure on 6 May 2026, framing it against two prior cycle peaks. The comparison table below places the current cycle alongside its predecessors. It is worth noting that BCA Research’s historical GDP share figures have not been independently verified against Bureau of Economic Analysis primary data, and should be treated accordingly.
| Investment Cycle | Approx. Peak GDP Share | Primary Infrastructure | Market Outcome |
|---|---|---|---|
| Dot-com (1999-2000) | ~4.2% | Telecom / internet fibre | Nasdaq fell ~78%; infrastructure eventually absorbed |
| Cloud buildout (2011-2015) | ~3.8% | AWS / Azure data centres | Soft landing; +200% returns for cloud infrastructure plays |
| AI buildout (2025-2026) | ~4.9% | GPU clusters / AI data centres / power | Outcome pending |
Capital deployed at this proportion of GDP is a macro signal, not just a technology story. AI-related investments are documented as contributing approximately 1.5 percentage points of GDP growth, meaning earnings across industries well beyond the tech sector are being shaped by this spending cycle. Combined hyperscaler commitments for 2026, estimated at $600-$805 billion, provide the demand anchor that turns the GDP figure from a statistical curiosity into a capital allocation question every US equity investor needs to answer.
Four companies account for the bulk of the spending, and none of them are making discretionary bets. Each commitment reflects a competitive position where falling behind on AI compute infrastructure carries greater risk than overspending.
| Company | 2026 CapEx Estimate | Primary Use Case | Key Infrastructure Dependency |
|---|---|---|---|
| Microsoft | $80B (FY2026) | AI data centres (70%+ of total) | Nvidia GPUs, Azure cloud regions |
| Alphabet | $75B | AI servers and TPUs | Custom TPU chips, Google Cloud |
| Amazon | $100B | AWS AI infrastructure | Trainium chips, AWS regions |
| Meta | $65B | Llama model training | 600,000+ Nvidia H100 GPUs |
Meta’s commitment to 600,000+ Nvidia H100 GPUs illustrates a procurement dynamic that itself creates demand visibility for suppliers: compute scarcity is forcing large commitments years in advance, locking in revenue pipelines for semiconductor manufacturers regardless of near-term macro volatility.
Beyond the four hyperscalers, the Stargate Project, a $500 billion US AI data centre commitment from SoftBank, Oracle, and OpenAI, signals sovereign-scale confidence in AI infrastructure durability. The combined picture is one of competitive necessity rather than exuberance. These are profitable companies with growing revenue bases making infrastructure commitments they believe are required to maintain market position. That distinction matters for what follows.
Note: individual company earnings URLs returned verification errors during research; investors should confirm figures against primary earnings filings.
The capital does not flow to a single sector. It moves through three distinct tiers, each with its own demand driver and investment characteristics:
Morgan Stanley (December 2025) estimated a $2.9 trillion global data centre buildout through 2028, positioning the AI infrastructure cycle as one of the largest capital deployment programmes in modern economic history.
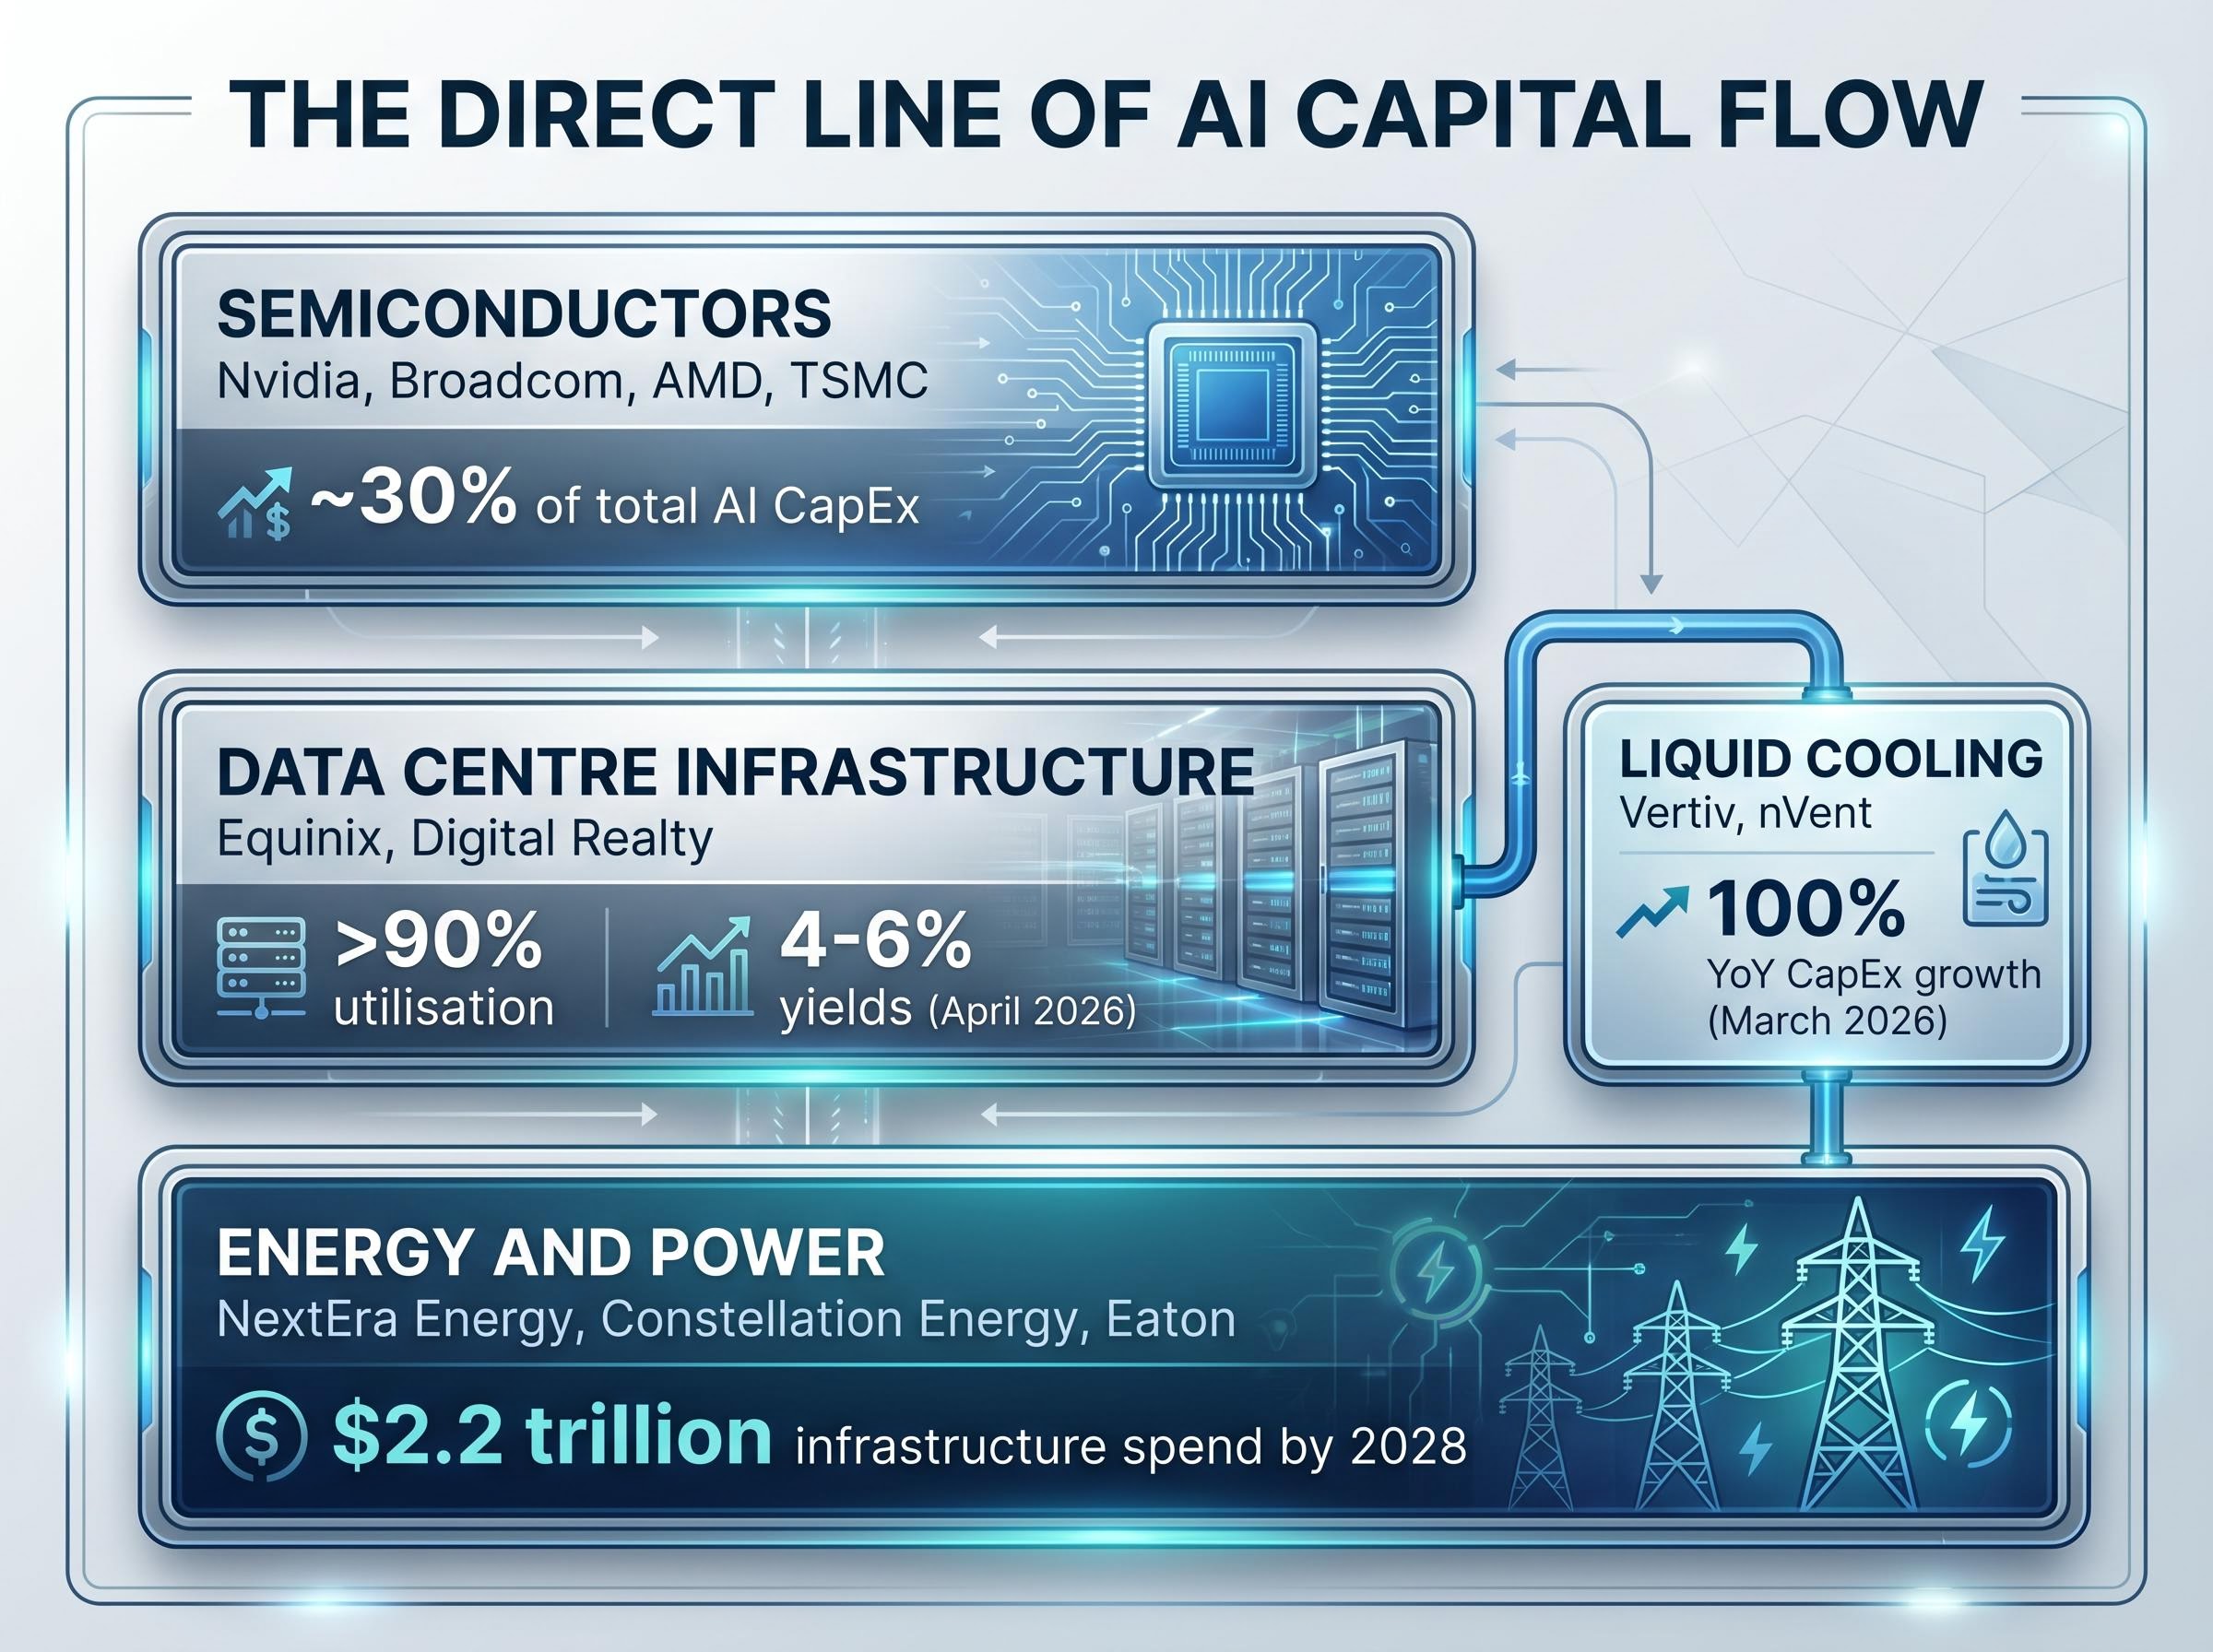
Liquid cooling represents an infrastructure sub-theme that has received less attention relative to its growth trajectory. JPMorgan cited liquid cooling CapEx growing 100% year-over-year as of March 2026, identifying Vertiv and nVent as primary beneficiaries of the thermal management demands that high-density GPU clusters create.
For US retail investors not selecting individual names, broad-basket vehicles offer practical exposure. Invesco QQQ provides diversified semiconductor and large-cap tech access through the Nasdaq 100. AI-focused and semiconductor sector ETFs offer more targeted positioning across the infrastructure layer.
The question of durability comes down to a structural distinction. During the dot-com era, capital flowed to companies with minimal revenue and no established earnings. The current cycle is different in one measurable respect: the companies doing the spending are profitable. The Magnificent Seven reported Q1 2026 earnings growth of approximately 19%, providing a fundamental underpinning that was absent in 1999-2000.
That said, profitability of the spenders does not automatically validate the spending. Goldman Sachs framed AI CapEx as sustainable at 25-30% of hyperscaler revenue through 2028, with return on investment emerging in enterprise deployments citing 3-5x productivity gains.
Goldman Sachs (April 2026) described AI capital expenditure as “sustainable at 25-30% of hyperscaler revenue through 2028,” with ROI beginning to emerge in enterprise deployments.
The open question, and the one that separates a durable buildout from a bubble, is whether monetisation of AI products to end users will justify the infrastructure already committed. The “picks and shovels” thesis, investing in the infrastructure layer that is required regardless of which AI application ultimately succeeds, exists precisely because that monetisation question remains contested.
Three diagnostic questions help investors assess durability as new data arrives:
Washington Crossing Advisors noted in 2025 that the current profit cycle mirrors the 1990s internet expansion, with the S&P 500 up approximately 79% since 2022 lows, but with earnings support that contrasts with the 2000 bubble conditions. The Nasdaq 100 trades at a trailing P/E of approximately 36.62 and a forward P/E of approximately 23.18 as of May 2026 (MacroMicro, GuruFocus), suggesting the market is pricing in meaningful earnings growth rather than paying purely speculative multiples.
Four distinct risk categories deserve specific attention from investors with AI-related exposure:
The IMF’s Pierre-Olivier Gourinchas warned on 22 April 2026 that the AI surge risks becoming a bubble, with supply potentially exceeding demand by 2027. BCA Research, the same source behind the 4.9% GDP figure, characterised current levels as signalling peak euphoria and urged watchfulness for a cyclical peak.
The Strait of Hormuz disruption connects the AI infrastructure theme directly to the broader macro moment. Reuters confirmed oil price surges above $110 per barrel as of March 2026, with reduced consumption impacts rippling through energy-intensive industries.
For data centre operators, energy is a primary operating cost. Sustained oil prices at these levels compress margins even as revenue from cloud and AI services grows. BCA Research cited deep backwardation in oil futures as one of seven recession buffers, suggesting traders expect the disruption to be short-lived. If that expectation proves correct, the margin headwind is temporary. If it does not, data centre operators face a cost structure that the current CapEx commitments did not price in.
The 4.9% of GDP figure represents a structural investment cycle operating at a scale no prior technology wave has matched. The earnings profiles of the companies doing the spending, combined with multi-year CapEx commitments in the $600-$805 billion range, distinguish this cycle from the dot-com era. The rewards, however, appear concentrated in the infrastructure and energy layer rather than the AI application layer, where monetisation remains contested.
Morgan Stanley positioned the AI buildout as analogous to railroad and electrification eras: infrastructure booms that ultimately lifted GDP by approximately 25%, even through periods of near-term overcapacity.
Goldman Sachs’s view that ROI from AI enterprise deployments will begin emerging meaningfully by 2027-2028 sets the timeline for when the monetisation question gets answered. The Nasdaq 100 forward P/E of approximately 23.18 suggests the market is pricing growth, but not yet pricing certainty.
Three watch points for the months ahead:
This article is for informational purposes only and should not be considered financial advice. Investors should conduct their own research and consult with financial professionals before making investment decisions. Past performance does not guarantee future results. Financial projections referenced are subject to market conditions and various risk factors.
The AI investment boom refers to the surge in capital spending on GPU clusters, AI data centres, and supporting infrastructure driven by hyperscalers like Microsoft, Amazon, Alphabet, and Meta. The 4.9% of GDP figure recorded in Q1 2026 surpasses every prior technology investment peak, including the dot-com era's approximate 4.2% and the cloud buildout's 3.8%, placing the current cycle in historically unprecedented territory.
Unlike the dot-com era, where capital flowed to companies with minimal revenue, the companies driving the current AI buildout are profitable: the Magnificent Seven reported approximately 19% earnings growth in Q1 2026. However, the open question remains whether end-user monetisation of AI products will ultimately justify the infrastructure already committed.
Three tiers capture the bulk of AI capital flow: semiconductors (Nvidia, Broadcom, AMD, TSMC), data centre REITs (Equinix, Digital Realty), and energy and power infrastructure companies (NextEra Energy, Constellation Energy, Eaton). Liquid cooling specialists such as Vertiv and nVent represent an underappreciated sub-theme with liquid cooling CapEx reportedly growing 100% year-over-year.
Key risks include concentration risk from the Magnificent Seven representing roughly 33.7% of S&P 500 market capitalisation, a potential 10-15% drawdown if AI monetisation disappoints, energy cost pressure from oil above $110 per barrel compressing data centre margins, and regulatory or antitrust actions targeting hyperscaler concentration.
Retail investors can access AI infrastructure broadly through vehicles like Invesco QQQ, which covers Nasdaq 100 large-cap tech and semiconductor names, or through targeted AI and semiconductor sector ETFs. Data centre REITs offering estimated yields of 4-6% plus growth potential represent an income-oriented route, while individual names across semiconductors, cooling, and power infrastructure offer more concentrated positioning.