Goldman Sees Contrarian Buy Signal in KOSPI Foreign Selloff
9 hrs ago

High-dividend stocks were supposed to be the shelter. During the February to March 2026 period, the MSCI World High-Dividend Yield Index and the broader MSCI World Index both saw limited movement, with MSCI World roughly flat to slightly negative (approximately -1.46% YTD through early 2026). That context arrived at a moment when bearish sentiment among retail investors had reached a one-year high. The AAII Investor Sentiment Survey registered 52% bearish for the week ending 18 March 2026, and the marketing of yield-heavy strategies as defensive positioning had intensified accordingly. What follows is an examination of what the performance data actually showed, why dividend mechanics undermine the safety narrative at a structural level, and what investors pursuing a yield-first approach should reconsider now.
Three data points frame the problem. Taken individually, each is unremarkable. Taken together, they describe a strategy that failed its primary selling point.
“MSCI World High-Dividend Yield Index and the broader MSCI World both saw muted performance through early 2026, with no significant correction separating the two.”
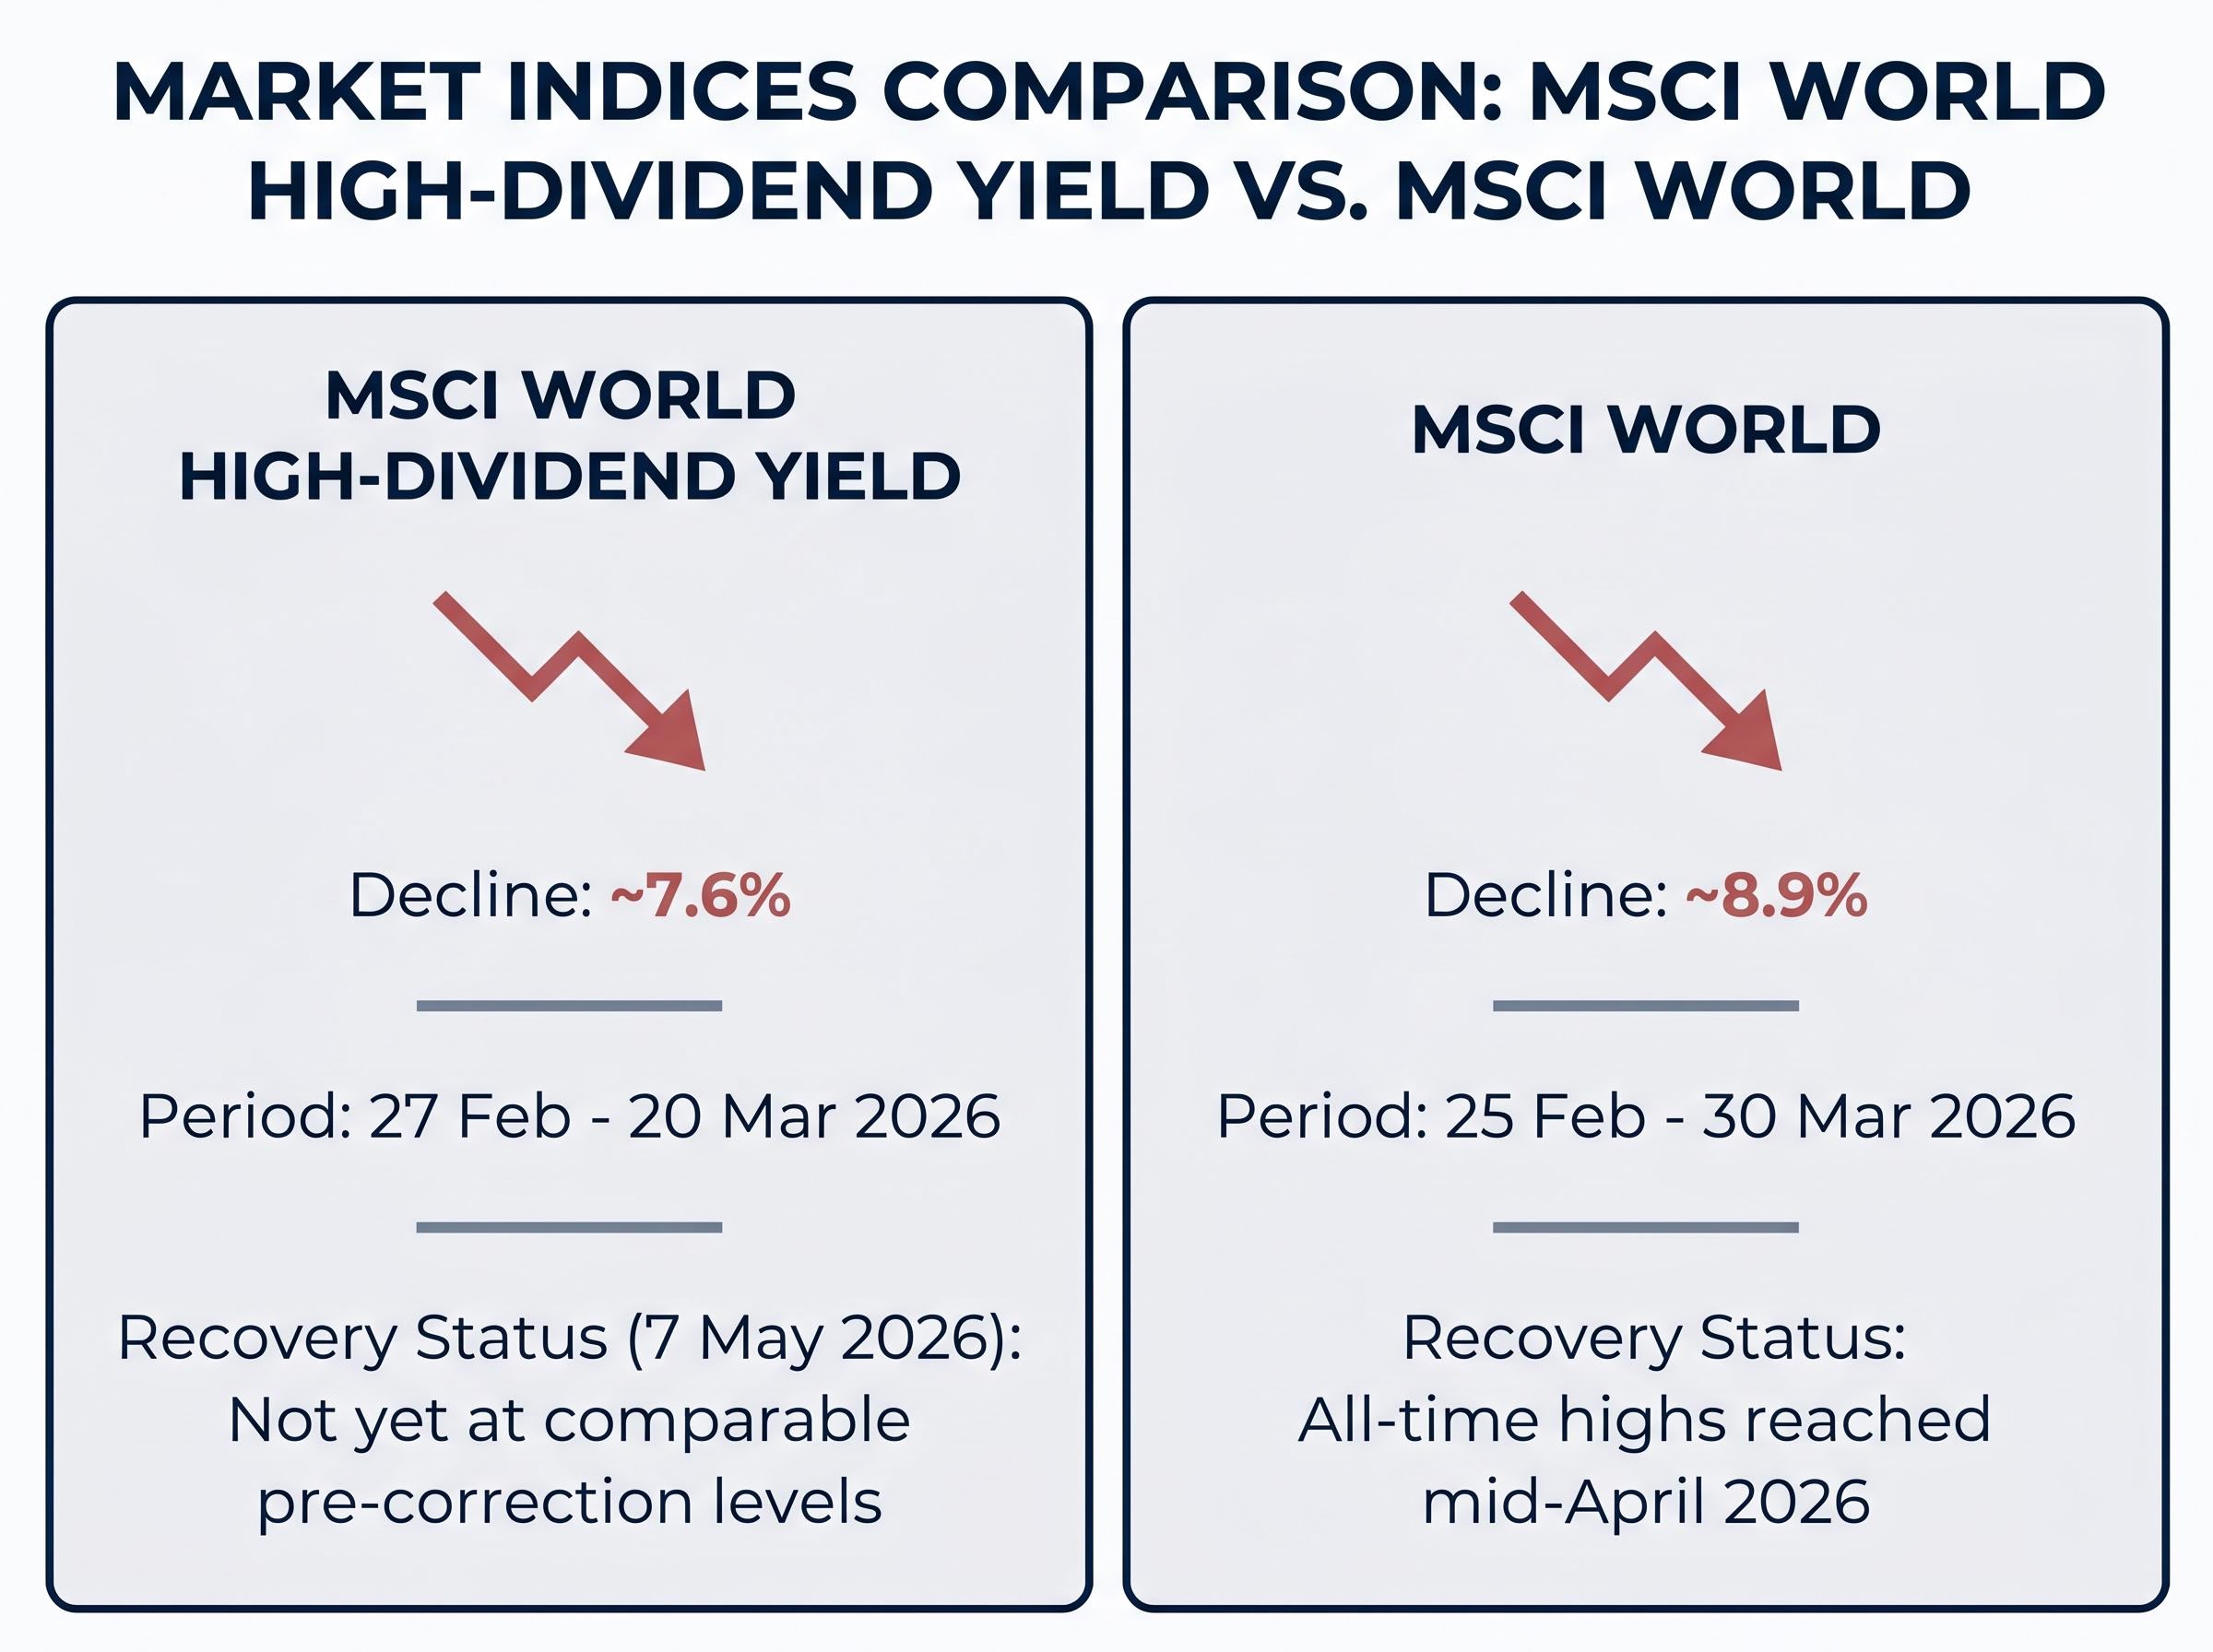
| Index | Peak-to-Trough Decline | Correction Period | Recovery Status (7 May 2026) |
|---|---|---|---|
| MSCI World High-Dividend Yield | ~7.6% | 27 Feb – 20 Mar 2026 | Not yet at comparable pre-correction levels |
| MSCI World | ~8.9% | 25 Feb – 30 Mar 2026 | All-time highs reached mid-April 2026 |
The drawdown comparison alone is damaging. The recovery divergence is worse. Investors who rotated into high-yield names absorbed more of any drawdown and then missed part of any rebound. The Schwab US Dividend Equity ETF (SCHD) underwent a March 2026 reconstitution that added 25 new stocks and reduced energy exposure by approximately 8%, according to Seeking Alpha (21 March 2026). Even rules-based dividend vehicles were recalibrating their positioning in real time, a signal that the composition underpinning these strategies was shifting under pressure.
The safety argument for high-dividend stocks rests on a premise that sounds intuitive: consistent income provides a cushion when share prices fall. The problem is mechanical, not philosophical. Understanding what happens when a dividend is paid changes the calculation entirely.
Two steps determine the net effect of a dividend on an investor’s position:
As Spencer Jakab noted in the Wall Street Journal (7 May 2026), dividends paid out immediately reduce company value. This is not a theoretical abstraction. When Microsoft issued its special dividend in 2004, FactSet data from 31 December 2003 through 31 December 2004 showed a clear divergence between price return and total return, illustrating exactly how the cash distribution reduced the equity’s price component while leaving total return intact.
Bond interest does not reduce the bond’s face value. A bondholder receives coupon payments while the principal remains intact until maturity. A dividend, by contrast, distributes part of the company’s equity value back to shareholders. The company is smaller after the payment.
Portfolio statements classify both as “investment income,” and that labelling obscures a structural difference. Bond interest is earned on an unchanged principal. Dividend income comes at the cost of a proportional reduction in equity value. Treating both as equivalent income sources encourages a misplaced sense of protection that the early-2026 data tested directly.
Investors who want to see the performance gap quantified across a full decade will find our comprehensive walkthrough of dividend investing versus total return, which shows a total market portfolio returning 10.49% annualised from 2016-2025 against 9.43% for a dividend-focused portfolio, a gap that compounds to roughly $116,000 in additional wealth on a $100,000 starting position over 20 years.
The problem extends beyond how dividends work mechanically. It sits in which sectors dominate when investors filter purely by yield.
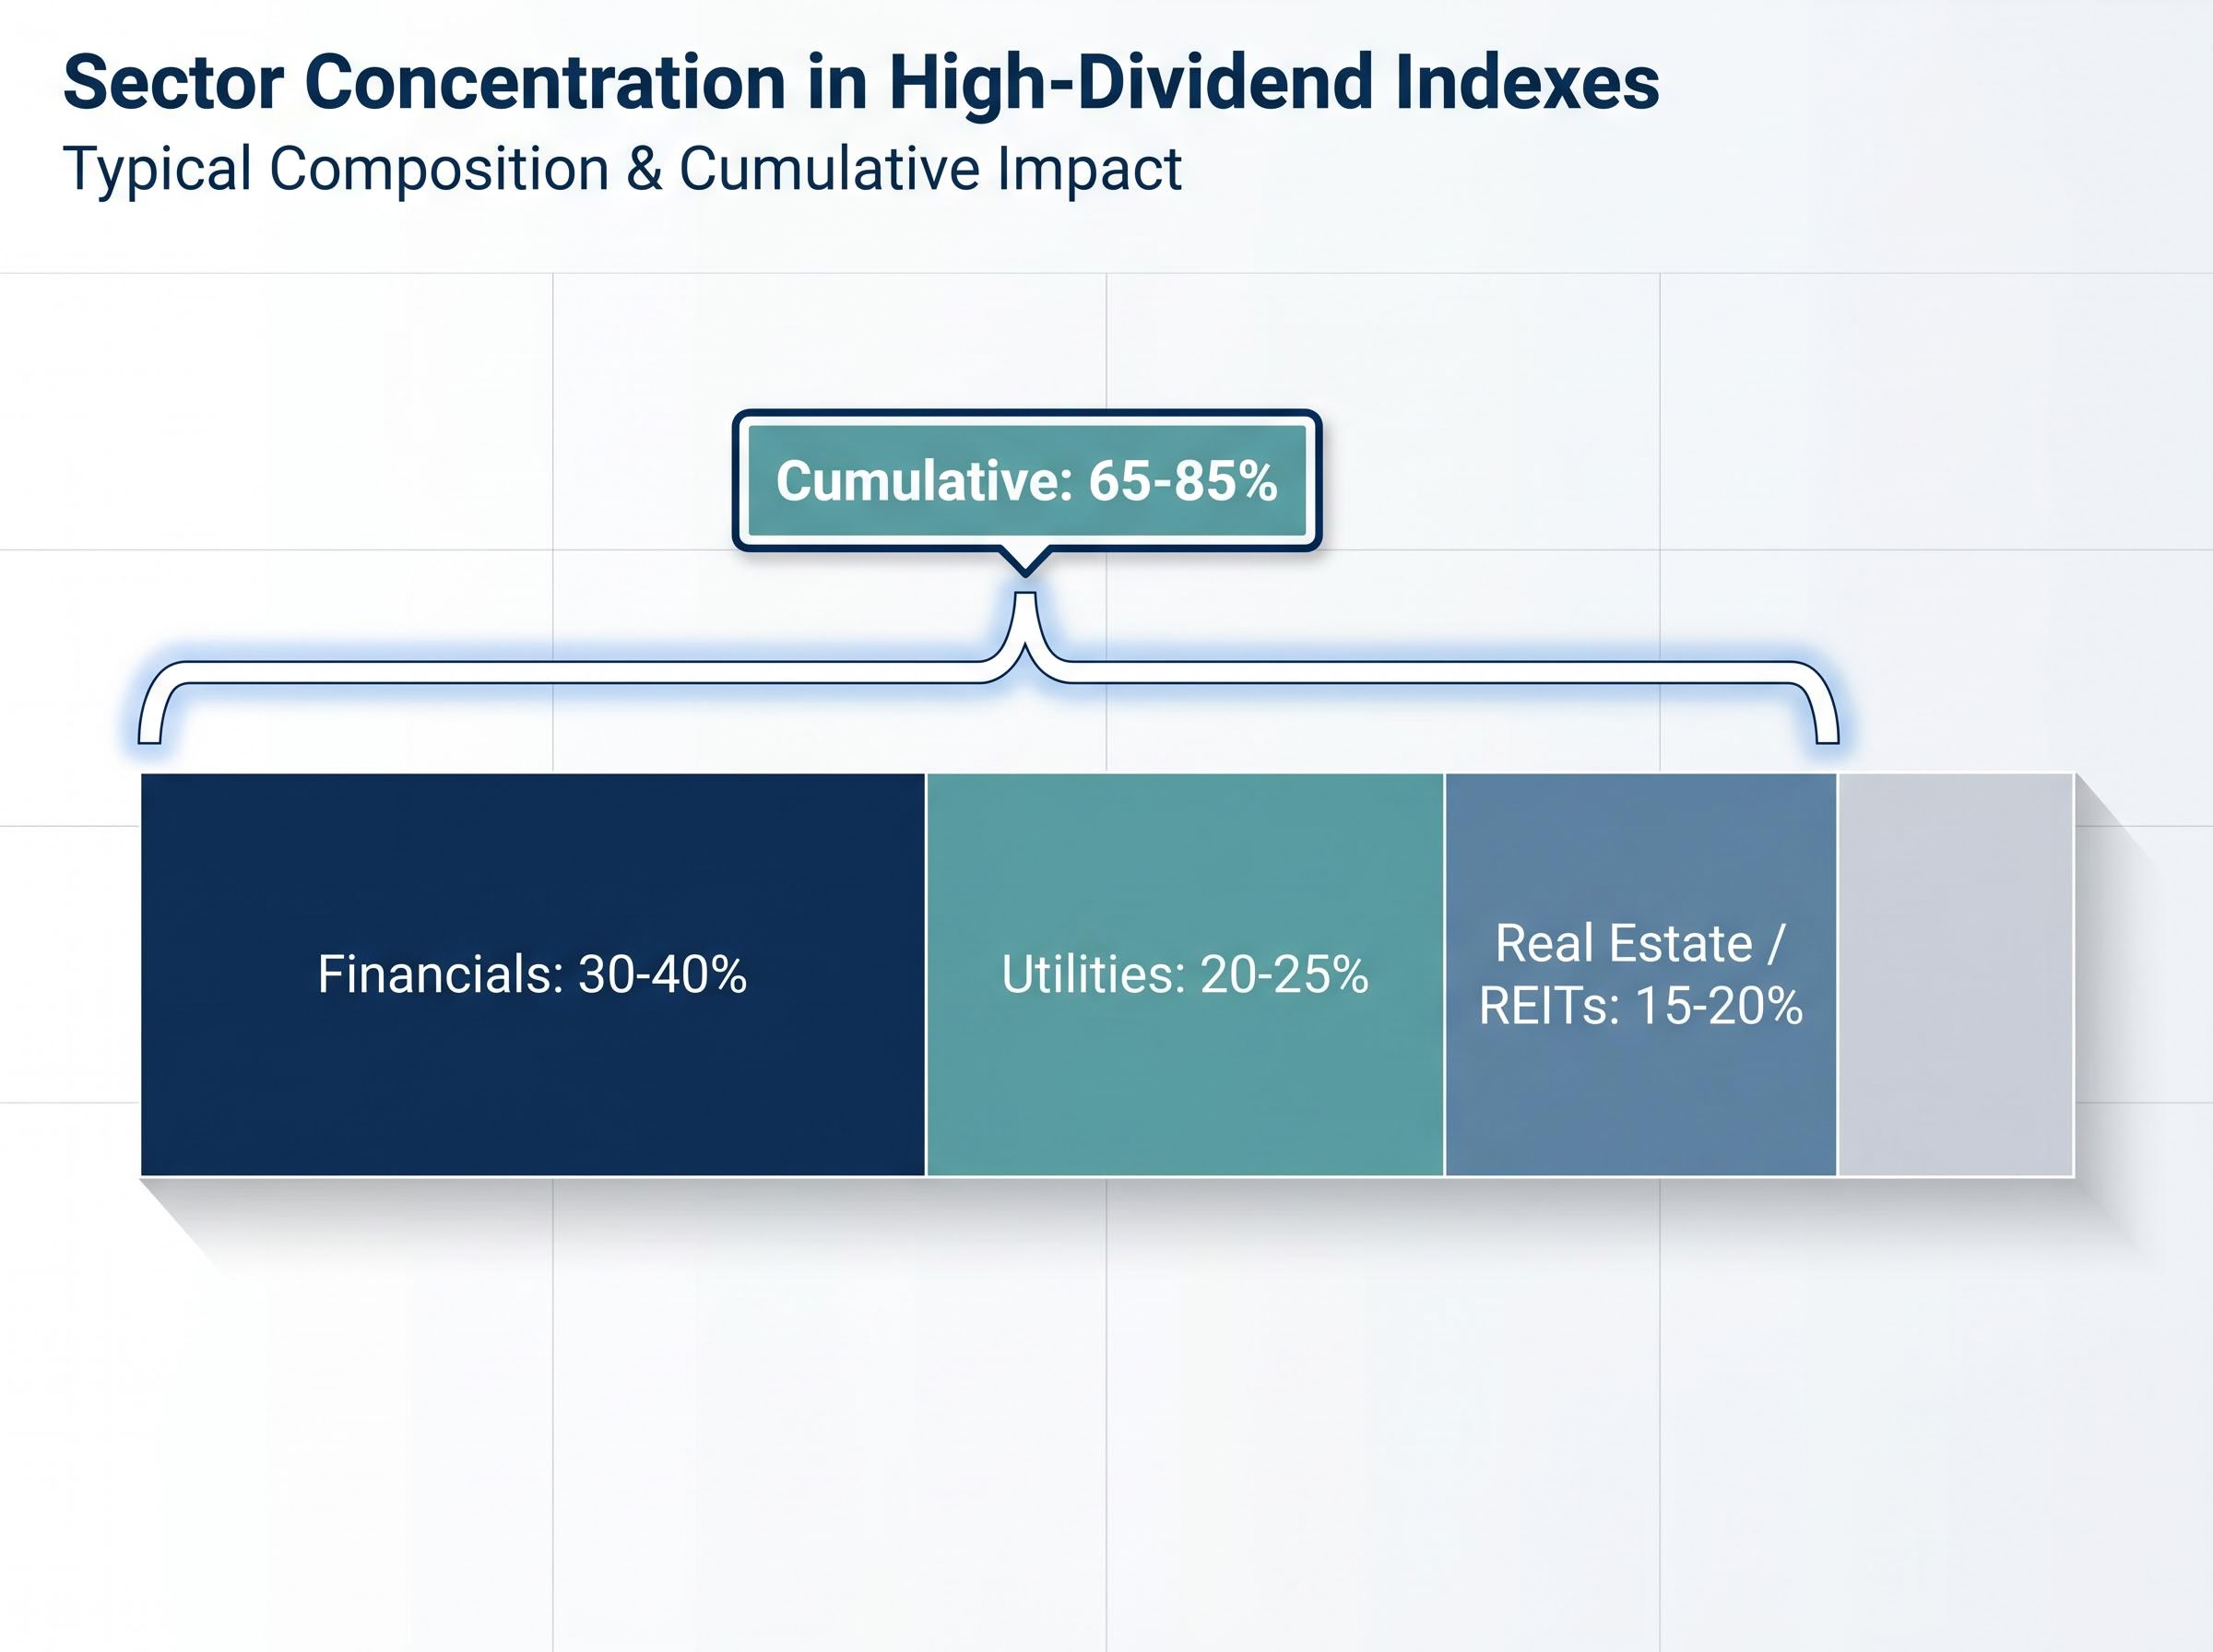
| Sector | Typical Index Weight | Key Risk Driver |
|---|---|---|
| Financials | 30-40% | Interest rate sensitivity, credit cycle exposure |
| Utilities | 20-25% | Rate-driven valuations, regulatory risk |
| Real Estate / REITs | 15-20% | Rate sensitivity, capital access, occupancy cycles |
These three sectors routinely comprise 65-85% of a high-dividend index. That is not diversification; it is a concentrated sector bet on rate-sensitive industries.
Sector concentration risk operates differently in high-dividend portfolios than in cap-weighted indexes, but the structural outcome is similar: returns become dependent on a narrow subset of industries rather than broad market participation, and the sectors providing that narrow exposure, rate-sensitive Financials, Utilities, and REITs, have historically underperformed the Technology and Communication Services names that dominate broad index returns.
The sectors that cumulatively led market performance over the decade preceding publication, approximately 2016-2026, tell the other half of the story:
A yield screen does not just overweight certain sectors. It systematically excludes the sectors that drove long-run equity performance. SCHD’s March 2026 reconstitution, which added 25 stocks and cut energy exposure by roughly 8%, illustrates that even passive, rules-based high-dividend vehicles require active intervention to manage sector drift. Susan Dziubinski of Morningstar (3 March 2026) emphasised dividend-growth quality screens prioritising stable cash flows over raw yield, featuring names such as Medtronic, Mondelez, and EOG Resources, precisely the type of business-quality filter that a pure yield screen omits.
Total return, combining price movement with dividend income, is the appropriate measure of investment success. Fisher Investments Editorial Staff framed this directly in May 2026: yield isolated from price performance is not income in any meaningful sense. It is a partial return of capital while the remaining position erodes.
Yield without price performance is not income. It is a partial return of capital while the remainder erodes. Total return is the only honest measure of what a portfolio delivered.
Consider Prudential Financial (PRU), which announced a 3.7% dividend increase to $1.40 per share on 3 February 2026, payable 12 March 2026. A real dividend increase from a large financial institution. The quarterly dividend represents a fraction of the percentage that can be lost in any meaningful price drawdown, meaning income received can be consumed several times over by a decline in equity value.
The sectors that dominate high-dividend portfolios, Financials, Utilities, and REITs, are not historically the strongest long-run total return generators. Investors accept concentrated sector risk without a commensurate total return premium. The early-2026 data made this cost visible in a compressed timeframe.
Dividend payments are not contractually guaranteed. Companies may reduce or eliminate them during periods of financial stress, which is precisely when yield-dependent investors most need the income. Dividend cuts tend to cluster during downturns, and the sectors most represented in high-yield portfolios, Financials and Real Estate, are historically among the first to reduce payouts when credit conditions tighten. The income loss and the price loss arrive simultaneously, compounding the damage for investors who built their positioning around the yield.
Yield trap mechanics play out in real time when a company’s falling share price pushes the headline yield to levels that appear attractive precisely because the market has already priced in deteriorating fundamentals; Oxford Square Capital’s Q1 2026 results, which combined a 23% annualised yield with a net investment income miss and a 62% expansion in realised and unrealised portfolio deficits, illustrate exactly how income and capital loss arrive together.
The data does not argue against owning dividend-paying equities. It argues against treating yield as the primary selection criterion.
The distinction is between two approaches:
Verified Morningstar analyst commentary in 2026 consistently favoured the former. Susan Dziubinski (3 March 2026) focused on stable cash flows and dividend-growth quality. Brian Colello (2 April 2026) highlighted PepsiCo and Blackstone, names consistent with a quality screen rather than a pure-yield approach.
SCHD’s March reconstitution reinforced this shift at the product level. Reducing energy exposure and adding 25 new holdings represented a rules-based acknowledgment that yield alone is insufficient as a selection criterion. Dividend-growth strategies have historically shown more consistent total return characteristics than pure high-yield approaches, a general finding in investment literature that the early-2026 data supported once more.
Dividend-growth and index strategies both sit within a broader long-term investing framework that includes bonds and international diversification; international developed markets traded at approximately 15x price-to-earnings in 2026 versus 20x and above for US equities, offering valuation advantages and higher dividend yields that a purely domestic yield screen would miss.
OSAM Research on dividend yield vs dividend growth drew on CRSP data to show that dividend-growth strategies produced stronger long-run total returns than high-yield strategies against the broad U.S. equity universe, providing empirical grounding for the quality-over-yield argument that the early-2026 period illustrated in a compressed timeframe.
Investors do not need to abandon income-generating equities. The question is whether current positioning reflects a total return strategy with dividends as one component, or a yield-chasing strategy that the early-2026 period tested to failure.
The numbers do not require interpretation. High-dividend stocks and the broader market both saw limited movement through early 2026, with MSCI World roughly flat to slightly negative (approximately -1.46% YTD), and the margin of differentiation between high-dividend and broad indices remained narrow. This is not an anomaly to explain away. It is a structural limitation, visible in the sector concentration, the mechanics of how dividends reduce equity value, and the total return data that consistently favours business quality over raw yield.
The timing matters. With AAII bearish sentiment at 52% in the week of 18 March 2026, the marketing of high-dividend products as safe havens is intensifying precisely when investors are most receptive to the pitch. The data contradicting that pitch is as fresh as it will ever be. Investors who adjust their framework now, treating yield as one metric within a total return evaluation rather than a proxy for safety, are better positioned than those who wait for the next correction to confirm what this one already showed.
The AAII Investor Sentiment Survey tracks weekly retail investor positioning and publishes historical data showing that the 52% bearish reading for the week ending 18 March 2026 represented a one-year high, a level of pessimism that has historically coincided with peak receptivity to defensive-income marketing pitches.
This article is for informational purposes only and should not be considered financial advice. Investors should conduct their own research and consult with financial professionals before making investment decisions. Past performance does not guarantee future results. Financial projections are subject to market conditions and various risk factors.
High dividend stocks are shares in companies that pay above-average dividend yields, and investors often treat them as defensive holdings because the income stream is perceived as a cushion during market downturns. However, this safety narrative is structurally flawed because dividend payments reduce the company's equity value by an equivalent amount on the ex-dividend date.
The early 2026 data suggests they do not provide meaningful protection. The MSCI World High-Dividend Yield Index fell approximately 7.6% peak to trough between 27 February and 20 March 2026, compared to an 8.9% decline for the broader MSCI World Index, and high-dividend investors also missed part of the subsequent recovery that brought the broad index to all-time highs by mid-April 2026.
On the ex-dividend date, a stock's share price adjusts downward by the per-share dividend amount, so a stock trading at $100 that pays a $2 dividend opens at approximately $98. The investor's total position value is unchanged because the cash received offsets the price reduction, meaning the dividend transfers value rather than creating it.
Financials, Utilities, and Real Estate or REITs typically comprise 65-85% of a high-dividend index, creating a concentrated bet on rate-sensitive industries. These sectors have historically underperformed Technology and Communication Services over the long run, meaning a yield screen systematically excludes the sectors that drove the strongest cumulative equity returns over the decade preceding 2026.
A dividend-growth strategy prioritises payout sustainability, earnings quality, and competitive moats, selecting businesses whose cash flows can support growing dividends over time. A pure high-yield strategy maximises current yield regardless of business quality, which tends to select companies whose share prices have already fallen, pushing the yield higher while signalling deteriorating fundamentals.