Iran Walks Out of Swiss Talks, Sending US Stock Futures Lower
3 hrs ago

Investors face a stark mathematical contradiction when a corporate entity maintains a massive ~22% yield while simultaneously suffering a sequential drop in intrinsic asset valuation. The latest Oxford Square Capital earnings disclosures on 29 April 2026 exposed significant profitability misses against Wall Street expectations. These financial results bring long-standing questions about payout sustainability into sharp focus.
This analysis provides a comprehensive breakdown of how these specific shortfalls interact with broader United States credit market deterioration. By examining the structural mechanics of high-yield corporate vehicles, market participants can establish a clearer framework for evaluating the underlying risks of asset contraction.
The widening gap between dividend distributions and net investment income reveals how investors must now price high-yield debt portfolios. Understanding this dynamic offers a practical method for diagnosing the true total return trajectory behind double-digit distributions.
The first-quarter financial shortfall represents a significant departure from the organisation’s historical track record of meeting market projections. Core metrics deteriorated sharply across both top-line revenue and bottom-line income, establishing a challenging baseline for the fiscal year.
The company reported Net Investment Income (NII) of $0.05 per share. The breakdown in performance extends beyond missed analyst targets to direct operational revenue generation. Total Investment Income fell to $8.9 million.
Core investment revenue saw a concurrent reduction, representing a sequential decline from the previous quarter. The primary driver of this balance sheet weakness is a severe expansion in portfolio deficits.
Aggregate realised and unrealised portfolio deficits expanded by 62.3% to reach $29.7 million. This internal deterioration crystallised into net realised losses totalling $30.7 million, setting a harsh reality for immediate capital recovery prospects.
The official SEC Form 8-K filings detailing these first-quarter shortfalls reveal the precise mathematical breakdown between operating income misses and expanding balance sheet liabilities.
| Metric | Q1 2026 Actuals | Analyst Consensus | Q4 2025 Base | Sequential Change |
|---|---|---|---|---|
| Net Investment Income (EPS) | $0.05 | $0.07 | Data Unavailable | -28.5% (Variance) |
| Total Investment Income | $8.9M | $9.99M | Data Unavailable | -10.9% (Variance) |
| Core Investment Revenue | $4.1M | Data Unavailable | Data Unavailable | -24.1% (QoQ) |
A double-digit dividend yield often appears highly attractive to income-focused investors until the underlying capital base begins to erode. The relationship between Net Asset Value (NAV) and dividend sustainability forms the core mechanism of high-yield corporate structures. When a fund pays out more capital than its investments generate, the distribution must be funded by liquidating assets or returning the investor’s own principal.
This dynamic became visible as the company’s NAV dropped to $1.32 per share. Despite this contraction, the company declared monthly dividends of $0.035 per share for July through September 2026, creating an annualised yield of approximately 23.2%. Historical data highlights this growing pressure, showing past quarters where distributions exceeded actual earnings by 40%.
“The structural tension between a contracting capital base and a double-digit yield presents a dangerous math problem for income-focused portfolios, especially when distributions consistently outpace actual net investment income.”
Leadership maintained a firm defense of the current payout structure during the first-quarter earnings call. Management cited a 23-year history of consistent payments as the primary justification for maintaining the distribution rate despite the recent $29.7 million portfolio deficit.
This confidence relies on a long-term holding strategy designed to ride out immediate asset pricing volatility. The executive team argues that short-term NAV fluctuations do not impair their ability to generate cash over extended timeframes. However, the mathematical reality of a shrinking capital base complicates this historical optimism.
These specific portfolio struggles function as symptoms of a wider systemic deterioration in domestic commercial credit. The company’s realised losses directly mirror the deteriorating macroeconomic environment for United States leveraged loans. Elevated distress ratios and steady capital withdrawals have made refinancing significantly harder for underlying corporate borrowers.
This strain on corporate borrowers is fundamentally linked to increasing US recession risk, as underlying consumer demand weakens and reduces the cash flow necessary to service high-yield debt.
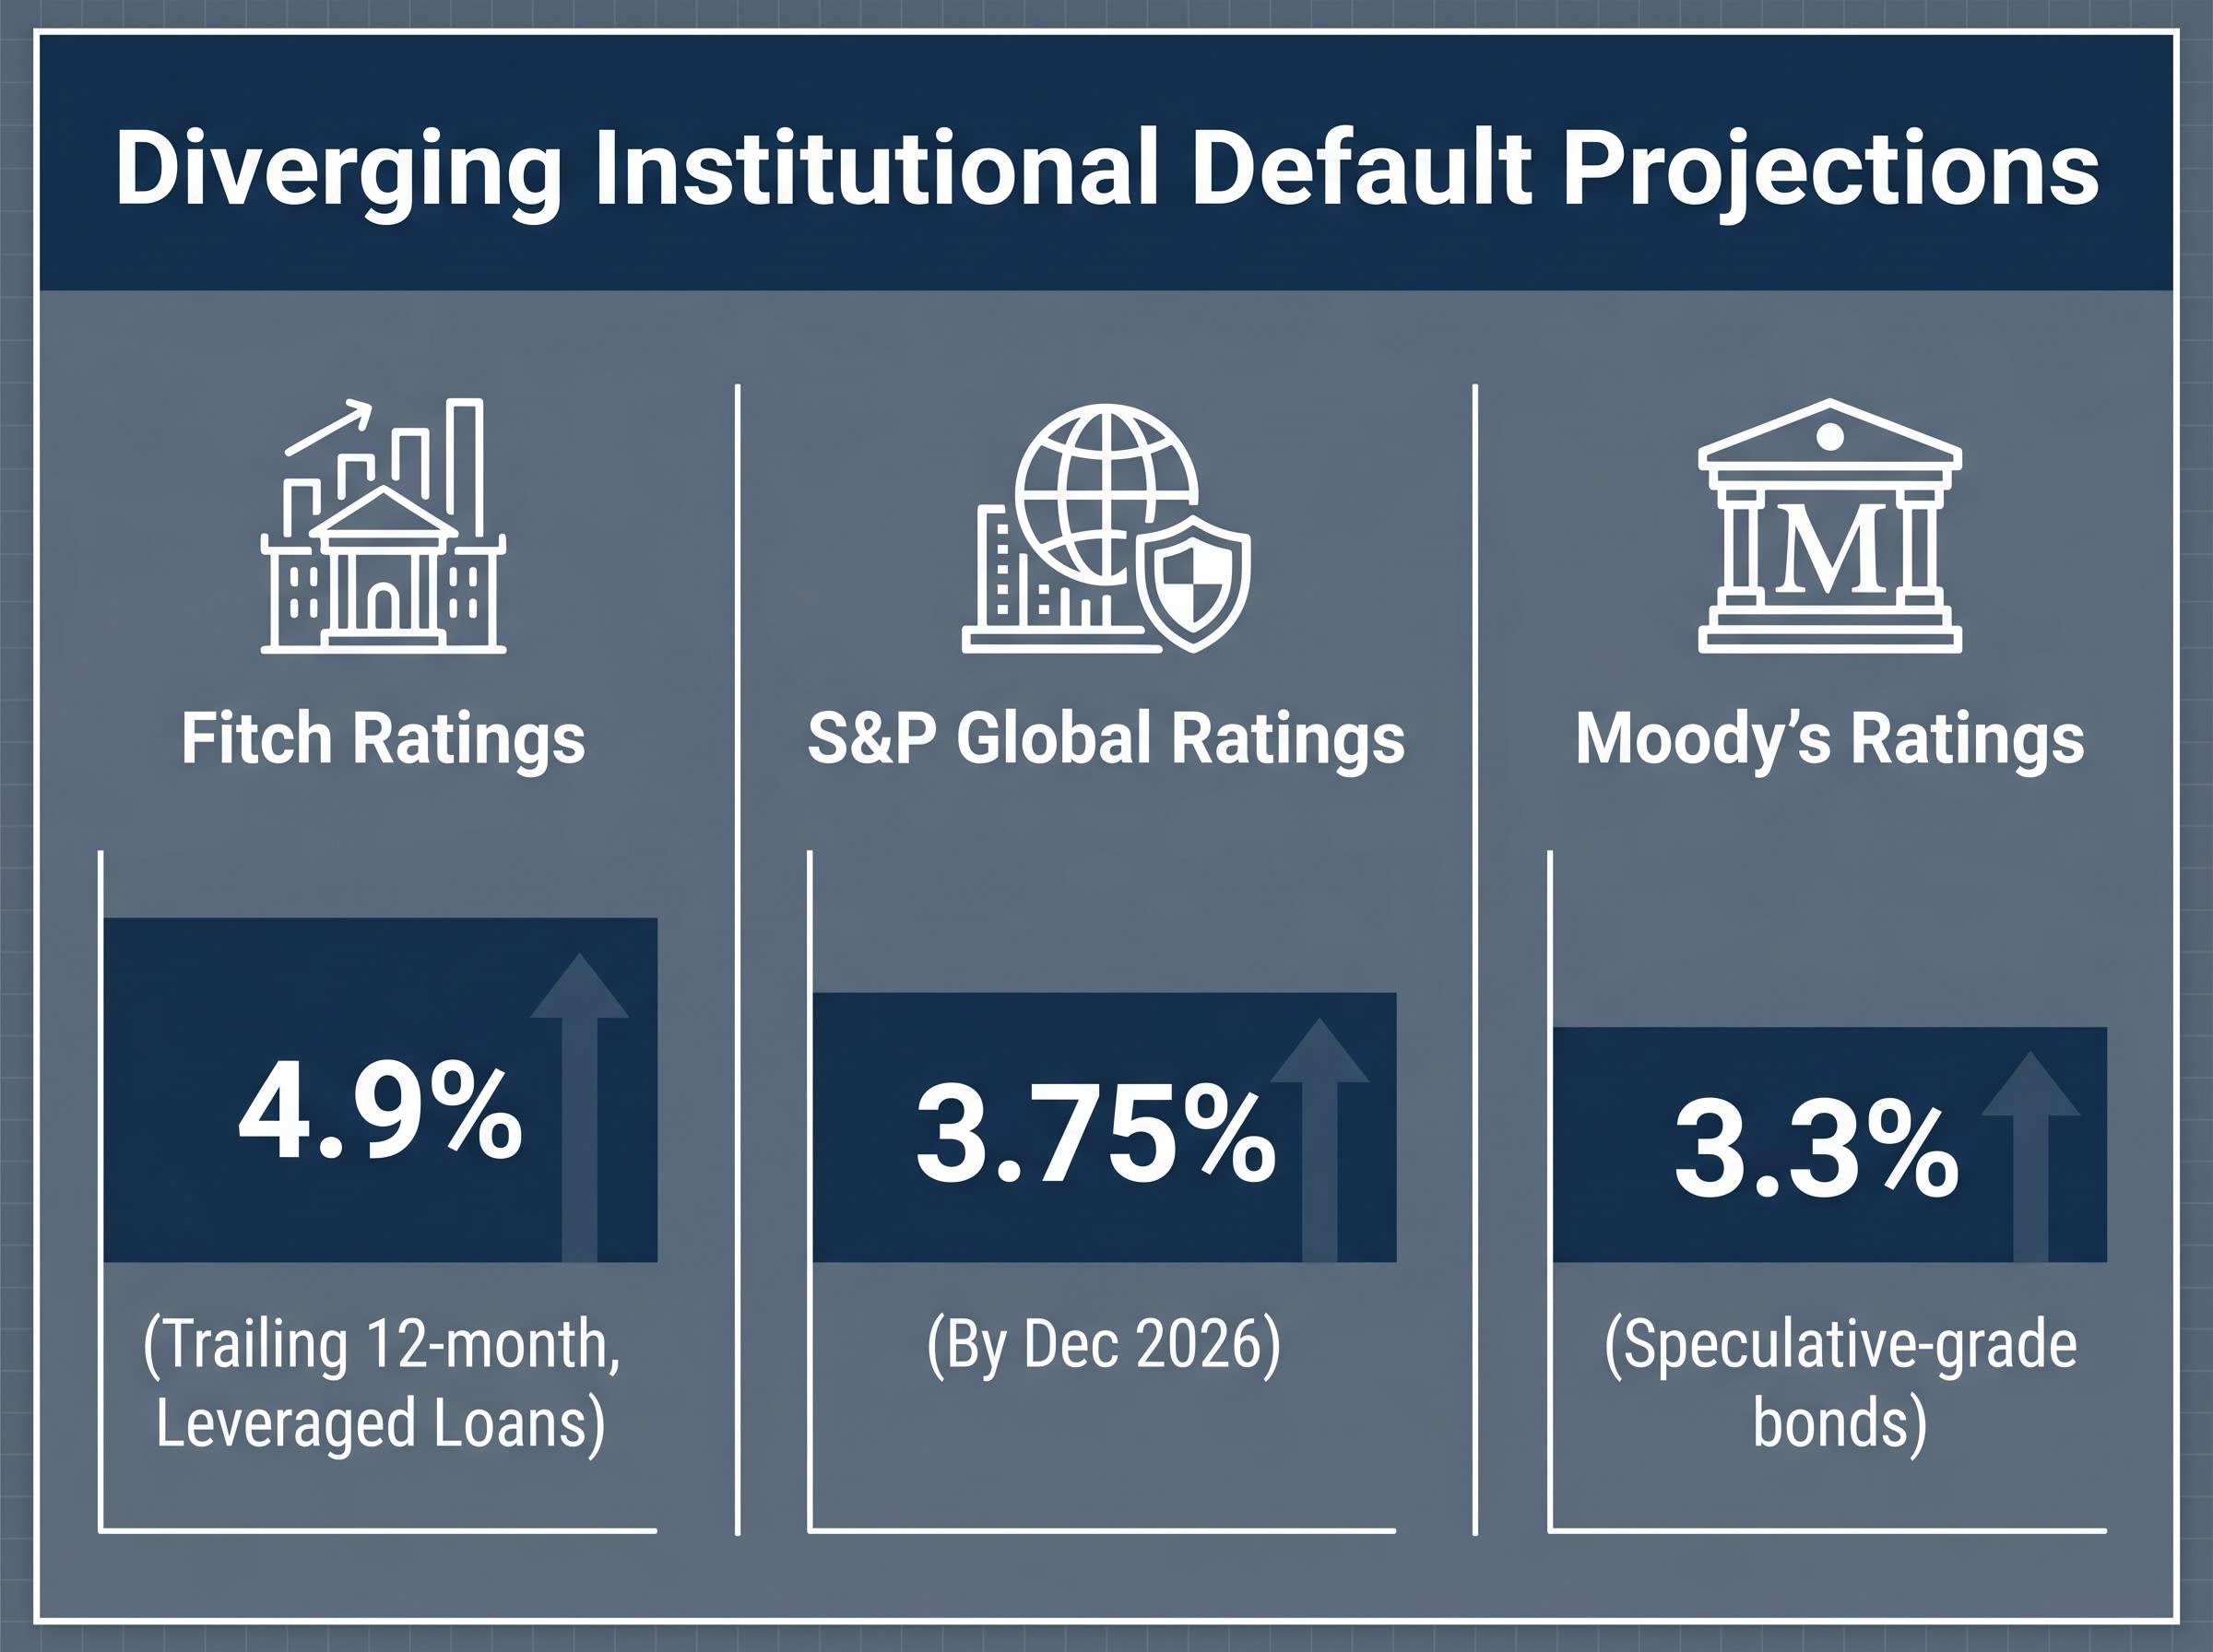
The Morningstar LSTA US Leveraged Loan Index level was 4,323.33 by mid-April. Concurrently, the broader distress ratio swelled from 4.34% to 7.23%. Domestic credit funds experienced massive capital flight, with withdrawals totalling $5.1 billion in the first quarter alone.
Riskier debt tranches are suffering the most severe revaluations under this macroeconomic pressure. Pricing for CCC-rated obligations plunged by 537 basis points, reflecting a sharp contraction in market liquidity. The divergence in institutional projections highlights the uncertainty facing credit managers.
Evaluating an individual company’s earnings miss requires factoring in these external economic forces shaping the entire commercial debt sector.
In response to commercial credit stagnation, the company executed an unexpected shift toward emerging technology and machine learning enterprises. This allocation represents a strategic manoeuvre intended to capture high-growth upside rather than standard portfolio diversification. The recent technology investments target sectors completely distinct from traditional leveraged debt.
The firm deployed capital toward new asset acquisitions in the first quarter. Specific investments included positions in Invisible Technologies Inc. and Constellation Inc. To fund these new acquisitions amidst overall portfolio contraction, the company utilised fresh equity issuance.
This structural pivot mirrors the broader market race for massive AI infrastructure investment, as capital continues to rotate out of vulnerable credit vehicles and into high-growth technology assets.
The firm raised capital through the placement of new equity shares via an at-the-market mechanism. These allocations force investors to assess whether acquiring artificial intelligence assets represents a necessary evolution or a risky departure from the organisation’s core competencies. The strategy attempts to build new growth engines while traditional credit instruments face sustained macroeconomic pressure.
Wall Street is actively pricing the tension between the massive income yield and the accelerating capital loss. The immediate market reaction to the 29 April 2026 disclosures was decisively negative.
Pre-market trading saw a decline of 3.87%, pushing the share price down to $1.81. The company’s current market capitalisation sits at $158.39 million. The absence of updated institutional rating changes highlights a significant gap between outdated analyst optimism and current market realities.
According to market records, the most recent formal rating remains a “Buy” from Ladenburg Thalmann, a designation dating back to March 2021.
Current trading price of $1.81, sitting well below the 52-week high of $2.56. Trading momentum constrained below the 200-day simple moving average of $1.93. Trailing twelve-month total return showing a 12.7% deficit. Price volatility indicated by a beta metric of 0.47.
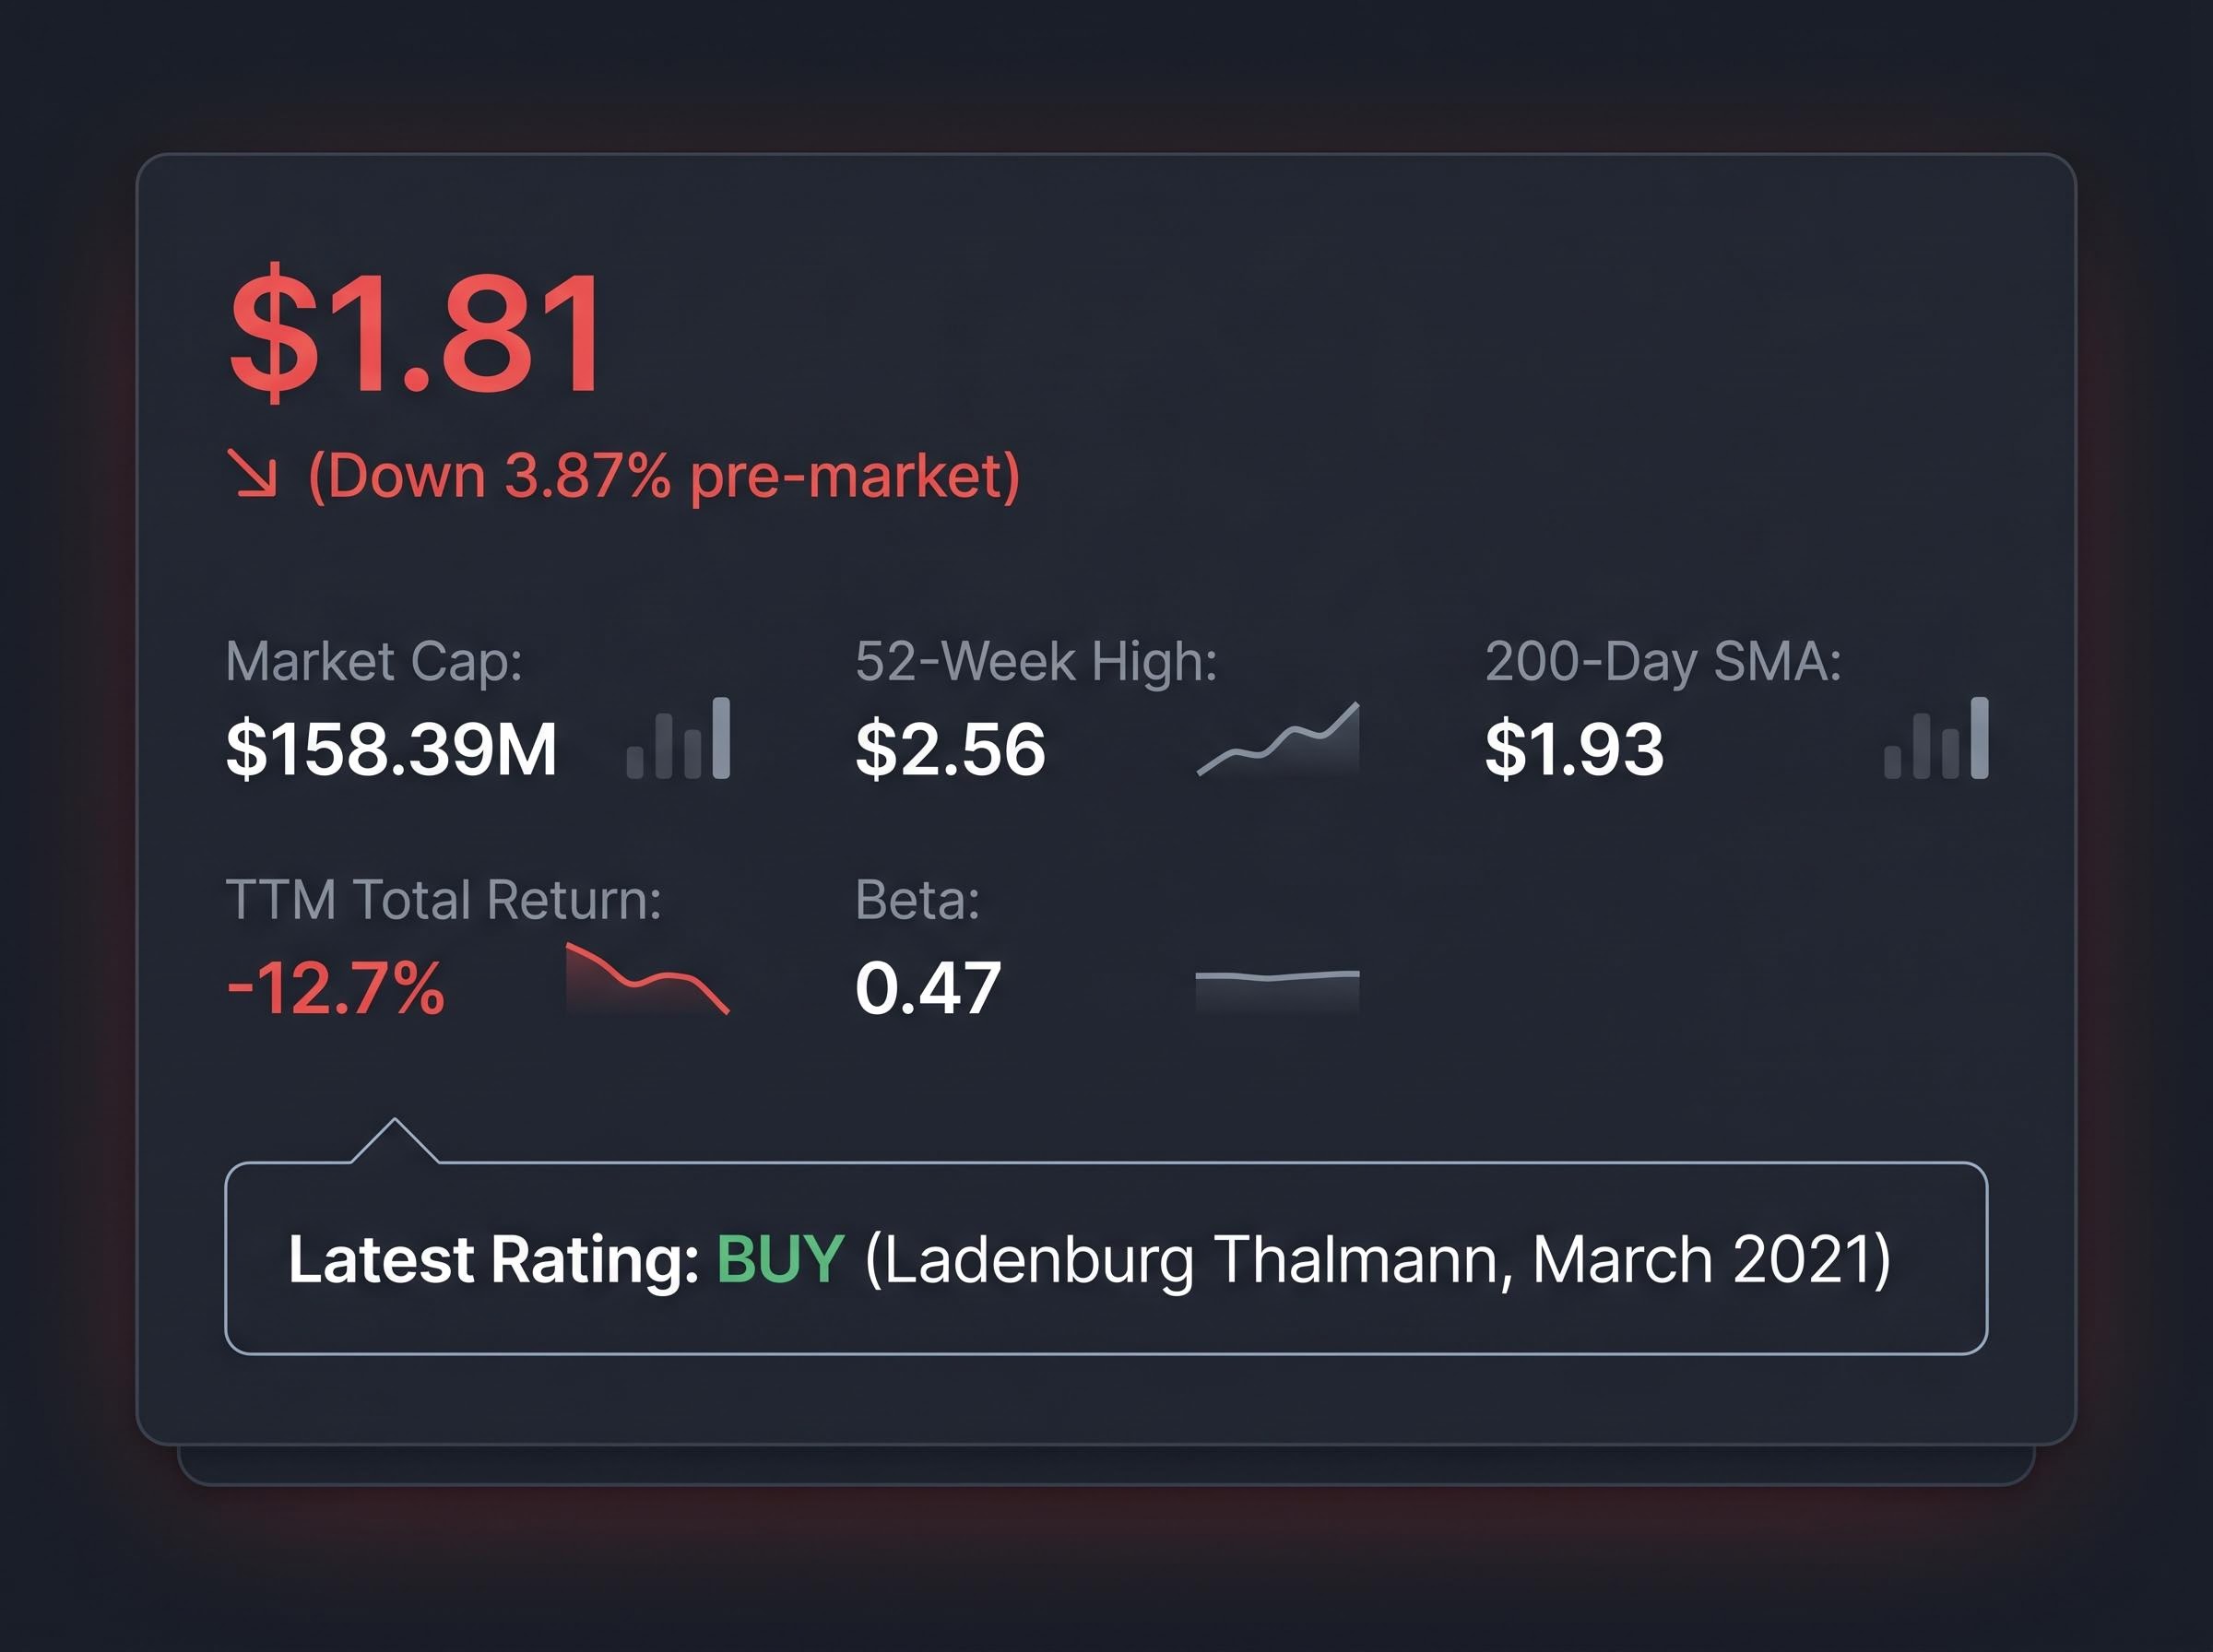
These technical indicators provide the necessary context for assessing current entry or exit points. The market is clearly discounting the historical reliability of the dividend against the present reality of net asset decay.
Evaluating high-yield opportunities in the current United States credit environment requires looking past the surface dividend yield to analyse the underlying asset health. The structural tension between a double-digit distribution rate and a contracting capital base creates a complex risk profile for income-focused portfolios.
Market participants must monitor upcoming earnings stability and track whether macroeconomic default indicators begin to plateau. The success of the firm’s strategic pivot into technology assets will ultimately determine if the current yield can be maintained without further eroding shareholder principal.
Investors exploring the broader systemic threats facing dividend portfolios will find value in our detailed coverage of stock market warning signals, which examines how external energy shocks and macroeconomic vulnerabilities are actively threatening equity valuations across the index.
This article is for informational purposes only and should not be considered financial advice. Investors should conduct their own research and consult with financial professionals before making investment decisions. Past performance does not guarantee future results, and financial projections are subject to market conditions and various risk factors.
In Q1 2026, Oxford Square Capital reported Net Investment Income of $0.05 per share, below the $0.07 analyst consensus, and total investment income fell to $8.9 million. Aggregate portfolio deficits expanded by 62.3% to $29.7 million, resulting in net realised losses of $30.7 million.
Oxford Square Capital maintains an annualised dividend yield of approximately 23.2% despite its Net Asset Value dropping to $1.32 per share. This creates a structural tension where payouts exceeding Net Investment Income may necessitate funding through asset liquidation or returning investor principal.
The company is executing a strategic pivot towards emerging technology and machine learning enterprises, including investments in Invisible Technologies Inc. and Constellation Inc. These new asset acquisitions are being funded through fresh equity issuance via an at-the-market mechanism.
Oxford Square Capital's portfolio struggles mirror wider systemic deterioration in domestic commercial credit, evidenced by elevated distress ratios, $5.1 billion in capital withdrawals from credit funds, and significant revaluations in riskier debt tranches.