The S&P 500 has returned approximately 9.43% annually over the past 150 years with dividends reinvested. Yet most individuals who attempt to beat the market through active trading underperform a simple index fund. The gap between what long-term investing delivers and what short-term trading promises raises a straightforward question: what does patient, structured wealth-building actually look like in practice?
The year 2026 presents a distinctive moment for long-term investors. Falling US interest rates, with the Federal Reserve funds rate at 3.50-3.75% after three cuts in 2025, have shifted the relative appeal of dividend equities and international index funds compared to bonds and domestic growth stocks. Stretched US technology valuations and a weakening US dollar have added further complexity to the allocation decision. The strategies covered in this guide are not new, but their relative payoffs are shifting in ways worth understanding.
What follows is a practical walkthrough of four proven approaches to building wealth and passive income over time: dividend investing, index fund and ETF strategies, bonds and fixed income, and the buy-and-hold method. By the end, readers will understand how each works, how they complement each other inside a diversified portfolio, and how to think about combining them based on individual goals and time horizons.
Why long-term thinking changes everything about investing
Short-term trading is seductive. The idea of catching a dip, riding momentum, and exiting before the reversal appeals to every instinct a market participant has. The problem is arithmetic.
The S&P 500 has delivered an average annual return of approximately 9.43% over the past 150 years with dividends reinvested.
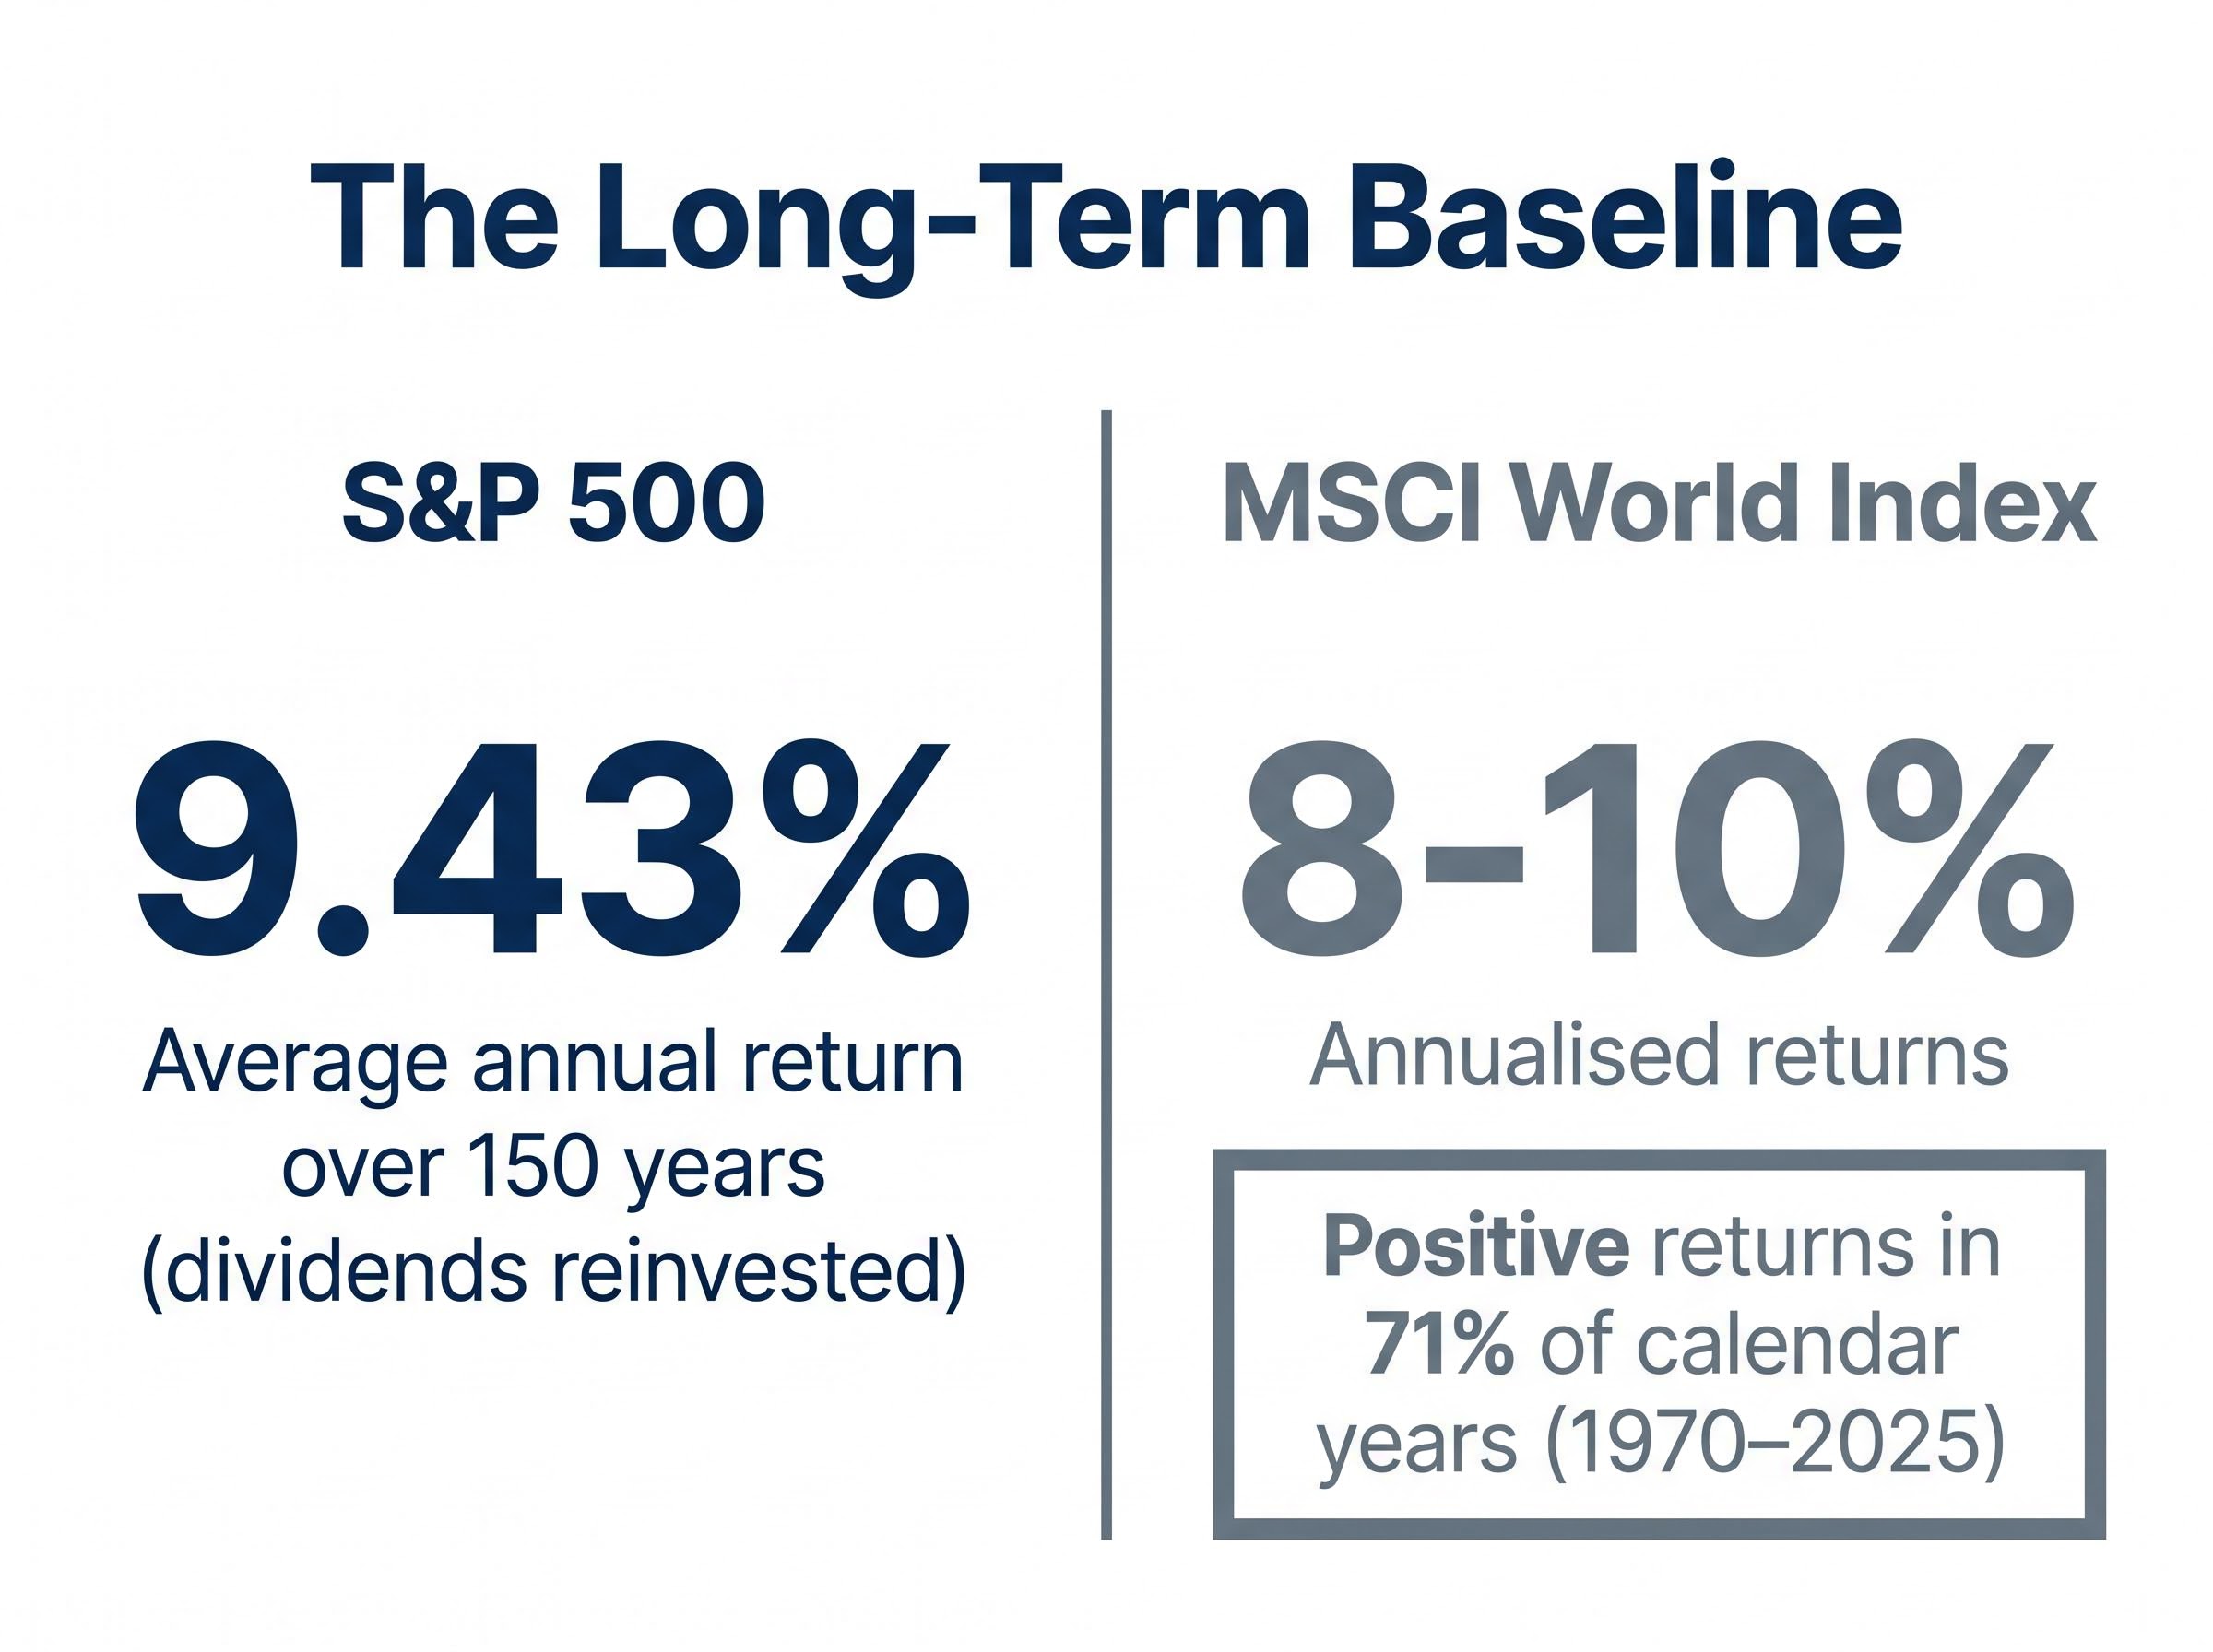
That figure is not a ceiling performance. It is the baseline for investors who did almost nothing except stay invested. The MSCI World Index tells a similar story: annualised returns of approximately 8-10% over long-term historical periods, with positive returns in roughly 71% of calendar years from 1970 to 2025. The odds favour the patient holder overwhelmingly, and they punish the frequent trader through costs, taxes, and mistimed exits.
Emotional resistance is the real barrier. A 20% drawdown in a single quarter feels threatening. Over a 30-year holding period, it barely registers. Short-term volatility is noise against a multi-decade return trend, but it does not feel like noise when it is happening. Recognising that gap between perception and outcome is the first investment decision that matters.
The cost of reactive trading compounds across four mechanisms simultaneously: transaction fees, the forfeiture of the 50% CGT discount on short-held positions, mistimed re-entry after missing recovery sessions, and the opportunity cost of uninvested cash, with behavioural finance research estimating a return drag of approximately 1.5% per annum from these biases alone.
Three principles favour long-term approaches over short-term trading:
- Compounding: Returns earned on previous returns accelerate wealth creation exponentially over time, and this effect only operates with uninterrupted holding periods
- Reduced trading costs: Fewer transactions mean lower brokerage fees, tighter spreads, and less market impact, all of which compound as retained capital
- Tax efficiency: Long-term capital gains treatment, where applicable, materially reduces the tax drag that erodes short-term trading profits
Over horizons under five years, bonds and alternatives improve risk-adjusted outcomes by dampening drawdowns. Over 10 years and beyond, equities reward holders on a Sharpe ratio basis that no other liquid asset class matches. Strategy selection starts with time horizon and risk tolerance, not with which instrument looks attractive this quarter.
When big ASX news breaks, our subscribers know first
Dividend investing: building an income stream from the sharemarket
Dividends appear straightforward: a company earns profits, distributes a portion to shareholders quarterly or semi-annually, and the investor collects income. The instinct to seek the highest yield possible seems rational. It is also one of the most reliable paths to capital loss.
High nominal yields frequently signal financial distress rather than income strength. A company paying a 10% yield may be doing so because its share price has collapsed, not because its earnings support generous distributions. Morningstar’s 2026 analysis emphasises quality screens (economic moats, balance sheet strength) to avoid these dividend traps, focusing on total return rather than headline yield.
The quality-over-yield principle reframes dividend investing as a selection discipline. Investors building durable income streams should evaluate:
The dividend discount model formalises this quality-over-yield logic by treating a stock’s intrinsic value as the present value of its future dividend stream rather than its anticipated resale price, anchoring the selection decision in cash flow fundamentals rather than market sentiment.
- Economic moat: Does the business hold a competitive advantage that protects its earnings?
- Payout ratio sustainability: Is the company distributing a manageable share of earnings, or stretching beyond what cash flow supports?
- Balance sheet strength: Can the business maintain dividends through a downturn without increasing debt?
- Dividend growth history: Has the company consistently raised its dividend over time, signalling confidence in future cash flows?
Not every company pays dividends. Growth-oriented businesses frequently redirect profits into operations and expansion. For those that do, geographic context matters significantly in 2026.
| Index / Market | Approximate Yield (2026) | Key Notes |
|---|---|---|
| S&P/ASX 200 | 3.37-3.53% | Supported by franking credits for Australian tax residents |
| FTSE 100 | ~3.3% (forecast) | Steady 3.8% dividend growth projected |
| MSCI EAFE (via IEFA) | 3.50% (trailing) | Broad developed-market international exposure |
| US equities (Morningstar proxy) | Below 1.2% | Buybacks outpace dividends; headline yield depressed |
Global aggregate dividends are projected to grow 2.9% in 2026 to $2,471 billion, according to S&P Global Market Intelligence, moderating from 4.7% growth in 2025. S&P 500 dividends are forecast to surge 6.4%, significantly outpacing the global average. Sectors reviving dividend yields include industrials, energy, and consumer defensives, with banks globally benefiting from post-rate-normalisation conditions.
Index funds and ETFs: the case for owning the whole market
An index fund holds every stock in a benchmark index, in proportion to its weighting, and charges a fraction of what an active manager does. An exchange-traded fund (ETF) does the same but trades on a stock exchange like an ordinary share, with prices updating throughout the trading day. Both give an investor access to hundreds or thousands of companies through a single purchase.
The structural edge is cost. A fund charging 0.07% annually (7 basis points) retains almost the entire market return for the investor. A fund charging 1.0% annually does not.
- A low-cost index ETF charges 0.07% versus 1.0% for a typical actively managed fund
- The 0.93% annual difference is retained by the investor and compounds each year
- Over 30 years on a $50,000 investment, that fee drag becomes substantial, potentially amounting to tens of thousands of dollars in foregone returns
The evidence base supporting passive investing strengthened further into 2026. Investor demand for international equity ETFs surged as the MSCI All Country World ex-USA outperformed the S&P 500 by double digits in 2025 into 2026. The USD weakened approximately 9% in 2025, materially boosting unhedged international ETF returns. International dividend ETFs returned approximately 35% in 2025 versus US technology, according to market analysis.
The SPIVA scorecard data on active versus passive performance, compiled by S&P Dow Jones Indices across more than two decades, consistently shows that the majority of actively managed funds underperform their benchmark index over 10-year and 15-year periods, reinforcing why cost and consistency matter more than manager selection for most investors.
Concrete examples illustrate the cost efficiency. The Vanguard International Dividend Appreciation ETF (VIGI) and the iShares Core MSCI EAFE ETF (IEFA) both carry expense ratios of just 7 basis points after fee cuts in 2025-2026. IEFA yields 3.50% trailing as of 31 March 2026, offering both income and broad developed-market exposure across the S&P/ASX 200, S&P 500, MSCI World, FTSE 100, and Dow Jones Industrial Average universes.
The trade-off is real. Index investors cannot avoid declining holdings within the benchmark. There is no individual stock selection, no capacity to overweight conviction positions. Performance tracks the market by design, including in downturns.
ETFs vs. managed index funds: which structure suits you
ETFs trade on exchanges with intraday pricing and require a brokerage account. Managed index funds price once at end of day and are typically accessed via investment platforms, sometimes without brokerage fees.
The choice often comes down to access method. Investors who want intraday flexibility and the ability to place limit orders may prefer ETFs. Those who favour automatic recurring investments from salary or savings, without the friction of placing individual trades, may find managed index funds more practical. The underlying index exposure can be identical; the wrapper determines how the investor interacts with it.
Bonds and fixed income: the stabilising layer in a long-term portfolio
Bonds are not a consolation prize for investors who lack the appetite for equities. They are precision instruments for managing drawdown risk and smoothing income across market cycles.
A bond is a loan to a government or corporation. The borrower pays regular interest (the coupon) and returns the principal at maturity. Government bonds carry lower risk and lower yields. Corporate bonds pay more but introduce credit risk, the possibility that the borrower defaults. Both provide predictable income streams that equities cannot replicate.
The current rate environment makes the allocation decision genuinely nuanced, particularly outside the United States.
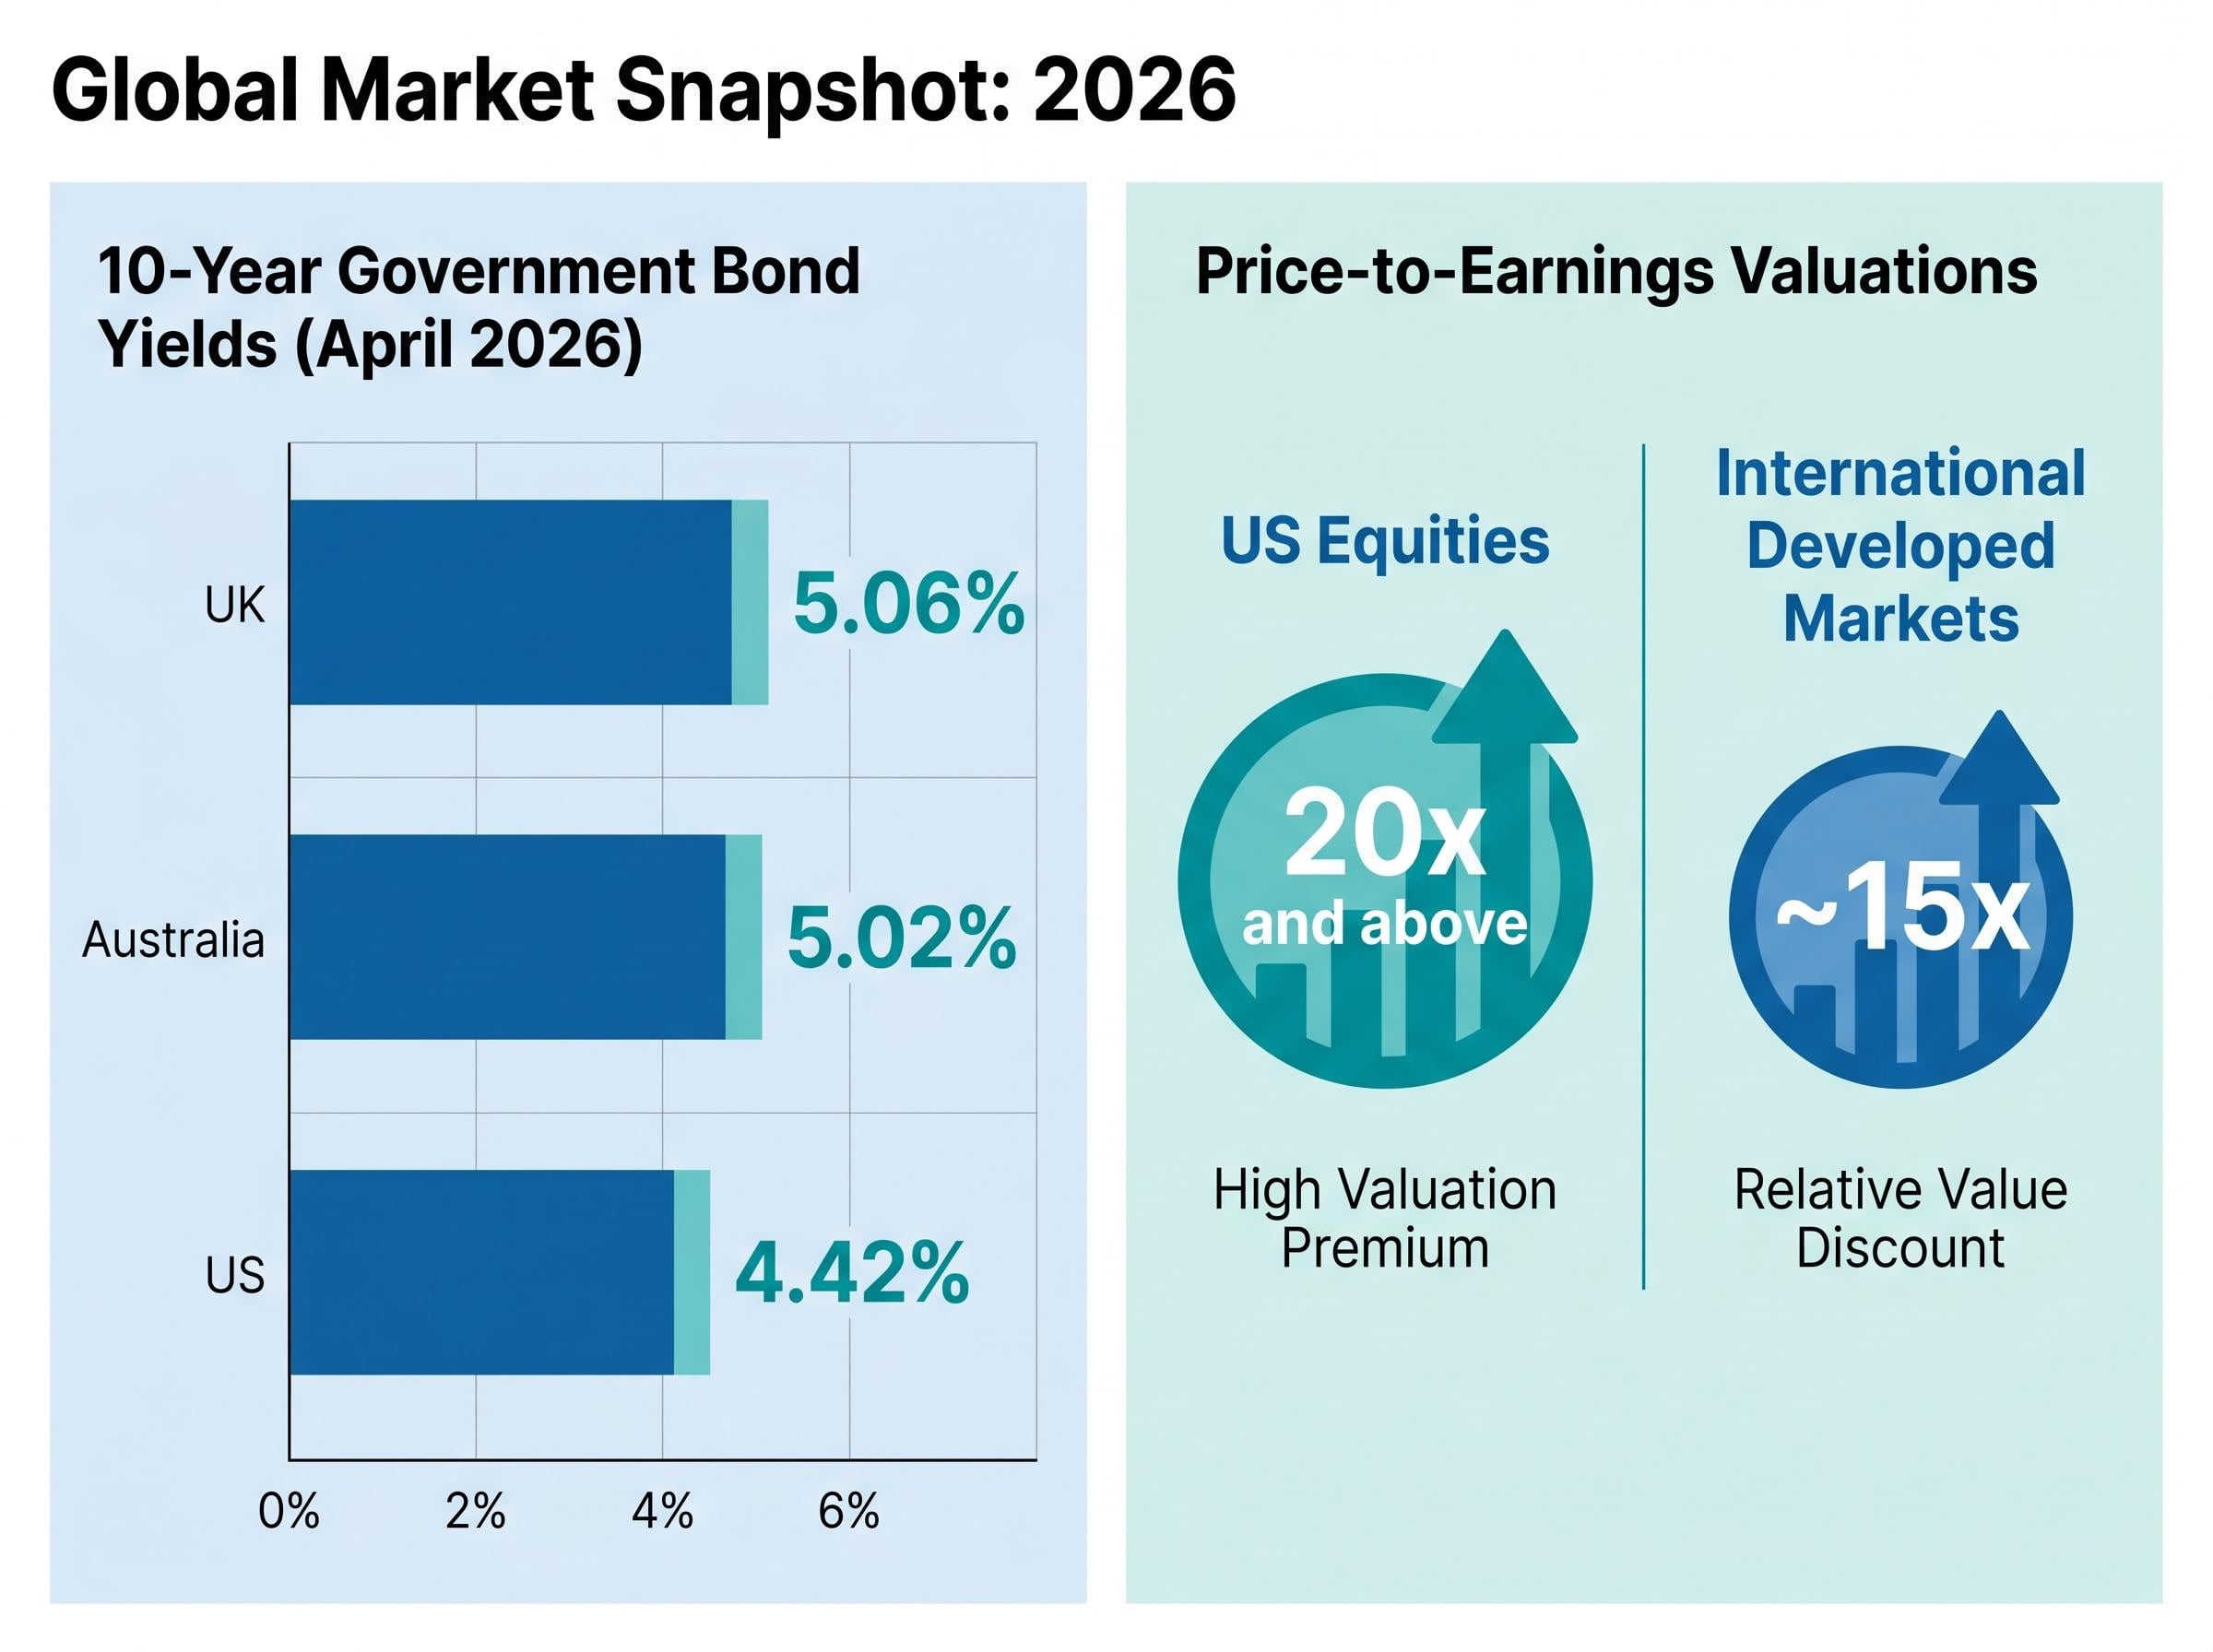
UK 10-year gilt yields of approximately 5.06% and Australian 10-year government bond yields of approximately 5.02% currently rival local equity dividend yields in their respective markets, making geographic context a determining factor in the bonds-versus-equities decision.
In the US, the 10-year Treasury yields approximately 4.42% as of April 2026. The Federal Reserve’s three rate cuts in 2025 brought the funds rate to 3.50-3.75%, compressing high-yield savings accounts to the low-4% range. Lower rates reduce borrowing costs for high-debt dividend sectors such as utilities and real estate investment trusts (REITs), creating an indirect bond-to-equity rotation effect that benefits income-seeking investors on both sides.
Morningstar’s Federal Reserve rate analysis confirms the funds rate has been held at 3.50-3.75% since the December 2025 cut, with market expectations for further reductions in 2026 having largely evaporated, a stability that shapes the relative attractiveness of dividend equities and bonds across this planning cycle.
| Type | Approximate Yield Range | Risk Level | Best Suited For |
|---|---|---|---|
| Government bonds | 4.42-5.06% | Low | Capital preservation, liquidity, portfolios within 5 years of drawdown |
| Corporate bonds (investment grade) | 5.0-6.5% | Moderate | Income enhancement, investors willing to accept credit risk for higher yield |
Over horizons under five years, bonds materially improve risk-adjusted outcomes by reducing drawdown severity. For investors drawing on their portfolio, or approaching that stage, bonds provide the liquidity and stability that allow them to avoid selling equities at distressed prices during a downturn. That capacity to stay invested is often the difference between capturing a recovery and locking in losses.
Fixed income duration risk has taken on renewed relevance in the current supply-shock environment, where floating rate bond ETFs such as QPON have significantly outperformed fixed rate alternatives, validating the case for actively managing duration rather than treating all bond exposure as interchangeable defensive ballast.
Patience as a method: how consistent investing builds long-term wealth
Patience is not an attitude. It is a set of operational decisions that compound over time.
The buy-and-hold approach requires identifying assets with long-term appreciation potential and then holding them through short-term volatility. This demands both analytical conviction at entry and psychological resilience during downturns. An illustrative example, drawn from CommBank educational materials: 1,000 shares of Apple purchased at US$1 per share in 2000 were valued at approximately US$200 per share by 2025, representing a US$199,000 gain above the original outlay. The returns were not linear. They required holding through multiple drawdowns of 30% or more.
Dollar-cost averaging (DCA) is the operational partner to buy-and-hold. It involves committing a fixed monetary amount at regular intervals regardless of price, which smooths entry points across market cycles.
The mechanics work as follows:
- Choose a fixed dollar amount to invest at each interval (e.g., $250 per month)
- Invest at the scheduled interval regardless of whether the market is up or down
- When prices are lower, the fixed amount buys more units; when prices are higher, it buys fewer
- Over time, the average cost per unit tends to fall below the average market price during the period
A CommBank illustrative example demonstrates this: splitting a $1,000 investment into four $250 instalments over one year at an average unit cost of $2.00 yielded 46 additional units compared to a single $1,000 transaction.
A foundational Vanguard study using data from 1926 to 2015 found that lump-sum investing outperforms dollar-cost averaging approximately two-thirds of the time in historically upward-trending markets.
That finding sounds like an argument against DCA, but context matters. Lump-sum investing wins when markets rise, which they do most of the time. DCA adds its greatest value under specific conditions:
- Highly volatile markets where timing risk is elevated
- Investors receiving regular income who invest periodically by necessity
- Individuals prone to emotional decision-making during downturns, for whom DCA removes the paralysis of choosing when to commit capital
Most long-term investors use both strategies simultaneously: holding core positions for years while adding to them incrementally from salary or savings. Understanding why each works removes the temptation to abandon the plan during the downturns that are inevitable in any multi-decade investing horizon.
Putting it together: how these strategies work as a portfolio
Dividend stocks, index ETFs, bonds, and buy-and-hold discipline are not competing approaches. They are complementary layers that serve different functions within a single diversified portfolio.
Geographic diversification strengthens the architecture further. According to Thornburg’s 2026 outlook, international developed markets trade at approximately 15x price-to-earnings versus 20x and above for US equities, offering valuation advantages alongside dividend income. International developed markets also carry significantly lower technology sector weights compared to the S&P 500’s dominant allocation, reducing concentration risk. The USD weakness of approximately 9% in 2025 amplified returns on unhedged international exposure, creating a currency tailwind that added meaningfully to total return.
Real assets, including commodities and infrastructure, offer non-correlated return streams and inflation protection. Both Cohen & Steers and Morgan Stanley have identified real assets as constructive for 2026 portfolios, complementing dividend equity strategies with diversification that pure equity and bond portfolios cannot provide.
| Layer | Instruments | Primary Role | Time Horizon Best Suited For |
|---|---|---|---|
| Growth equities / Index ETFs | S&P 500 ETFs, MSCI World ETFs, international equity ETFs | Capital appreciation, broad market participation | 10+ years |
| Dividend stocks | Quality dividend payers, dividend growth ETFs (e.g., VIGI) | Passive income, compounding via reinvestment | 7+ years |
| Bonds / Fixed income | Government bonds, investment-grade corporates, bond ETFs | Volatility dampening, drawdown protection, liquidity | 1-5 years (or as portfolio stabiliser) |
| Cash / Term deposits | High-yield savings, term deposits | Immediate liquidity, emergency reserves | Under 1 year |
The allocation tilt depends on time horizon and goal. Investors with 10+ year horizons can weight heavily toward equities and growth ETFs, accepting short-term volatility for higher long-term expected returns. Those within 5 years of drawing on their portfolio should increase bond and income allocations to reduce drawdown risk at the point it matters most.
For investors wanting to see these allocation principles applied to a live market environment, our comprehensive walkthrough of layered portfolio construction examines how Australian ETF investors deployed $5.6 billion during the March 2026 selloff and walks through a three-layer cash, income, and equity framework with specific instrument examples for each tier.
The tax layer: why where you hold matters as much as what you hold
Holding long-term investments inside tax-advantaged accounts materially amplifies compounding by reducing annual tax drag on dividends and capital gains. In Australia, superannuation provides concessional tax treatment. In the UK, Individual Savings Accounts (ISAs) shelter income and gains entirely. In the US, IRAs and 401(k) plans defer or eliminate tax depending on the account type.
Cross-border investors face additional complexity. Dividend withholding taxes on international ETFs create a drag that is absent in domestic holdings, making after-tax yield comparisons the relevant measure rather than headline yields. Professional tax advice is worthwhile for globally diversified portfolios, particularly where tax treaties (such as the US-Australia treaty) influence withholding rates.
The long game is the strategy
No single strategy from this guide is optimal in isolation. Patient investors who combine passive income instruments, index exposure, fixed income, and disciplined holding periods have historically been rewarded by the mathematics of compounding and the structural advantages of time.
The numbers bear repeating. The S&P 500 has returned approximately 9.43% annually over 150 years. The MSCI World Index has delivered positive returns in 71% of calendar years since 1970. These are not projections. They are the documented record of what staying invested has produced.
The practical next step is personal. Assess your own time horizon. Consider which strategies align with income needs versus growth objectives. Evaluate how geographic diversification and tax-efficient account structures apply to your circumstances. Independent financial and tax advice is worthwhile before implementing any specific approach.
This article is for informational purposes only and should not be considered financial advice. Investors should conduct their own research and consult with financial professionals before making investment decisions. Past performance does not guarantee future results. Financial projections are subject to market conditions and various risk factors.