Why ThaiBev’s RTD Spirits Bet Is a Tax Play, Not a Trend Chase
33 mins ago

The world’s largest single corporate cash pile just grew again. As of 31 March 2026, Berkshire Hathaway held $397.4 billion in cash and Treasury instruments, up from $381.7 billion at the end of 2025 and still entirely undeployed into new equity positions. Greg Abel assumed the CEO role on 31 December 2025, inheriting not just the Berkshire empire but a strategic posture Warren Buffett spent 19 months constructing: maximum optionality, minimal new exposure to equities priced at historically stretched valuations. The cash pile did not shrink under Abel. It grew.
What follows is an examination of why Berkshire has accumulated cash on this scale before, which three quantitative signals currently reinforce that posture, and why monitoring Abel’s first major deployment decision may represent one of the most consequential market signals of this decade for individual investors.
The Berkshire cash reserve was not accumulated passively. It was constructed through the deliberate liquidation of the company’s two largest equity positions across 2025, with the proceeds channelled directly into U.S. Treasury bills.
The key portfolio exits tell a coherent story:
These were not isolated portfolio adjustments. They reflected a unified valuation judgement: risk-free bonds were offering better yield-adjusted returns than broad equities.
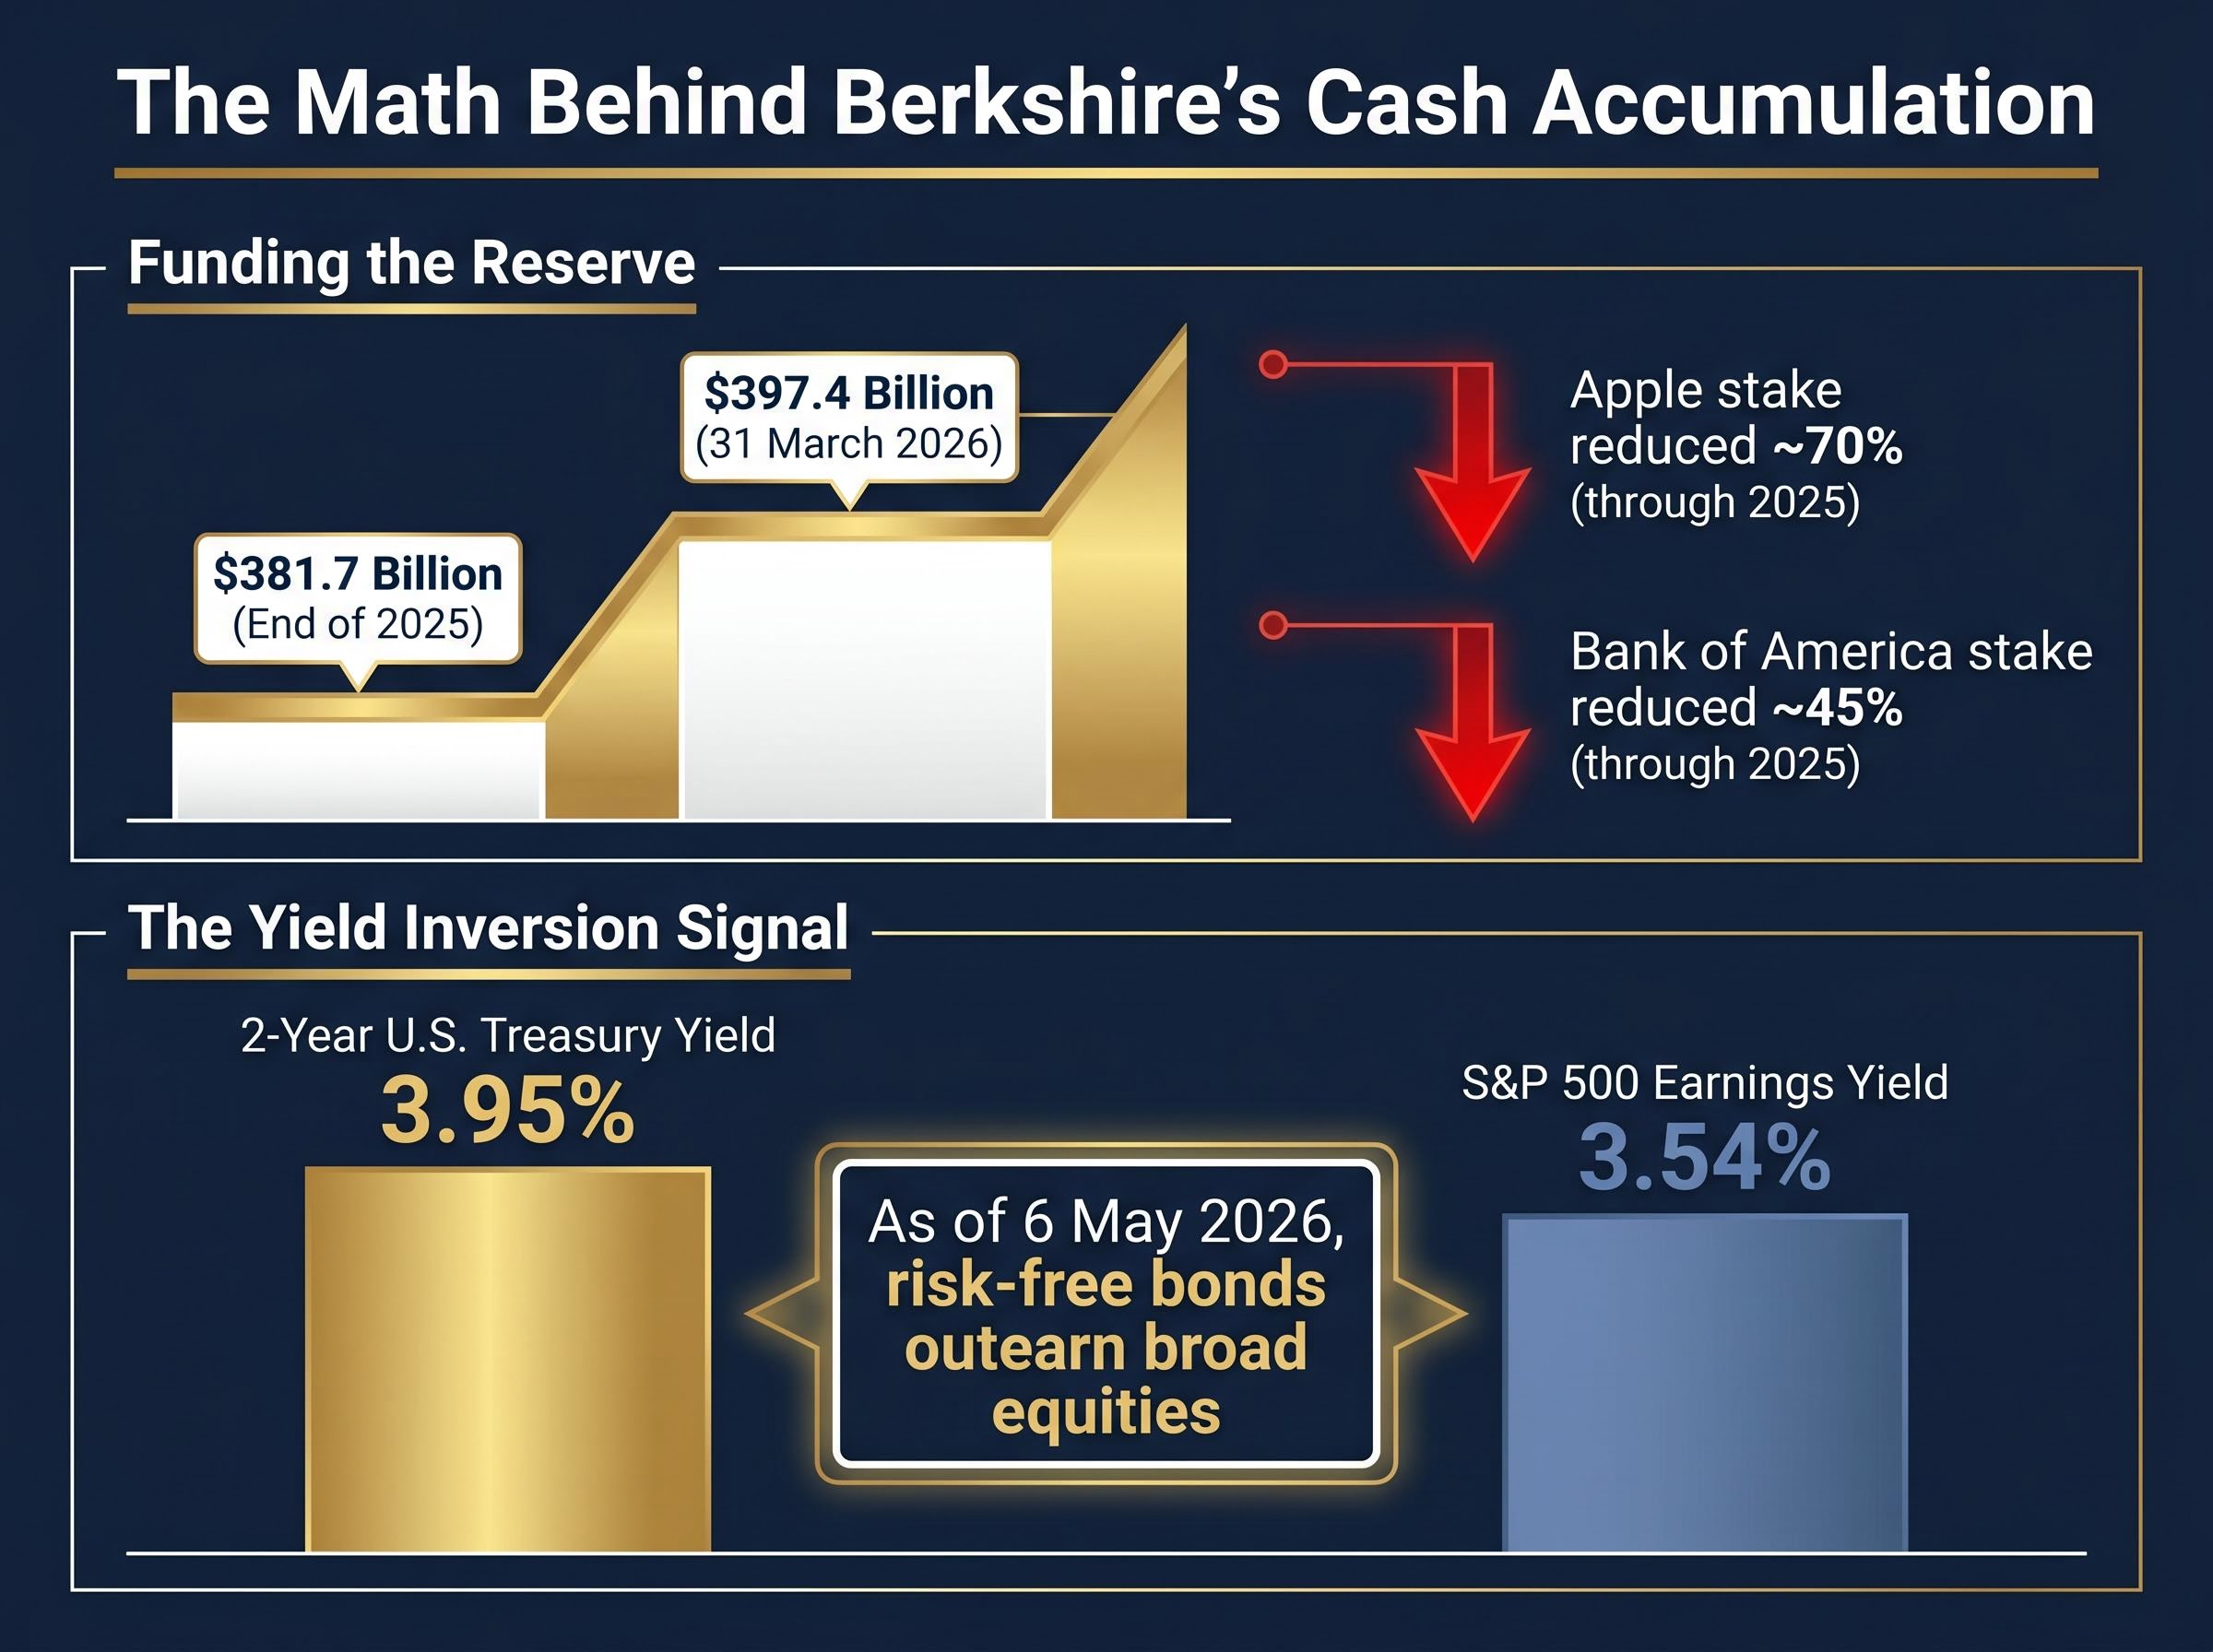
As of 6 May 2026, the 2-year U.S. Treasury yield of 3.95% exceeds the S&P 500 earnings yield of 3.54%, meaning risk-free bonds are outearning broad equities on a simple yield basis.
The mathematical logic underpinning the posture is visible in the earnings data. Berkshire reported Q1 2026 net earnings of $10.106 billion, roughly doubling from $4.603 billion in Q1 2025, with T-bill interest income contributing meaningfully to that increase. The cash pile is not idle. It is earning.
The Q1 2026 earnings release confirmed operating profit of $11.35 billion, up 18% year-over-year, alongside the record $397 billion cash reserve, with Greg Abel also resuming share buybacks for the first time since May 2024 at a modest $234 million, a signal of valuation confidence rather than large-scale deployment.
Three independent metrics currently point in the same direction, and their simultaneous elevation carries more analytical weight than any one signal alone.
The Buffett Indicator divides total U.S. equity market capitalisation by GDP, producing a single ratio that measures how expensive the stock market is relative to the economy’s actual output. Buffett described it in a 2001 Fortune magazine article as “probably the best single measure of where valuations stand at any given moment.”
His framework placed approximate 100% as fairly valued, above approximately 120% as expensive, and approaching 200% as entering dangerous territory.
The current reading sits at approximately 226.8% to 232.6% as of May 2026.
At 226-233%, the Buffett Indicator currently exceeds the dot-com peak and sits in territory Buffett himself described as dangerous in a 2001 Fortune article.
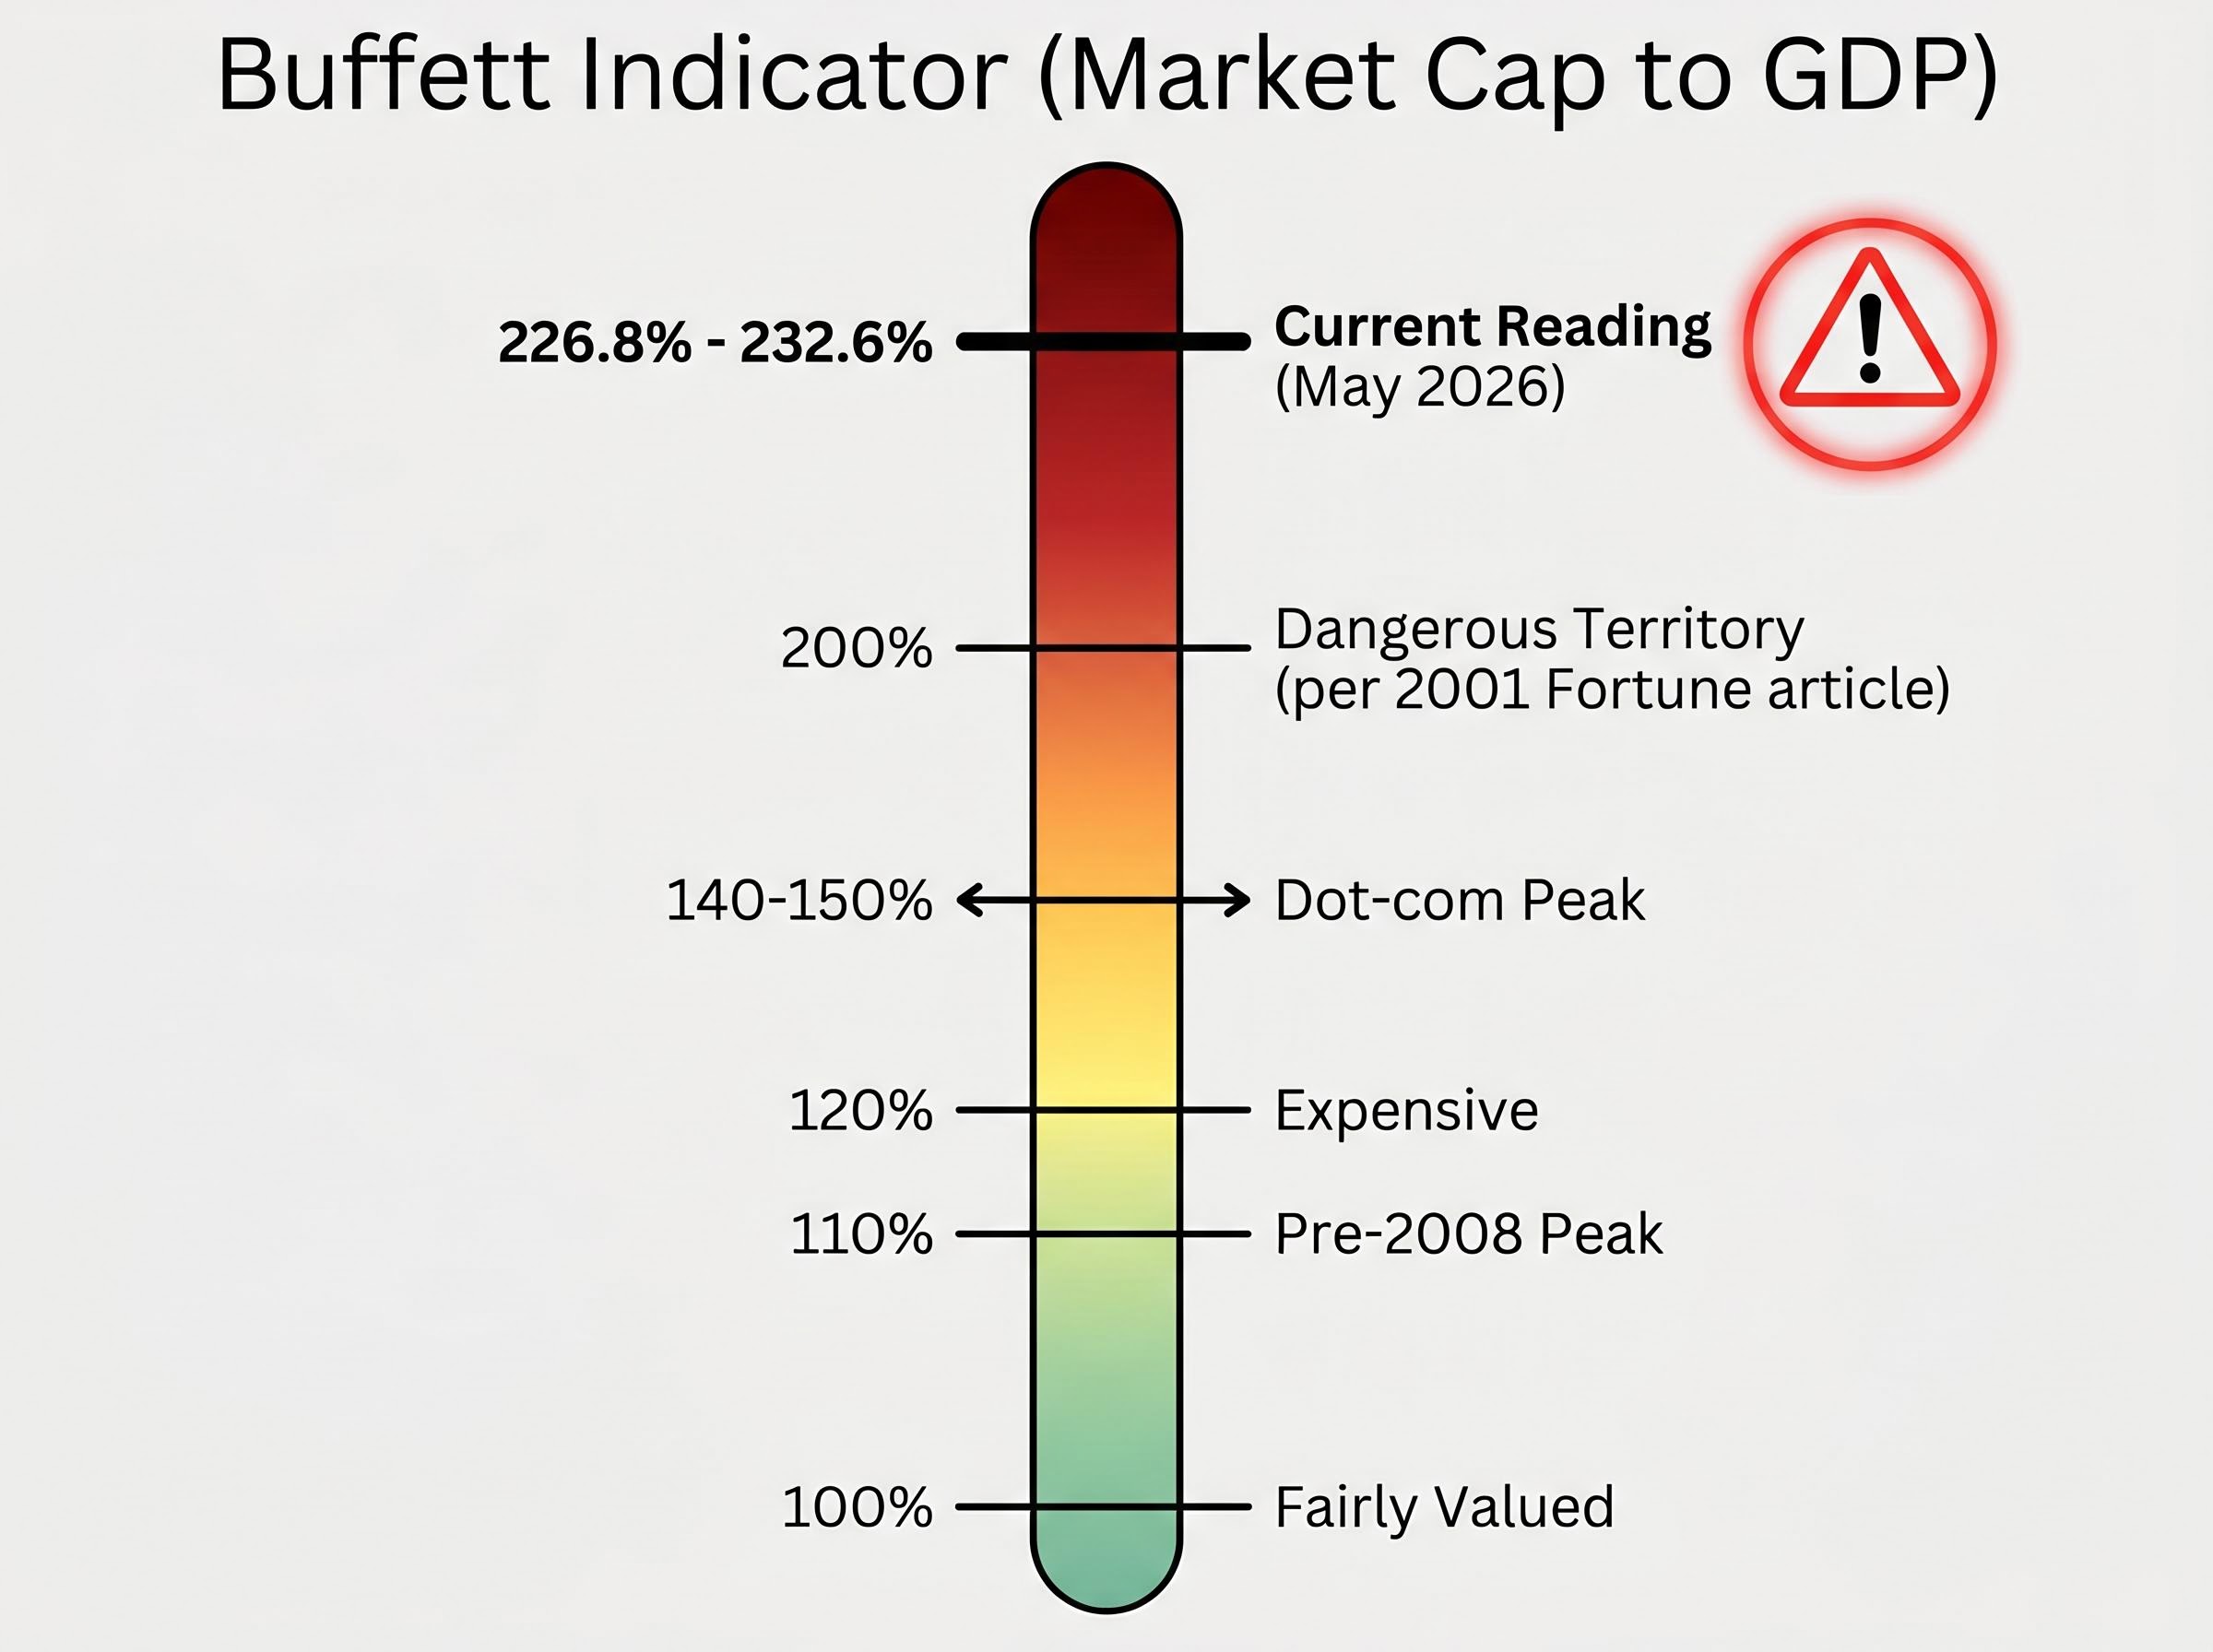
That figure exceeds the dot-com peak of approximately 140-150% and the pre-2008 peak of approximately 110% by a wide margin. For context, the ratio breached 200% during the post-COVID rally, but the current reading has pushed roughly 30 percentage points beyond that level.
The Shiller CAPE ratio provides a complementary lens to the Buffett Indicator: at 40-41 as of May 2026, it represents the second-highest reading in 155 years of U.S. market data, exceeded only by the dot-com peak of 44.2, and the top 10 S&P 500 constituents now account for 40-43% of total index market capitalisation, a concentration level more than 50% above the dot-com era peak.
The S&P 500 earnings yield represents the inverse of the price-to-earnings ratio: it measures how much profit each dollar invested in the index generates. As of 6 May 2026, that yield sits at approximately 3.54%.
The 2-year U.S. Treasury, a risk-free instrument backed by the U.S. government, yields approximately 3.95%. The spread of roughly 40-45 basis points in favour of risk-free bonds means investors are not being compensated for the additional risk of owning equities over Treasuries on a simple yield comparison.
This condition occurring simultaneously with a Buffett Indicator reading above 225% is historically rare. Both metrics arriving at the same conclusion, independently, through different mathematical pathways, strengthens the signal.
The three indicators reinforcing the current standstill:
The bear case against the current posture is straightforward. Equity markets have continued to appreciate, and $397.4 billion in T-bills earning 3.95% may underperform a rising stock market over any given quarter. That opportunity cost is real, and it compounds.
Abel faces a specific structural challenge. Deploying capital at this scale requires targets of unusual size and quality, the type of business that can absorb a $10-$50 billion investment without overpaying. Those targets are scarce at any valuation level. At current valuations, they may not exist at all.
The Berkshire succession introduced a specific confidence gap: Berkshire shares fell approximately 6% year-to-date through mid-2026, a decline analysts characterise as transitional rather than structural, reflecting investor uncertainty about whether Abel will replicate Buffett’s capital allocation instincts rather than any deterioration in the underlying business.
The counterweight is equally specific:
Q1 2026 earnings of $10.106 billion, compared to $4.603 billion in Q1 2025, illustrate that the patience is not costless but not unproductive either. T-bill income and operating earnings from subsidiaries are generating returns while the cash reserve waits.
Morningstar assigns Berkshire a Narrow Moat rating with Low Uncertainty, viewing the current posture as defensible rather than problematic. Buffett had abstained from significant new stock purchases for approximately 19 months before his retirement. Abel has continued that posture. The Q1 2026 13F filing, due 15 May 2026, will provide the first detailed window into whether Abel has initiated any equity changes.
The current posture is not unprecedented. Berkshire has built large cash positions three times before, and in each case the sequence was identical: accumulate cash when valuations appear stretched, wait, then deploy at scale when prices correct.
| Episode | What Buffett refused to do | Market outcome | Berkshire’s buying opportunity |
|---|---|---|---|
| Late 1960s | Dissolved his investment partnership entirely, citing an inability to find value | The Dow peaked near 1,000 and remained capped at that level for approximately 20 years | Acquired undervalued businesses throughout the 1970s at depressed prices |
| Dot-com bubble (1999-2000) | Refused to purchase technology stocks despite intense public criticism | The NASDAQ declined approximately 78% from its peak | Deployed capital into undervalued equities during the subsequent bear market |
| Pre-2008 | Built substantial cash reserves while credit markets overheated | The Great Recession produced the deepest equity market decline in decades | Acquired stakes in Goldman Sachs and Bank of America at depressed prices, generating tens of billions in gains |
The structural parallel to the present is clear. Berkshire’s cash as a proportion of total assets is at a 20-year high, comparable to levels last seen before the Great Recession. The pattern does not guarantee a specific outcome; markets can remain elevated for extended periods. But the consistency of the sequence across six decades of Berkshire’s history, accumulate, wait, deploy, provides the most direct evidence available for interpreting the current posture.
History does not repeat on a schedule, but the conditions that prompted each prior accumulation phase share a common denominator: Buffett could not find businesses worth buying at prevailing prices.
The transition from cash accumulation to active deployment is not a hidden institutional move. It is a trackable event, disclosed through public SEC filings that any investor can access.
The monitoring framework is straightforward:
Berkshire’s cash as a proportion of total assets is at a 20-year high, last seen before the Great Recession.
The 13F filing is a free, public document available through the SEC’s EDGAR database. Investors who understand what a deployment signal looks like in that filing, and who have already identified the businesses they would want to own at lower prices, hold a structural advantage over those who wait for mainstream financial coverage to announce the shift.
For investors who find the preparation framework easier to articulate than to execute, our full explainer on reactive trading during high-volatility periods examines the behavioural research on why retail investors who trade most actively around high-attention market events consistently underperform buy-and-hold strategies, with practical filters drawn from Goldman Sachs, Morgan Stanley, and Charles Schwab research.
Three valuation indicators, the Buffett Indicator at 226-233%, an earnings yield inversion favouring risk-free bonds, and the absence of any new equity positions, point toward the same conclusion. The $397.4 billion cash reserve is not an anomaly or a failure of imagination. It is the logical output of a disciplined valuation framework applied to a historically overvalued market.
The timing of any correction remains unknowable. Berkshire’s posture signals a reading of conditions, not a prediction about calendar dates. Markets can remain elevated well beyond the point at which valuation metrics signal risk, and have done so before.
For individual investors, the most actionable takeaway is preparation rather than a specific trade. A pre-built watchlist, pre-calculated buy prices, and the patience to wait for value represent the closest approximation of the Berkshire approach available at the retail level. The Q1 2026 13F filing, due 15 May 2026, is the next concrete data point in this story.
This article is for informational purposes only and should not be considered financial advice. Investors should conduct their own research and consult with financial professionals before making investment decisions. Past performance does not guarantee future results. Financial projections are subject to market conditions and various risk factors.
—
The Berkshire Hathaway cash pile refers to the company's holdings in cash and U.S. Treasury instruments, which reached $397.4 billion as of 31 March 2026. It grew primarily through the deliberate sale of large equity positions in Apple and Bank of America, with proceeds channelled into T-bills because risk-free bonds were offering better yield-adjusted returns than broad equities.
The Buffett Indicator divides total U.S. equity market capitalisation by GDP to measure how expensive stocks are relative to the economy's actual output. Its current reading of approximately 226-233% as of May 2026 exceeds the dot-com peak and sits in territory Buffett himself described as dangerous in a 2001 Fortune article.
Berkshire's capital deployment is publicly trackable through quarterly 13F filings with the SEC's EDGAR database. Investors should watch for new equity positions of substantial scale, sector concentration suggesting a thematic view, or a reduction in T-bill holdings paired with equity additions, with the Q1 2026 filing due 15 May 2026 being the immediate milestone.
When the S&P 500 earnings yield falls below the risk-free Treasury yield, investors are not being compensated for the additional risk of owning equities over government bonds. As of 6 May 2026, the 2-year Treasury yields approximately 3.95% versus the S&P 500 earnings yield of roughly 3.54%, meaning risk-free bonds are outearning broad equities on a simple yield basis.
Abel assumed the CEO role on 31 December 2025 and has continued Buffett's cautious posture, allowing the cash reserve to grow from $381.7 billion at end-2025 to $397.4 billion by March 2026 without adding new equity positions. He did resume share buybacks for the first time since May 2024, but only at a modest $234 million, signalling valuation confidence rather than large-scale capital deployment.