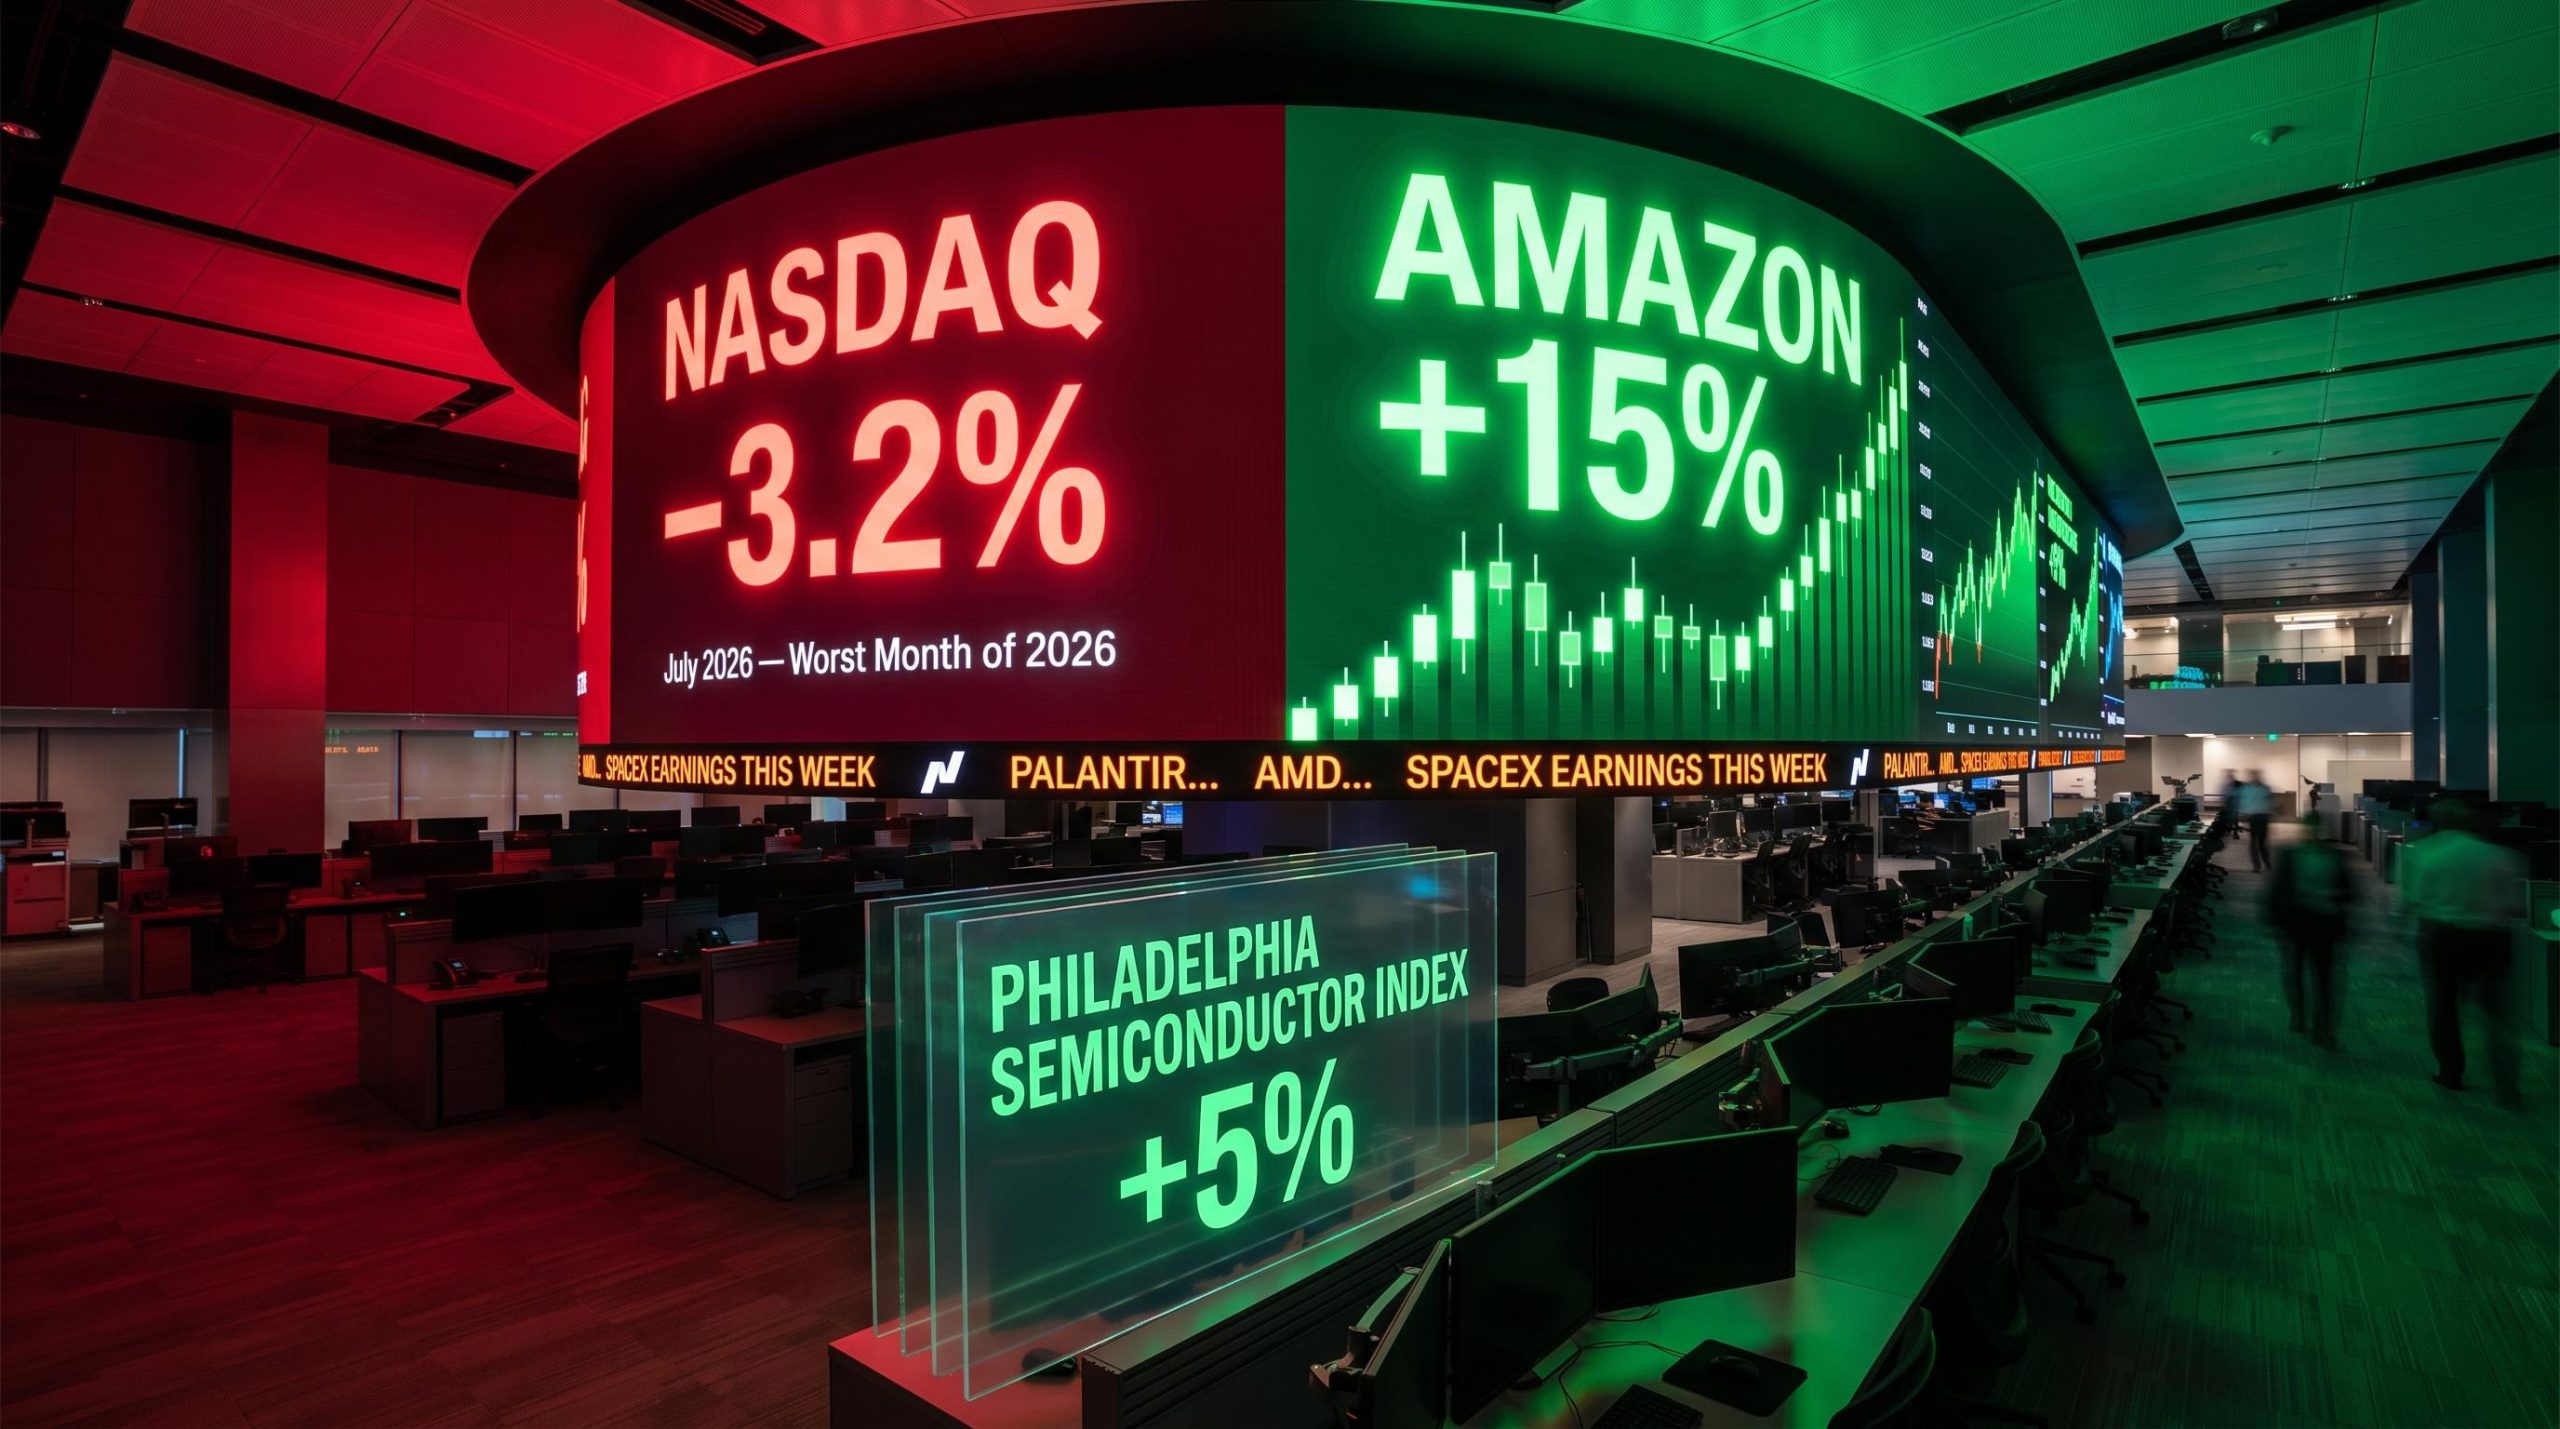
In early April 2026, a single social media post claiming Iran had sought a ceasefire sent the Dow Jones up more than 3%, the S&P 500 nearly 4%, and the Nasdaq almost 5% in a matter of hours. Iranian state media denied the claim within the same trading session. Most of those gains evaporated.
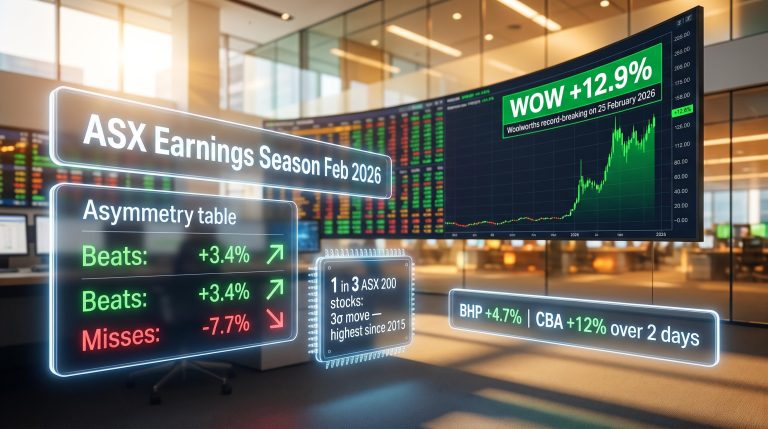
The U.S.-Iran conflict, which began with joint American-Israeli airstrikes in late February 2026, has produced some of the most headline-reactive market sessions in recent memory. Oil crossed $100 per barrel after Iran closed the Strait of Hormuz. The Nasdaq 100 entered correction territory, dropping nearly 12% from its January peak. For retail investors watching portfolios swing with every dispatch from the region, the temptation to act has rarely felt more urgent.
This guide explains why reacting to geopolitical headlines is one of the most reliably costly things a retail investor can do, what the research says about how those trades actually perform, and what a research-backed alternative looks like in practical terms when investing during geopolitical risk events.
How the Iran conflict has moved markets in 2026
The timeline tells the story before any editorial judgment needs to.
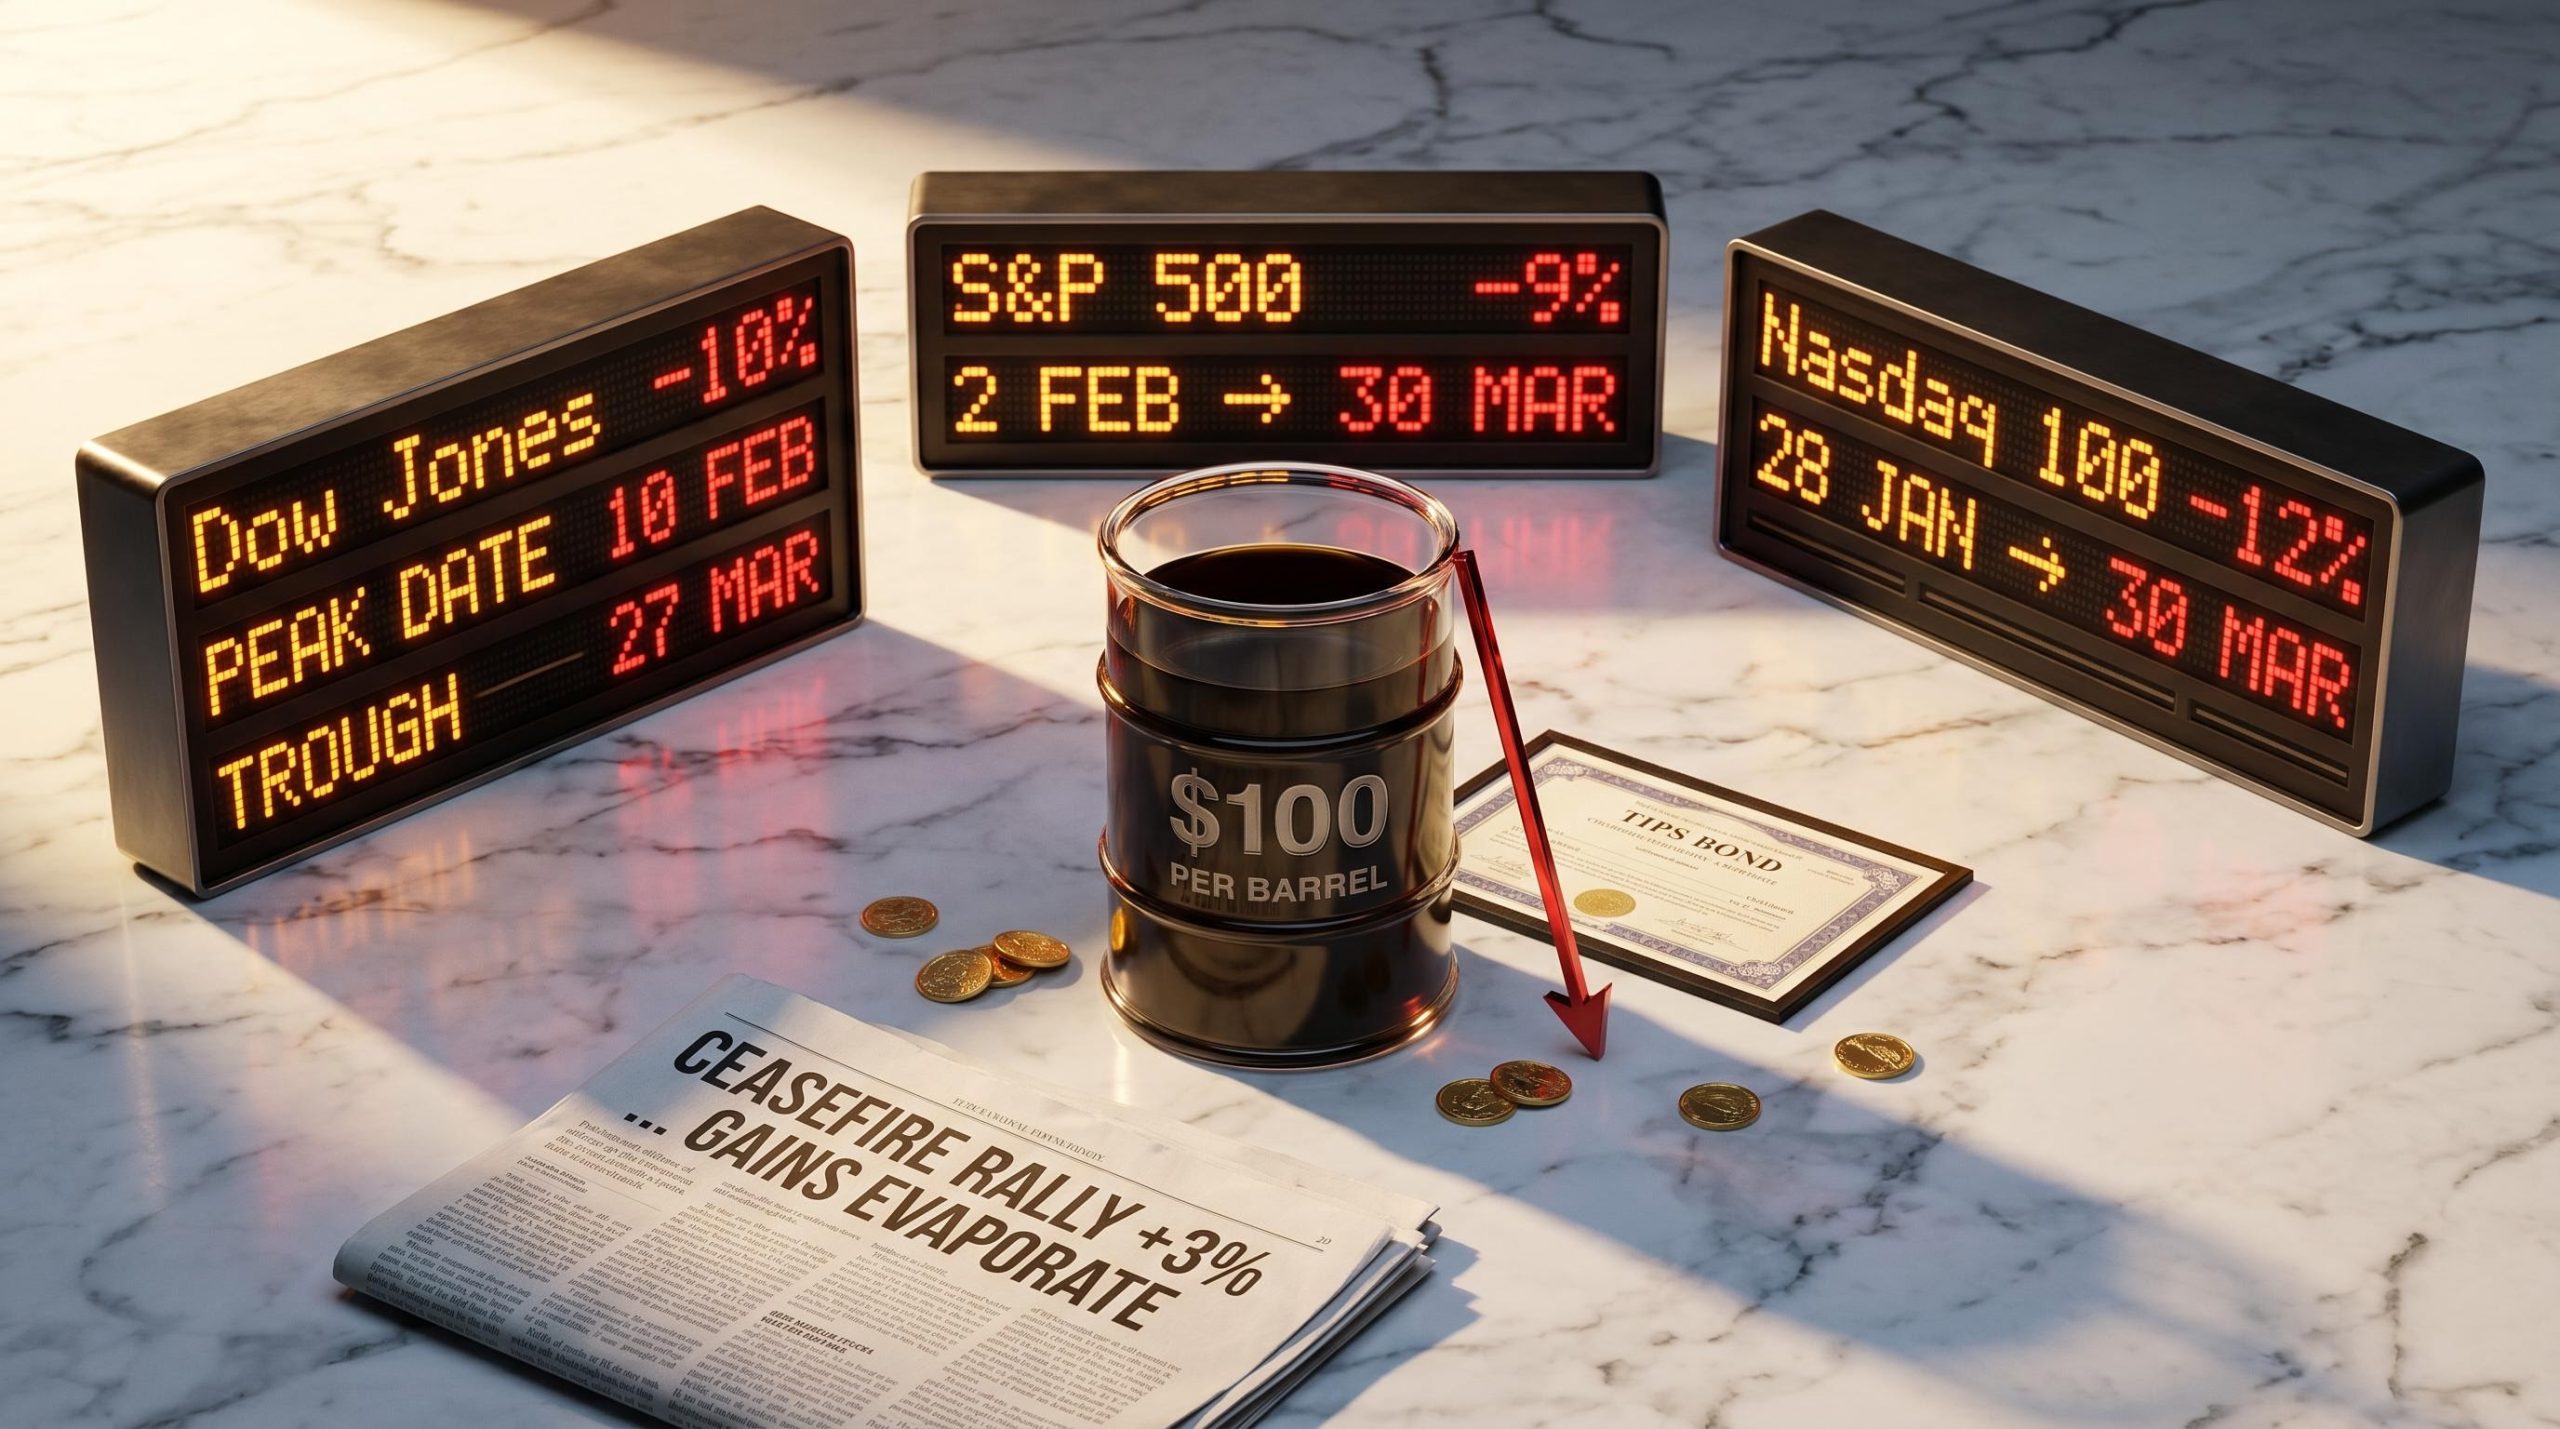
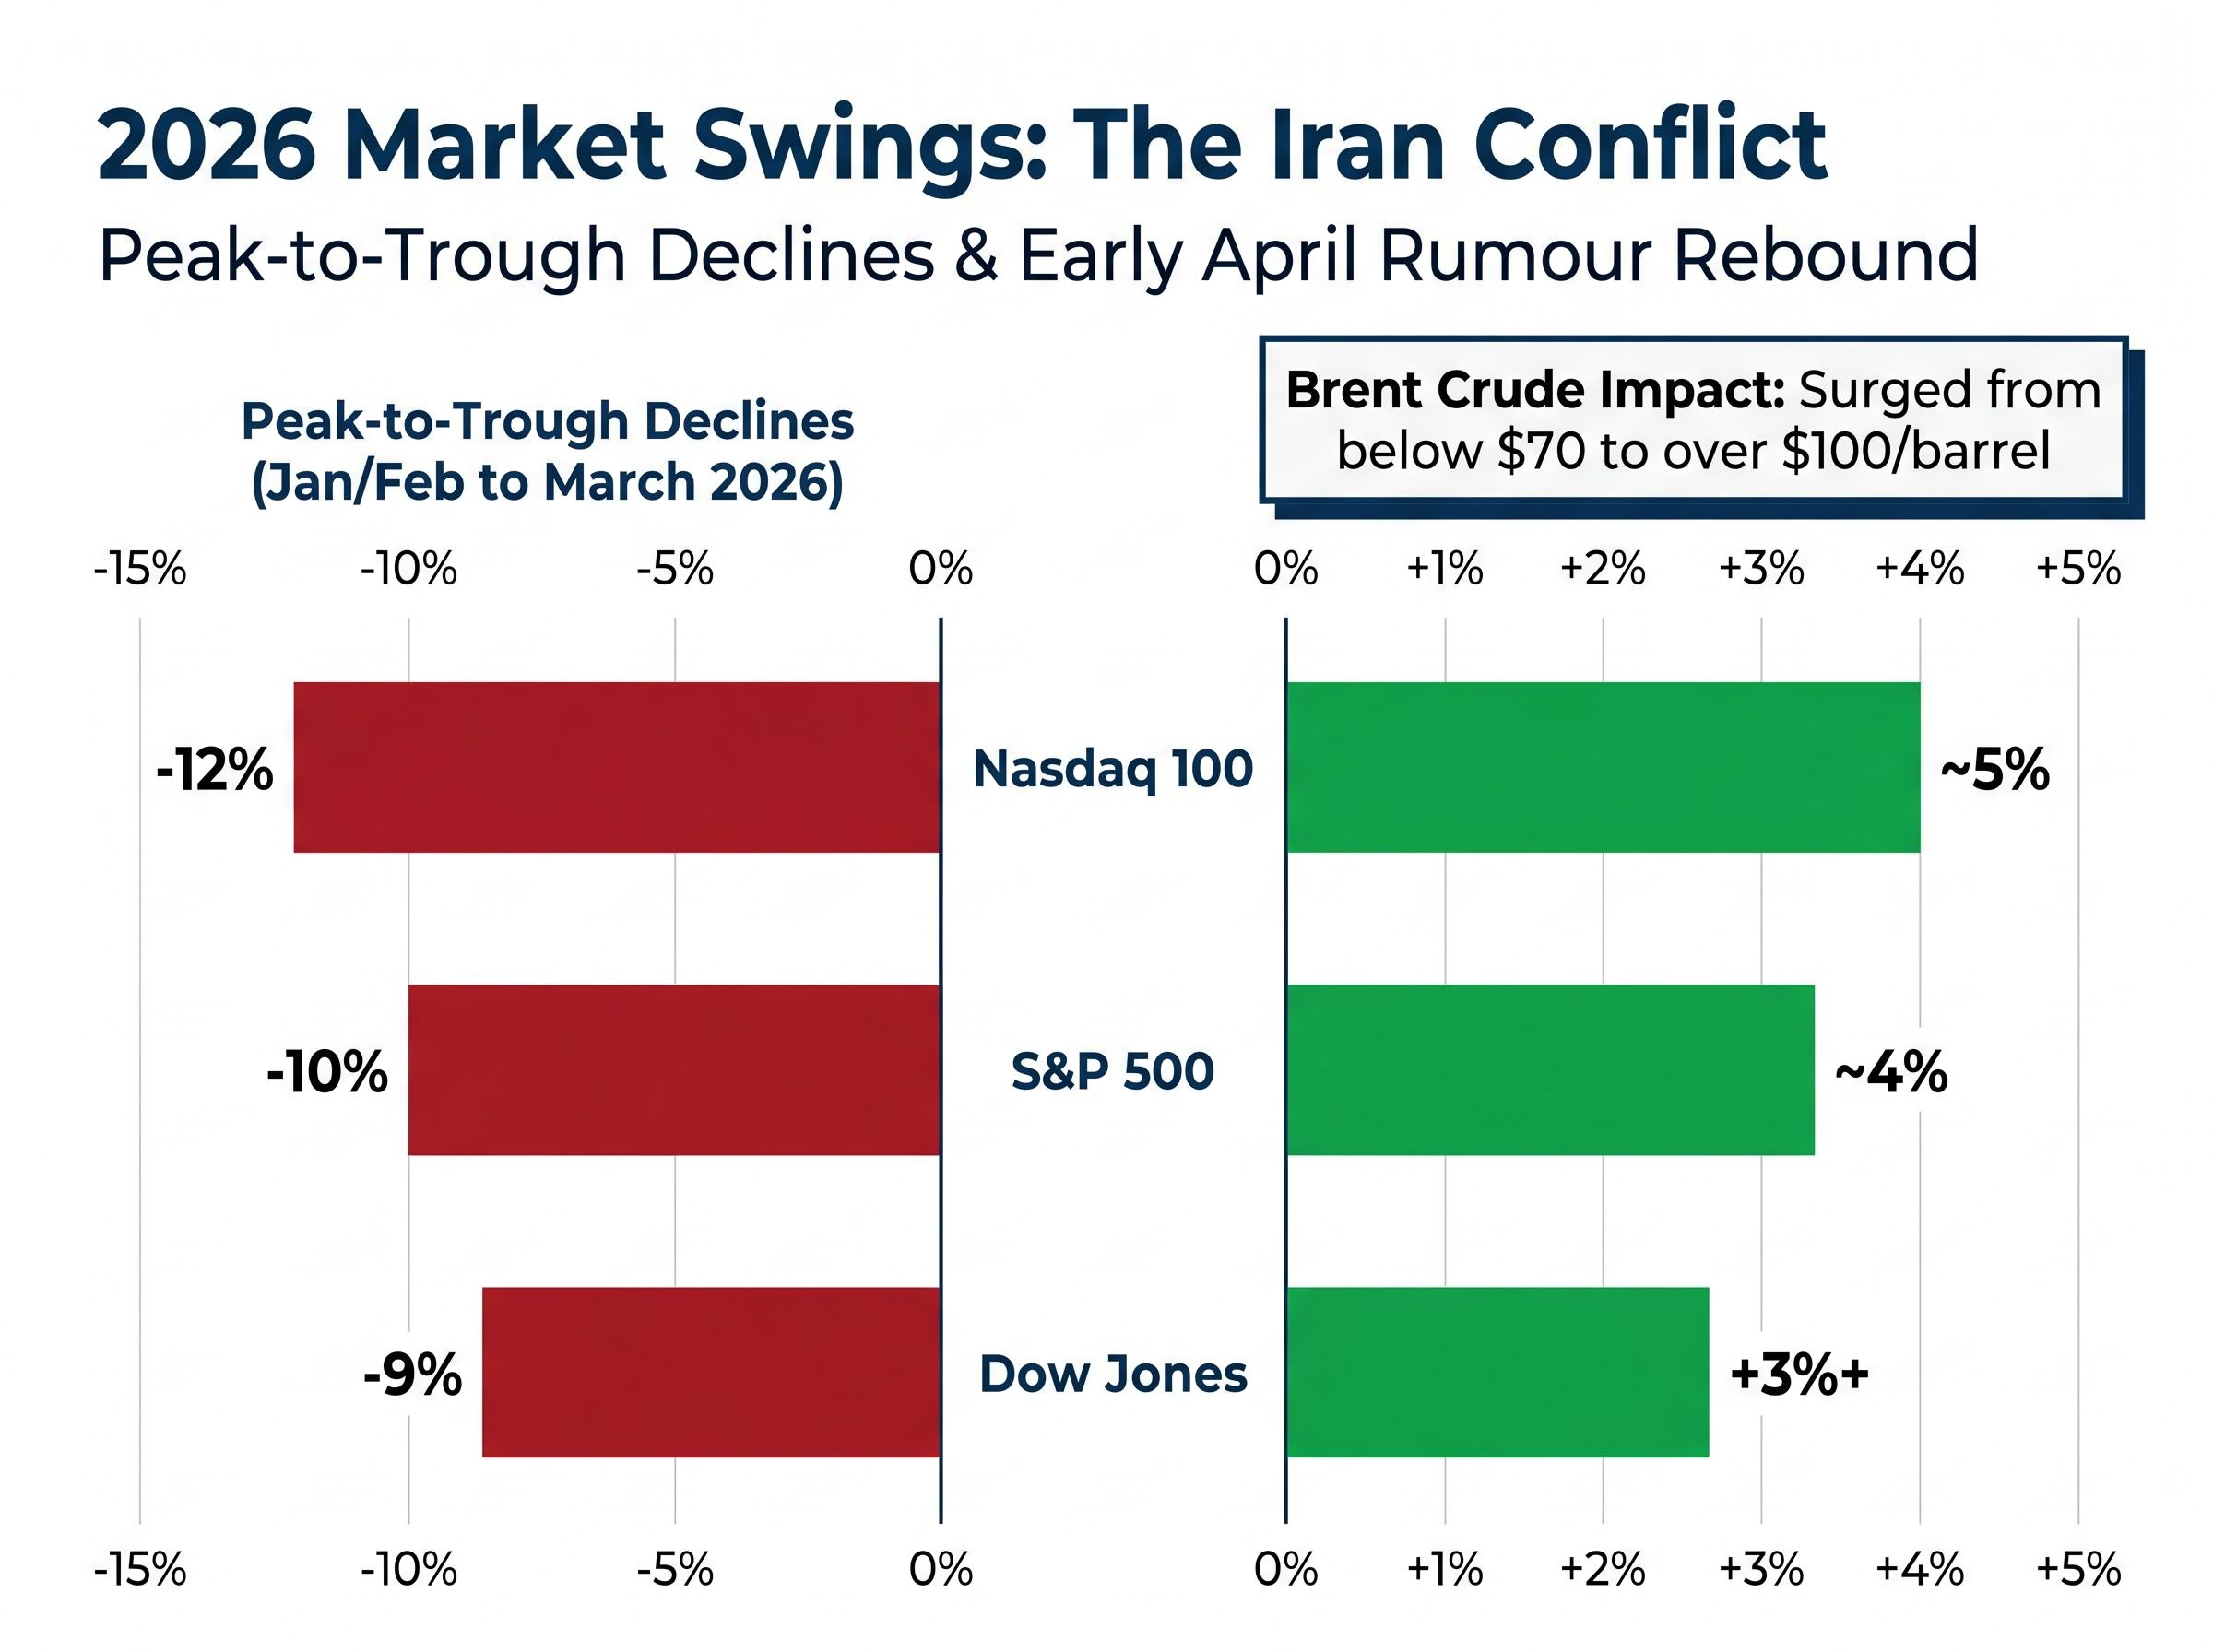
Joint U.S.-Israeli airstrikes hit Iranian targets in late February 2026. Markets fell immediately. The Dow Jones declined just over 10% from its 10 February peak to its 27 March low, entering correction territory. The Nasdaq 100 dropped nearly 12% from its 28 January high to its 30 March trough. The S&P 500 fell slightly above 9% from its 2 February peak to its 30 March low, narrowly avoiding a formal correction.
Iran’s closure of the Strait of Hormuz, which carries roughly one-third of all global oil trade according to the International Energy Agency, sent Brent Crude surging.
The 2026 oil shock has transmitted beyond energy prices into corporate margins, consumer spending patterns, and Federal Reserve rate expectations, with travel sector companies reporting significant fuel cost headwinds and discretionary spending shifting toward value-oriented retailers as consumers absorb the pump price increase.
Brent Crude climbed above $100 per barrel during the conflict, up from below $70 pre-conflict.
Then came the early April rally. A social media report suggested Iran had sought a ceasefire. Equities spiked within hours. When Iranian state media denied the report, the gains partially reversed.
| Index | Peak Date | Trough Date | Decline | Early April Rebound |
|---|---|---|---|---|
| Dow Jones | 10 February | 27 March | ~10% | +3%+ (partially reversed) |
| S&P 500 | 2 February | 30 March | ~9% | ~4% (partially reversed) |
| Nasdaq 100 | 28 January | 30 March | ~12% | ~5% (partially reversed) |
The swings have been large enough to feel actionable. That is precisely what makes them dangerous. The ceasefire rally was not an opportunity missed; it was a trap that was briefly triggered and then withdrawn.
When big ASX news breaks, our subscribers know first
Why retail investors reliably underperform during headline-driven volatility
The impulse to trade a geopolitical headline feels rational. A conflict escalates, oil surges, equities fall. Surely acting on that information is better than sitting still.
The data says otherwise. Behavioural research consistently documents that retail investors who increase trading during high-attention periods underperform buy-and-hold strategies.
The losses are not random. They follow a pattern rooted in well-documented behavioural mechanisms that intensify during geopolitical crises:
- Recency bias: Investors overweight dramatic recent events, such as an oil price spike or a conflict escalation, when projecting future outcomes, leading them to extrapolate short-term moves into long-term trends.
- Herd behaviour: Retail flows into trending assets (energy ETFs during oil shocks, defence stocks during conflicts) tend to arrive after the most significant price moves have already occurred.
- Disposition effect: Investors hold losing positions too long and sell winners too early, a tendency compounded during crises by the emotional pressure to “do something.”
- Anchoring: Retail investors anchor to pre-crisis prices, either refusing to buy during drops or refusing to sell during rebounds because the position “needs to get back to where it was.”
Terrance Odean, a behavioural economist at UC Berkeley, has documented across multiple studies that retail investors trade most actively during periods of highest headline intensity, which systematically coincides with the worst entry and exit points.
Christian Mueller-Glissmann, head of asset allocation at Goldman Sachs, characterised this dynamic in a 27 March 2026 report as “reversal risk”: the pattern of buying rallies on rumour and selling declines on confirmation. Applied to the Iran conflict, this describes the retail investor who chased the ceasefire rally after it had already run, then watched the gains evaporate when the report was denied.
The problem is not a lack of information. It is the speed at which markets price that information relative to the speed at which most retail investors can act.
What the historical record reveals about oil price surges and stock returns
Brent Crude above $100 per barrel feels like it should mean sustained equity losses. The historical record is more complicated than that assumption suggests.
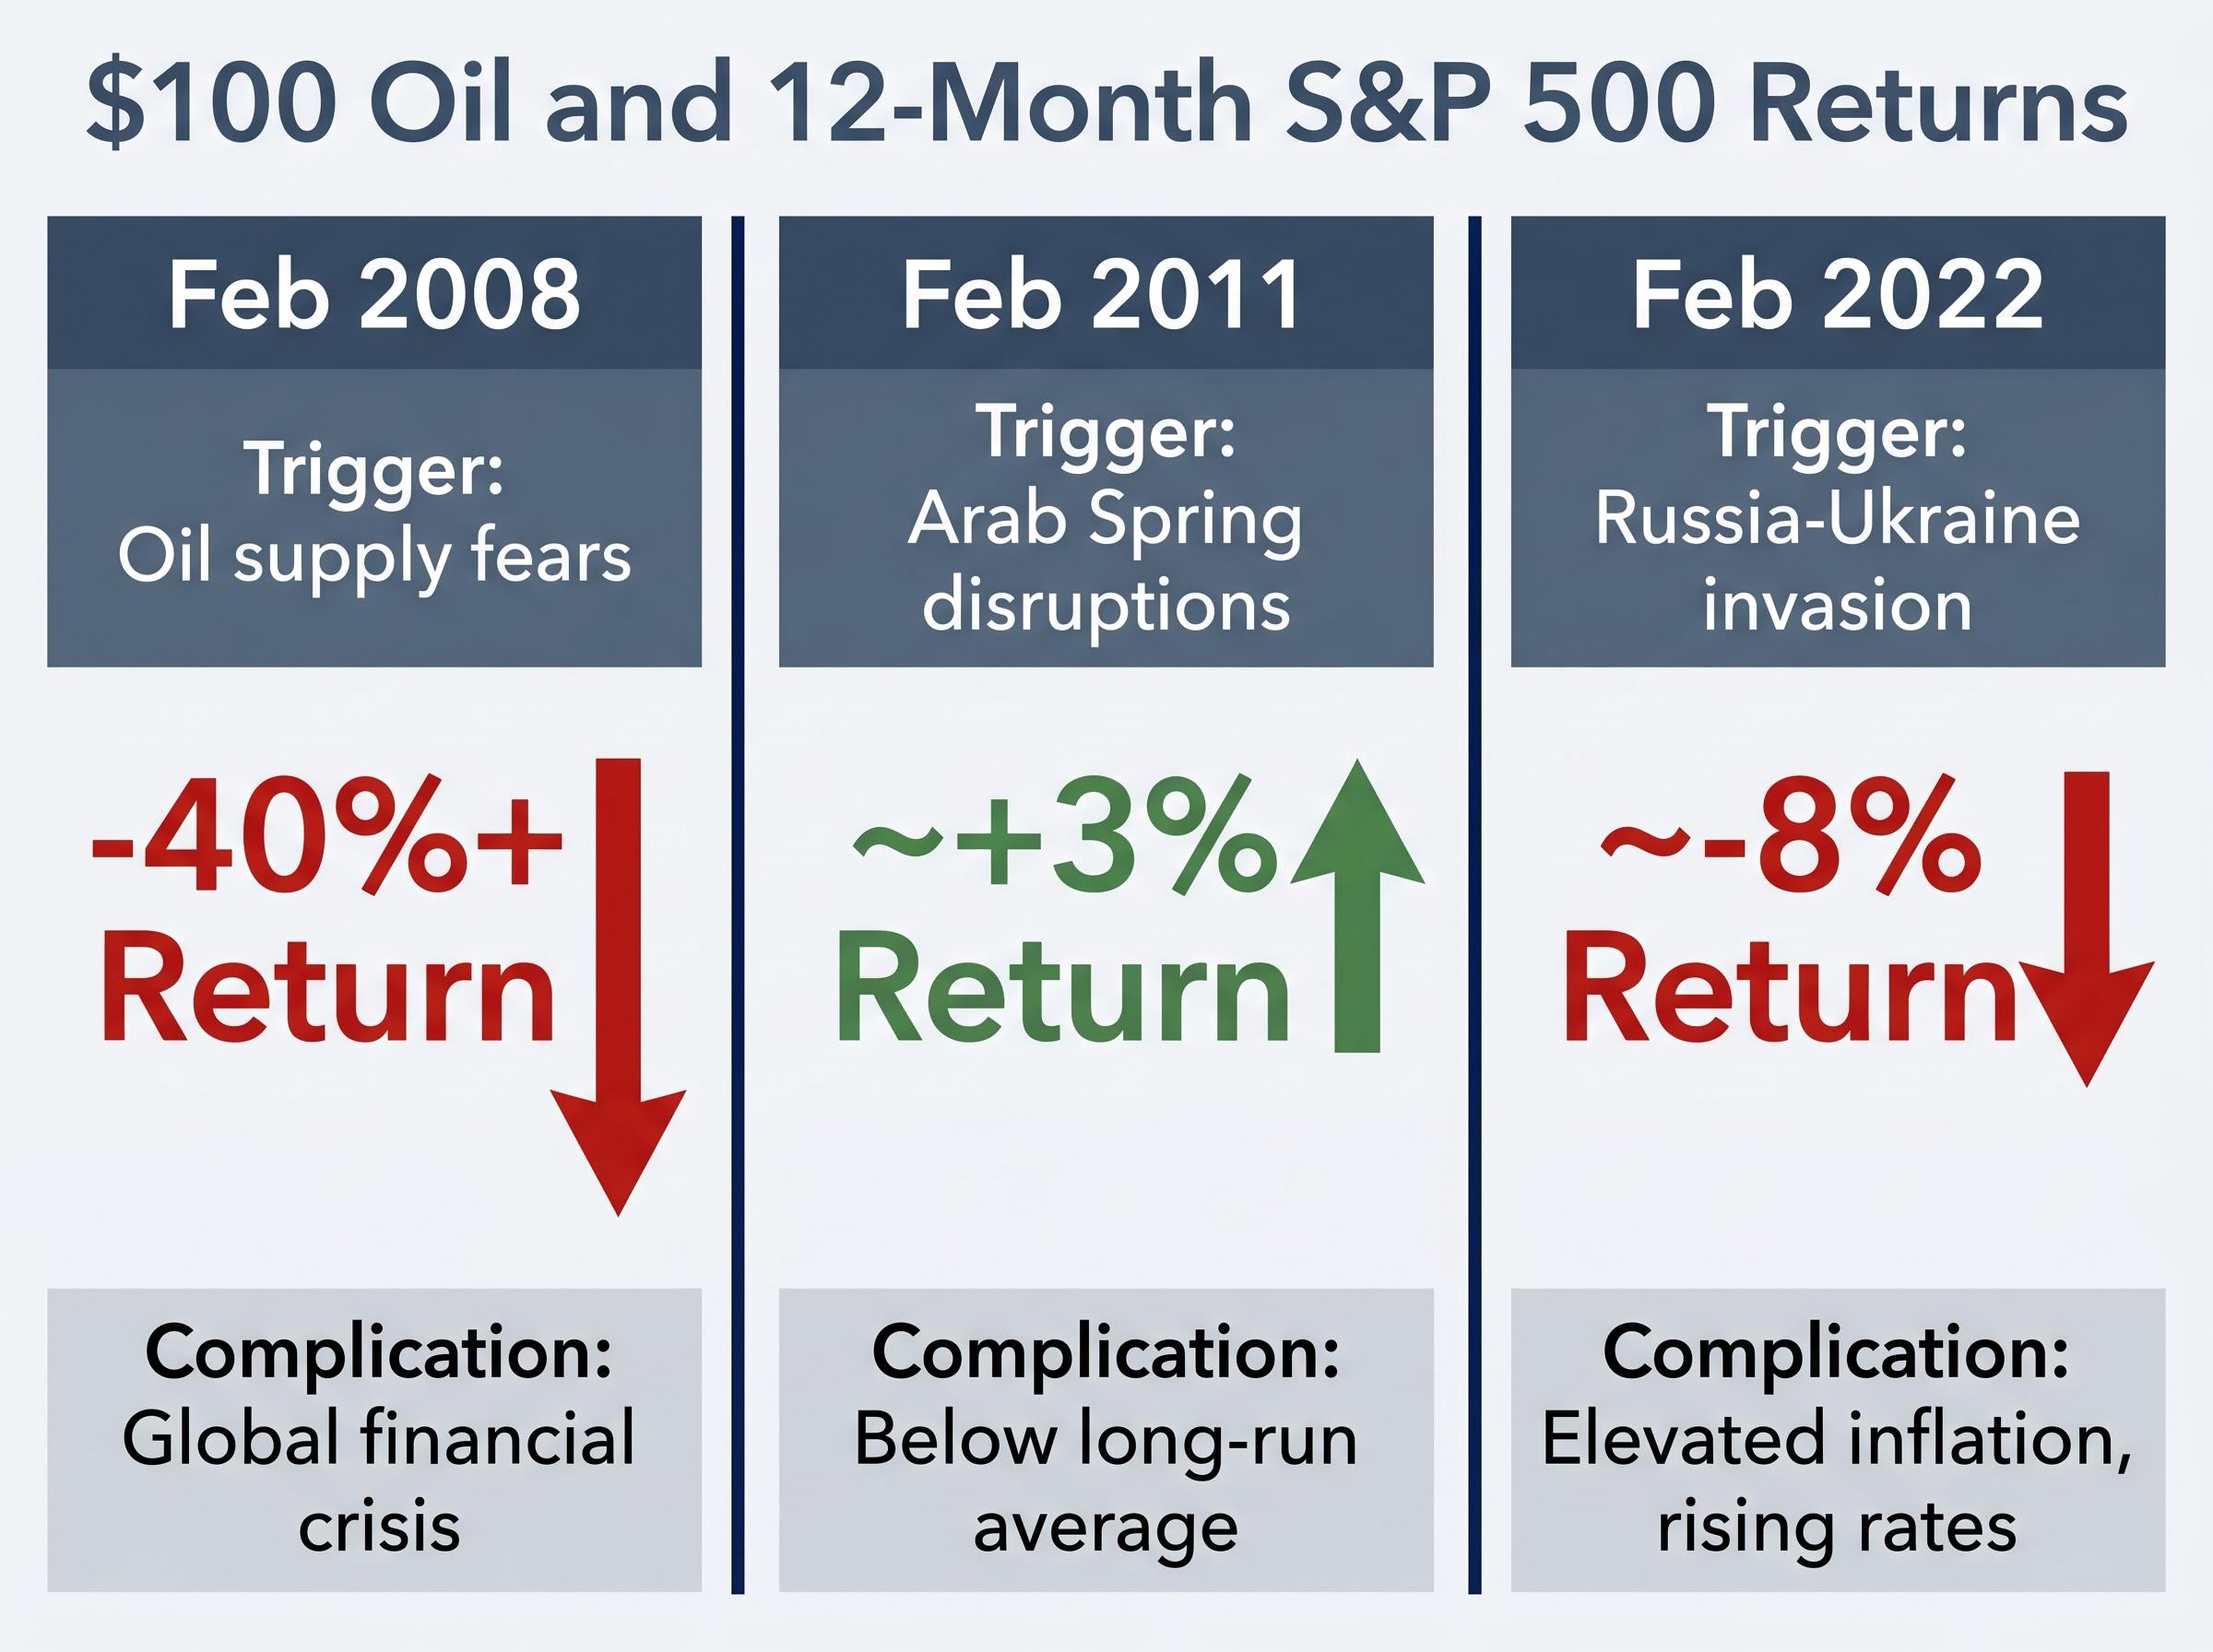
Oil has crossed $100 on three prior occasions. Each produced a different equity outcome, and in none of the three was oil the sole driver.
Thirty years of EIA data on oil price surges and equity returns show that the relationship is less deterministic than headlines suggest: the S&P 500 has averaged an 11% decline in the six months following weeks when gasoline exceeded $4.00 per gallon, but sustained episodes have historically produced drawdowns averaging 41%, making the duration of the shock a more critical variable than the initial price level.
| Date | Geopolitical Trigger | S&P 500 (12-Month Return) | Complicating Factors |
|---|---|---|---|
| February 2008 | Oil supply fears | -40%+ | Global financial crisis |
| February 2011 | Arab Spring disruptions | ~+3% | Below long-run average (~10%) |
| February 2022 | Russia-Ukraine invasion | ~-8% | Elevated inflation, rising rates |
The range is wide: from a 40% decline to a modest positive return. The oil price itself was a contributing factor in each episode, but it did not determine the 12-month equity outcome on its own. The global financial crisis in 2008, the broader inflation and rate-hiking cycle in 2022, and the relatively contained nature of the 2011 disruption all shaped outcomes in ways that the oil price alone could not predict.
The short-term correlation between oil spikes and equity drops is real. The assumption that it translates into reliable long-term causation is not supported by the data.
The 2022 Russia-Ukraine analogue: the closest parallel to today
The February 2022 Russia-Ukraine invasion offers the most instructive recent comparison. The S&P 500 experienced an initial drop of approximately 10% following the invasion, a drawdown remarkably similar in magnitude to the current Iran-driven decline.
For investors who sold into the drop, that 10% loss became realised. For investors who maintained their positions, the subsequent recovery was meaningful. The index absorbed the shock and recalibrated around new energy price assumptions, elevated inflation expectations, and a rising-rate environment.
The parallel is imperfect. The Iran conflict involves a direct closure of a major energy chokepoint, something the Russia-Ukraine war did not produce in the same way. But the broader lesson holds: equity outcomes during geopolitical shocks are multi-factor, and investors who exited during the initial drawdown consistently fared worse than those who stayed the course.
The investment framework that actually works during geopolitical crises
By the time a geopolitical headline reaches a retail investor’s social media feed, the market has already moved. The opportunity that feels available has already been priced. A systematic approach does not rely on that timing; it works regardless of it.
Four major institutional sources, Goldman Sachs, Charles Schwab, Morgan Stanley, and Motley Fool, published strategy guidance during the Iran conflict in early 2026. Their recommendations converge on the same core framework:
- Maintain or establish dollar-cost averaging (DCA) into broad index funds. This is the primary recommendation across all four sources. DCA, the practice of investing a fixed amount at regular intervals regardless of price, removes the timing decision entirely. S&P 500 ETFs and total market ETFs (such as VTI) are the instruments most frequently cited.
- Consider a modest defensive tilt (detailed below).
- Avoid tactical repositioning around individual headlines. The ceasefire rally and its reversal illustrate why. Schwab’s 10 April 2026 analysis specifically warned against market timing around ceasefire or escalation news cycles.
- Consider a robo-advisor if emotional reactivity is a recognised personal risk. Rules-based automated platforms such as Schwab Intelligent Portfolios showed relatively low panic-withdrawal rates during the Iran conflict volatility, consistent with their algorithmic nature.
The dollar-cost averaging data across major global markets reveals a structural tension worth understanding: lump-sum investing outperforms DCA in roughly 68-73% of historical periods because equity markets trend upward, yet DCA’s primary value is not mathematical optimisation but the removal of emotional decision-making at precisely the moments when that decision-making is most costly.
The convergence of these four sources on the same core approach is itself a data point. DCA into diversified index funds is not a generic suggestion; it is the consensus institutional recommendation for retail investors during geopolitical uncertainty.
When a defensive tilt makes sense (and when it does not)
A defensive tilt is a secondary, optional layer for investors already running a solid DCA core. It is not a substitute for a systematic strategy.
Goldman Sachs recommended rebalancing toward inflation protectors with a suggested allocation of 5-10% toward instruments including:
- TIPS (Treasury Inflation-Protected Securities)
- Gold
- Short-duration bonds
- Dividend aristocrats (stocks with long histories of consistent dividend growth)
- Defensive sector ETFs (utilities, consumer staples, defence)
Schwab’s guidance suggested a defensive sector tilt of 10-15% toward gold and energy as a hedge. Motley Fool highlighted defence sector ETF exposure (such as SHLD) via ETF rather than individual stock picking if the conflict appears prolonged.
One caution applies to all of these instruments: entering energy ETFs or defence stocks after the major price moves have already occurred replicates the same timing problem as trading the headlines. A defensive tilt established proactively as part of a portfolio allocation plan is different from a reactive purchase made after reading a headline.
The one question worth asking before you touch your portfolio
Frameworks are useful during calm review sessions. In the moment, when a headline crosses the screen and a portfolio is down 9%, a framework is difficult to recall.
A single question is easier.
“Is what I am about to do consistent with what I planned before this news broke?”
This question works as a filter because it separates two categories of action. Systematic behaviour, such as rebalancing a drift, continuing scheduled DCA contributions, or stress-testing allocation assumptions against adverse scenarios (as SEC investor education guidance recommends), passes the test. Reactive behaviour, such as repositioning because of a headline, does not.
Not all portfolio adjustments during geopolitical crises are reactive. Three types of action remain legitimate:
- Scheduled rebalancing to correct allocation drift caused by market moves
- Continuing planned DCA contributions on their regular schedule
- Stress-testing allocation assumptions against adverse scenarios, including prolonged conflict or sustained oil prices above $100
FINRA guidance emphasises that emotionally-driven trading during periods of market volatility imposes long-term compounding costs that far exceed the short-term discomfort of inaction. Goldman Sachs’s characterisation of “reversal risk,” the pattern of buying rallies on rumour and selling declines on confirmation, describes the precise mechanism by which retail investors convert volatility into realised losses.
FINRA investor guidance on volatility reinforces this point directly, emphasising that emotionally-driven trading during periods of market stress imposes compounding long-term costs that typically exceed the short-term discomfort of holding a position through the drawdown.
The question does not prevent action. It filters out the action that the data says will cost the most.
For readers who want to understand what a second-leg selloff might look like in concrete terms, our full explainer on the Goldman Sachs oil price sell trigger walks through the specific Brent crude threshold that Goldman’s models identify as the S&P 500 inflection point, the current gap between spot prices and that level, and the scenario analysis Goldman and Morgan Stanley have published on sustained Strait of Hormuz closure.
The ceasefire rally is not the trade; patience is
The Iran conflict will continue to generate dramatic short-term market moves. Ceasefire rumours will surface, be denied, resurface, and be partially confirmed. Each cycle will feel like an opportunity. The research consistently shows it is not.
The investors who “missed” the Dow’s 3%+ rally in early April also avoided the subsequent reversal when the ceasefire report was denied. They gave up nothing. The investors who chased it gave up something measurable.
The practical next step is not watching for the next geopolitical development. It is reviewing a current DCA schedule and asset allocation, confirming both are consistent with a plan that existed before the first airstrike landed, and allowing a systematic strategy to do what systematic strategies do: compound through volatility rather than against it.
This article is for informational purposes only and should not be considered financial advice. Investors should conduct their own research and consult with financial professionals before making investment decisions. Past performance does not guarantee future results. Financial projections are subject to market conditions and various risk factors.