
Goldman Sachs Cuts 2026 Smartphone Shipment Forecast 10% on AI Crunch
19 hrs ago

Australian superannuation funds extracted $9.5 billion in fees in the 12 months to June 2025, according to APRA statistics. Yet the number most members see when they check a comparison website reflects only a fraction of what their fund actually costs them. With $4.5 trillion now sitting in the superannuation system as of December 2025, even small embedded cost differentials compound into material differences at retirement. Super Consumers Australia quantified the stakes in November 2025: poorly performing, high-cost products can leave retirees up to $205,000 worse off over a working life. The race to compete on headline fees has intensified the problem by training members to look at the wrong number.
This article explains which costs sit outside standard fee disclosure, how each one works mechanically, and what members can do to find and compare them. By the end, readers will know what questions to ask and where to look before concluding their fund is cheap.
Most members have checked their fees. The administration fee on their annual statement looks reasonable, perhaps 0.2% or 0.3%. The comparison tool on the ATO website confirms it. The assumption that follows is natural: the fund is competitive. The problem is that headline administration fees are what funds compete on and what most comparison tools surface, but they exclude a range of structural costs embedded in fund architecture rather than itemised as charges.
This is not individual fund misconduct. It is a systemic design problem. ASIC’s Regulatory Guide 97 (RG 97) requires certain costs to appear in Product Disclosure Statements (PDSs), but PDS disclosure is not the same as prominent, comparable disclosure. A cost buried on page 47 of a 60-page document does not function as transparency in any practical sense.
Super Consumers Australia research on high-cost super products found that the retirement savings gap between well-structured and poorly structured funds can exceed $205,000 over a working life, a figure that underscores how embedded cost mechanisms, rather than headline fees alone, determine long-run outcomes for members.
The retirement impact of hidden costs Super Consumers Australia research published in November 2025 found that poorly performing, high-cost superannuation products can leave retirees up to $205,000 worse off over a working life compared to better-performing alternatives.
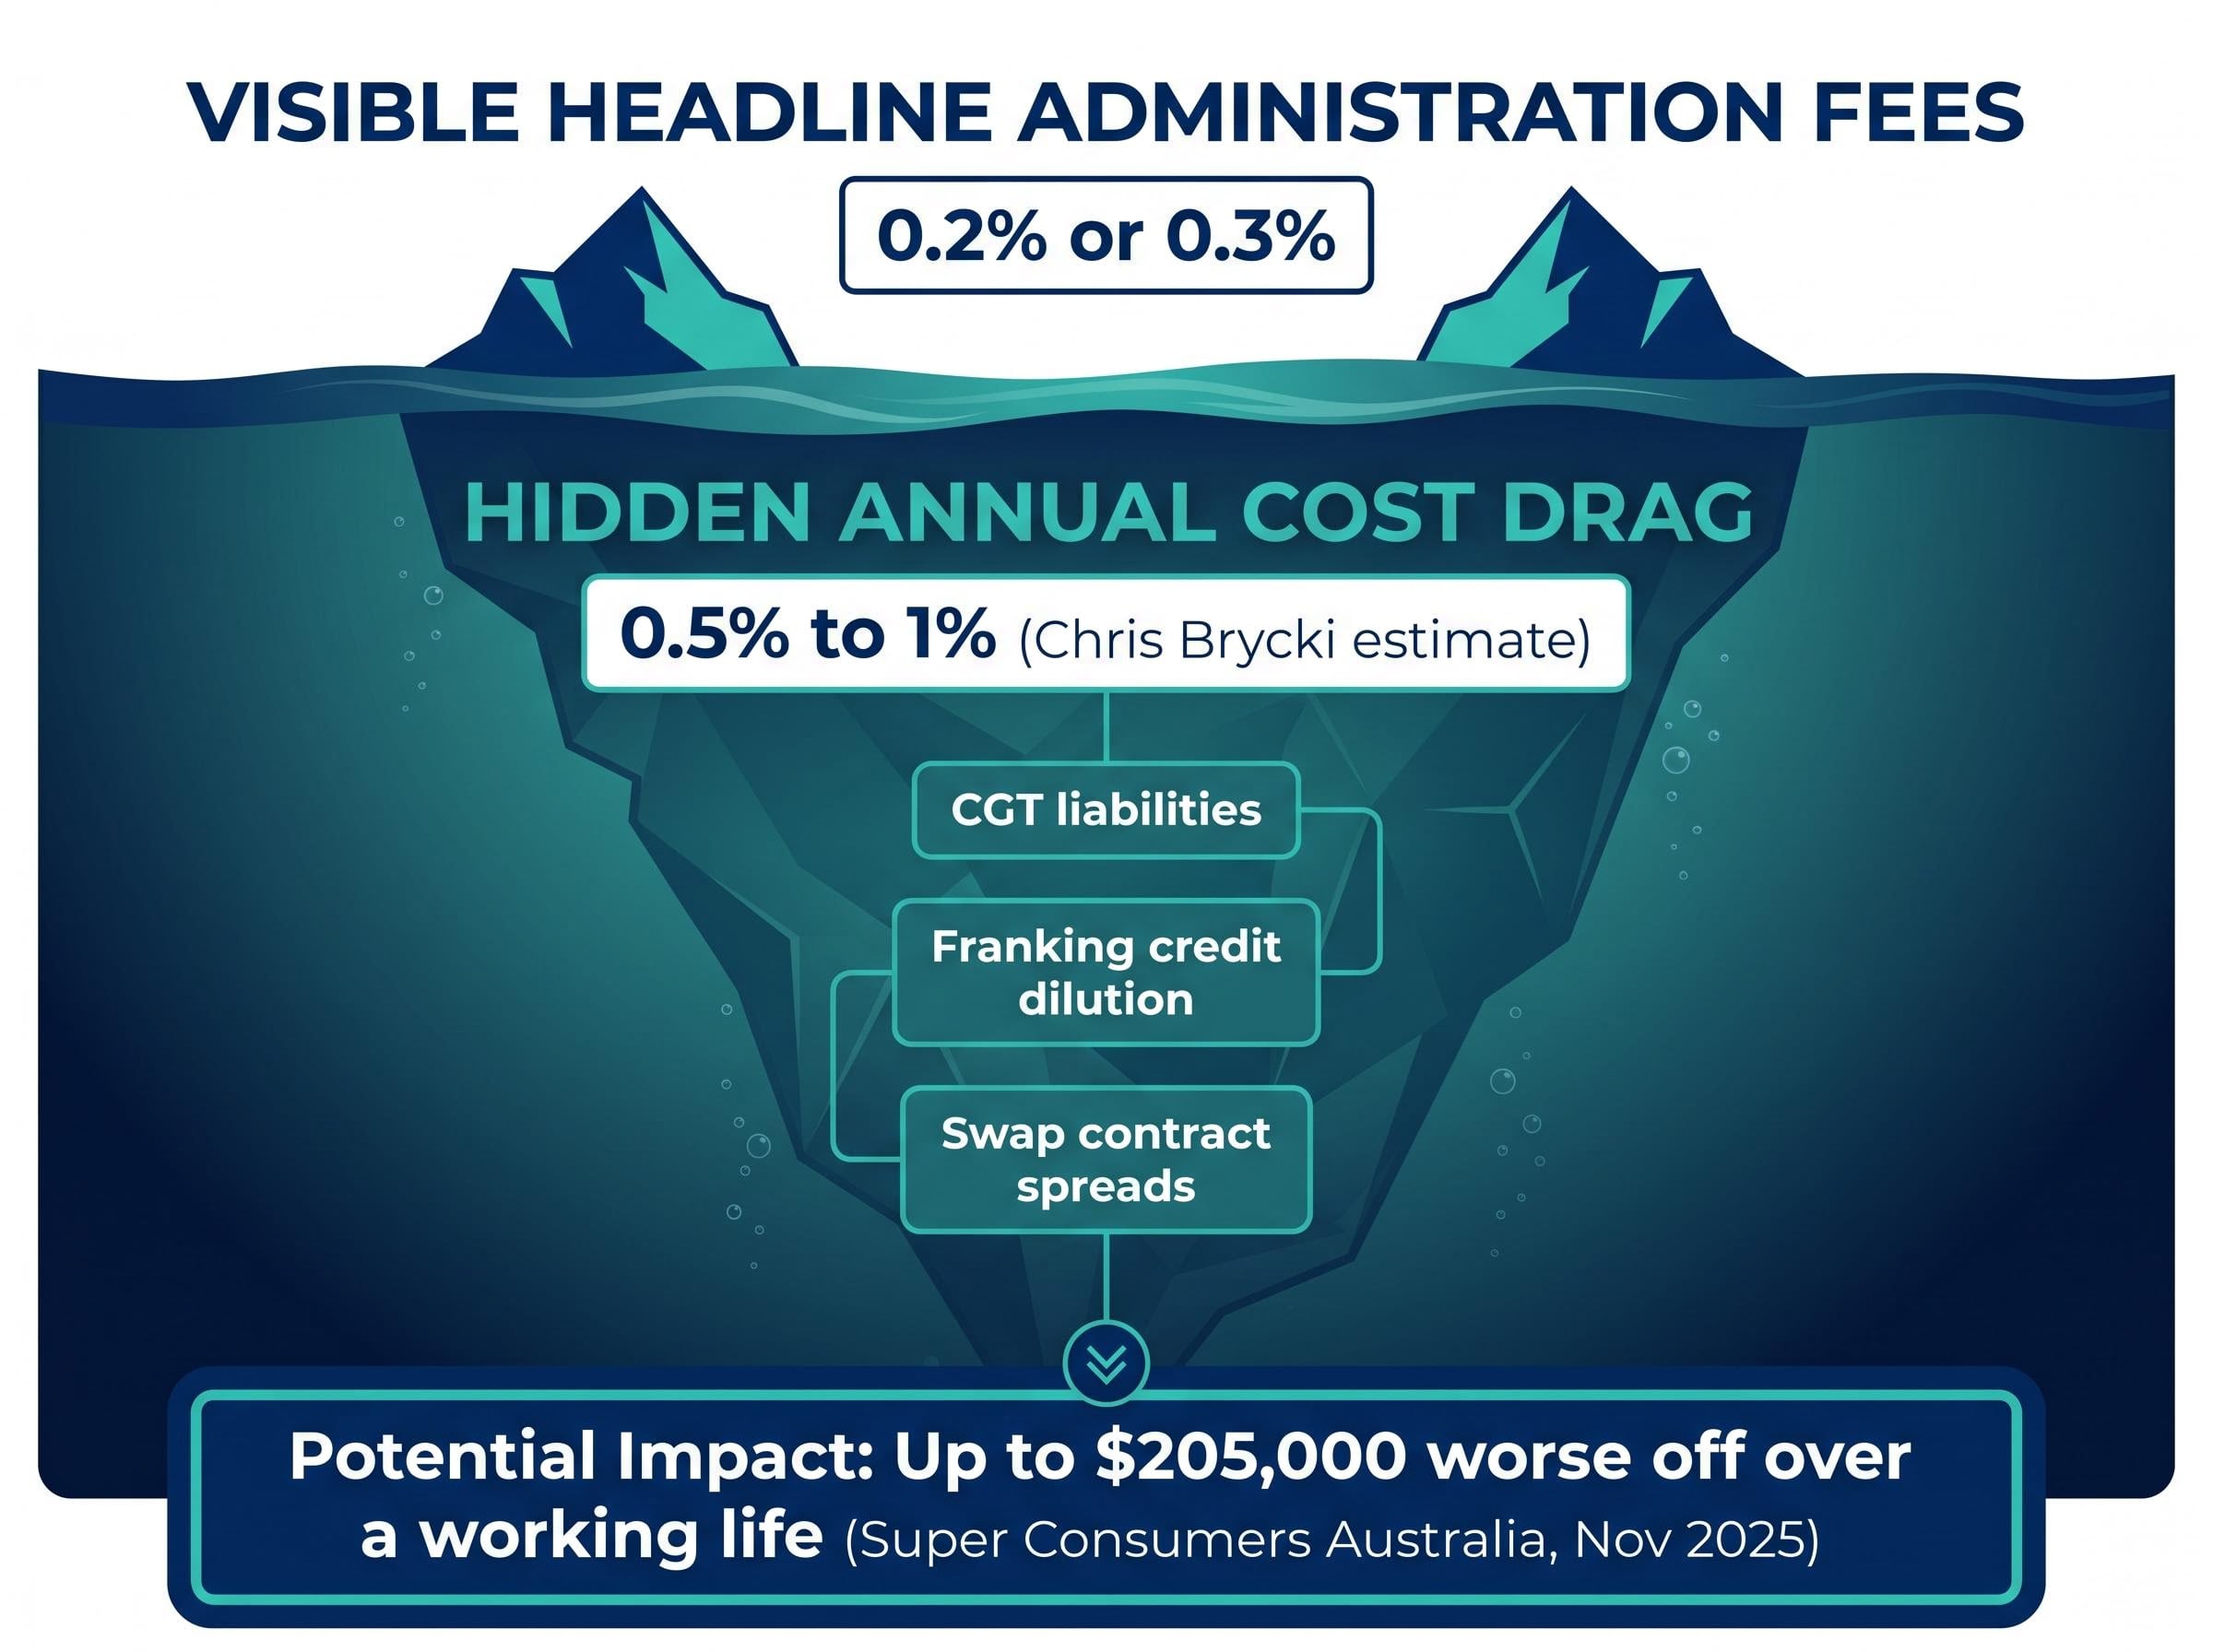
Analysis from Stockspot founder Chris Brycki estimates the annual hidden cost drag at between 0.5% and 1% of a member’s balance, a figure that sits entirely outside the headline fee. The mechanisms behind that drag include:
Each of these mechanisms operates differently. The sections that follow explain how they work, one at a time.
Most large superannuation funds pool all member contributions into shared investment vehicles. A member contributing to a “balanced” option does not own a discrete portfolio of shares; they own units in a trust that holds shares on behalf of every member in that option. This pooled structure creates efficiencies at scale, but it also creates a tax consequence that most members never see.
When a member exits the fund or switches investment options, the fund may need to sell assets to meet the redemption. If those assets have appreciated since the fund purchased them, the sale realises a capital gain. Under pooled trust law, the resulting capital gains tax (CGT) liability is not charged solely to the member who triggered the sale. It is distributed across the remaining members of the pool.
The sequence works as follows:
This cost never appears as a line item in any fee disclosure document. It reduces net returns invisibly over time. A member who has held their fund for 20 years and never switched options may still be absorbing CGT drag generated by high-churn members around them.
Active fund turnover costs, including transaction charges, price impact, cash drag, and mistimed re-entries, compound across a 30-40 year accumulation phase in ways that are structurally similar to CGT drag: they are real economic charges that reduce net returns without appearing as a named line item in any fee schedule.
The compounding dimension matters most. According to Stockspot’s Chris Brycki, accumulated tax drag compounds over multi-decade membership horizons, though no precise annual figure has been published. A member who stays in a high-turnover pool for 30 years absorbs 30 years of other members’ decisions. The longer the membership, the more cumulative drag is absorbed, and the less visible it becomes against a rising balance.
Franked dividends from Australian shares carry imputation credits, a mechanism where the company tax already paid on profits is passed through to shareholders as a credit against their own tax liability. Inside superannuation, where the earnings tax rate is 15%, these credits are particularly valuable: they directly reduce the fund’s tax bill and improve net returns for members.
The value of franking credits is well understood. What is less understood is who actually receives them within a given fund structure.
Franking credit mechanics operate differently depending on the ownership structure of the investment: in pension-phase superannuation, the full 30% franking credit can be received as a cash refund from the ATO, lifting the effective after-tax yield substantially above the face dividend rate, but only where the credit flows directly to the individual member rather than into a pooled trust.
| Feature | Pooled trust structure | Direct platform structure |
|---|---|---|
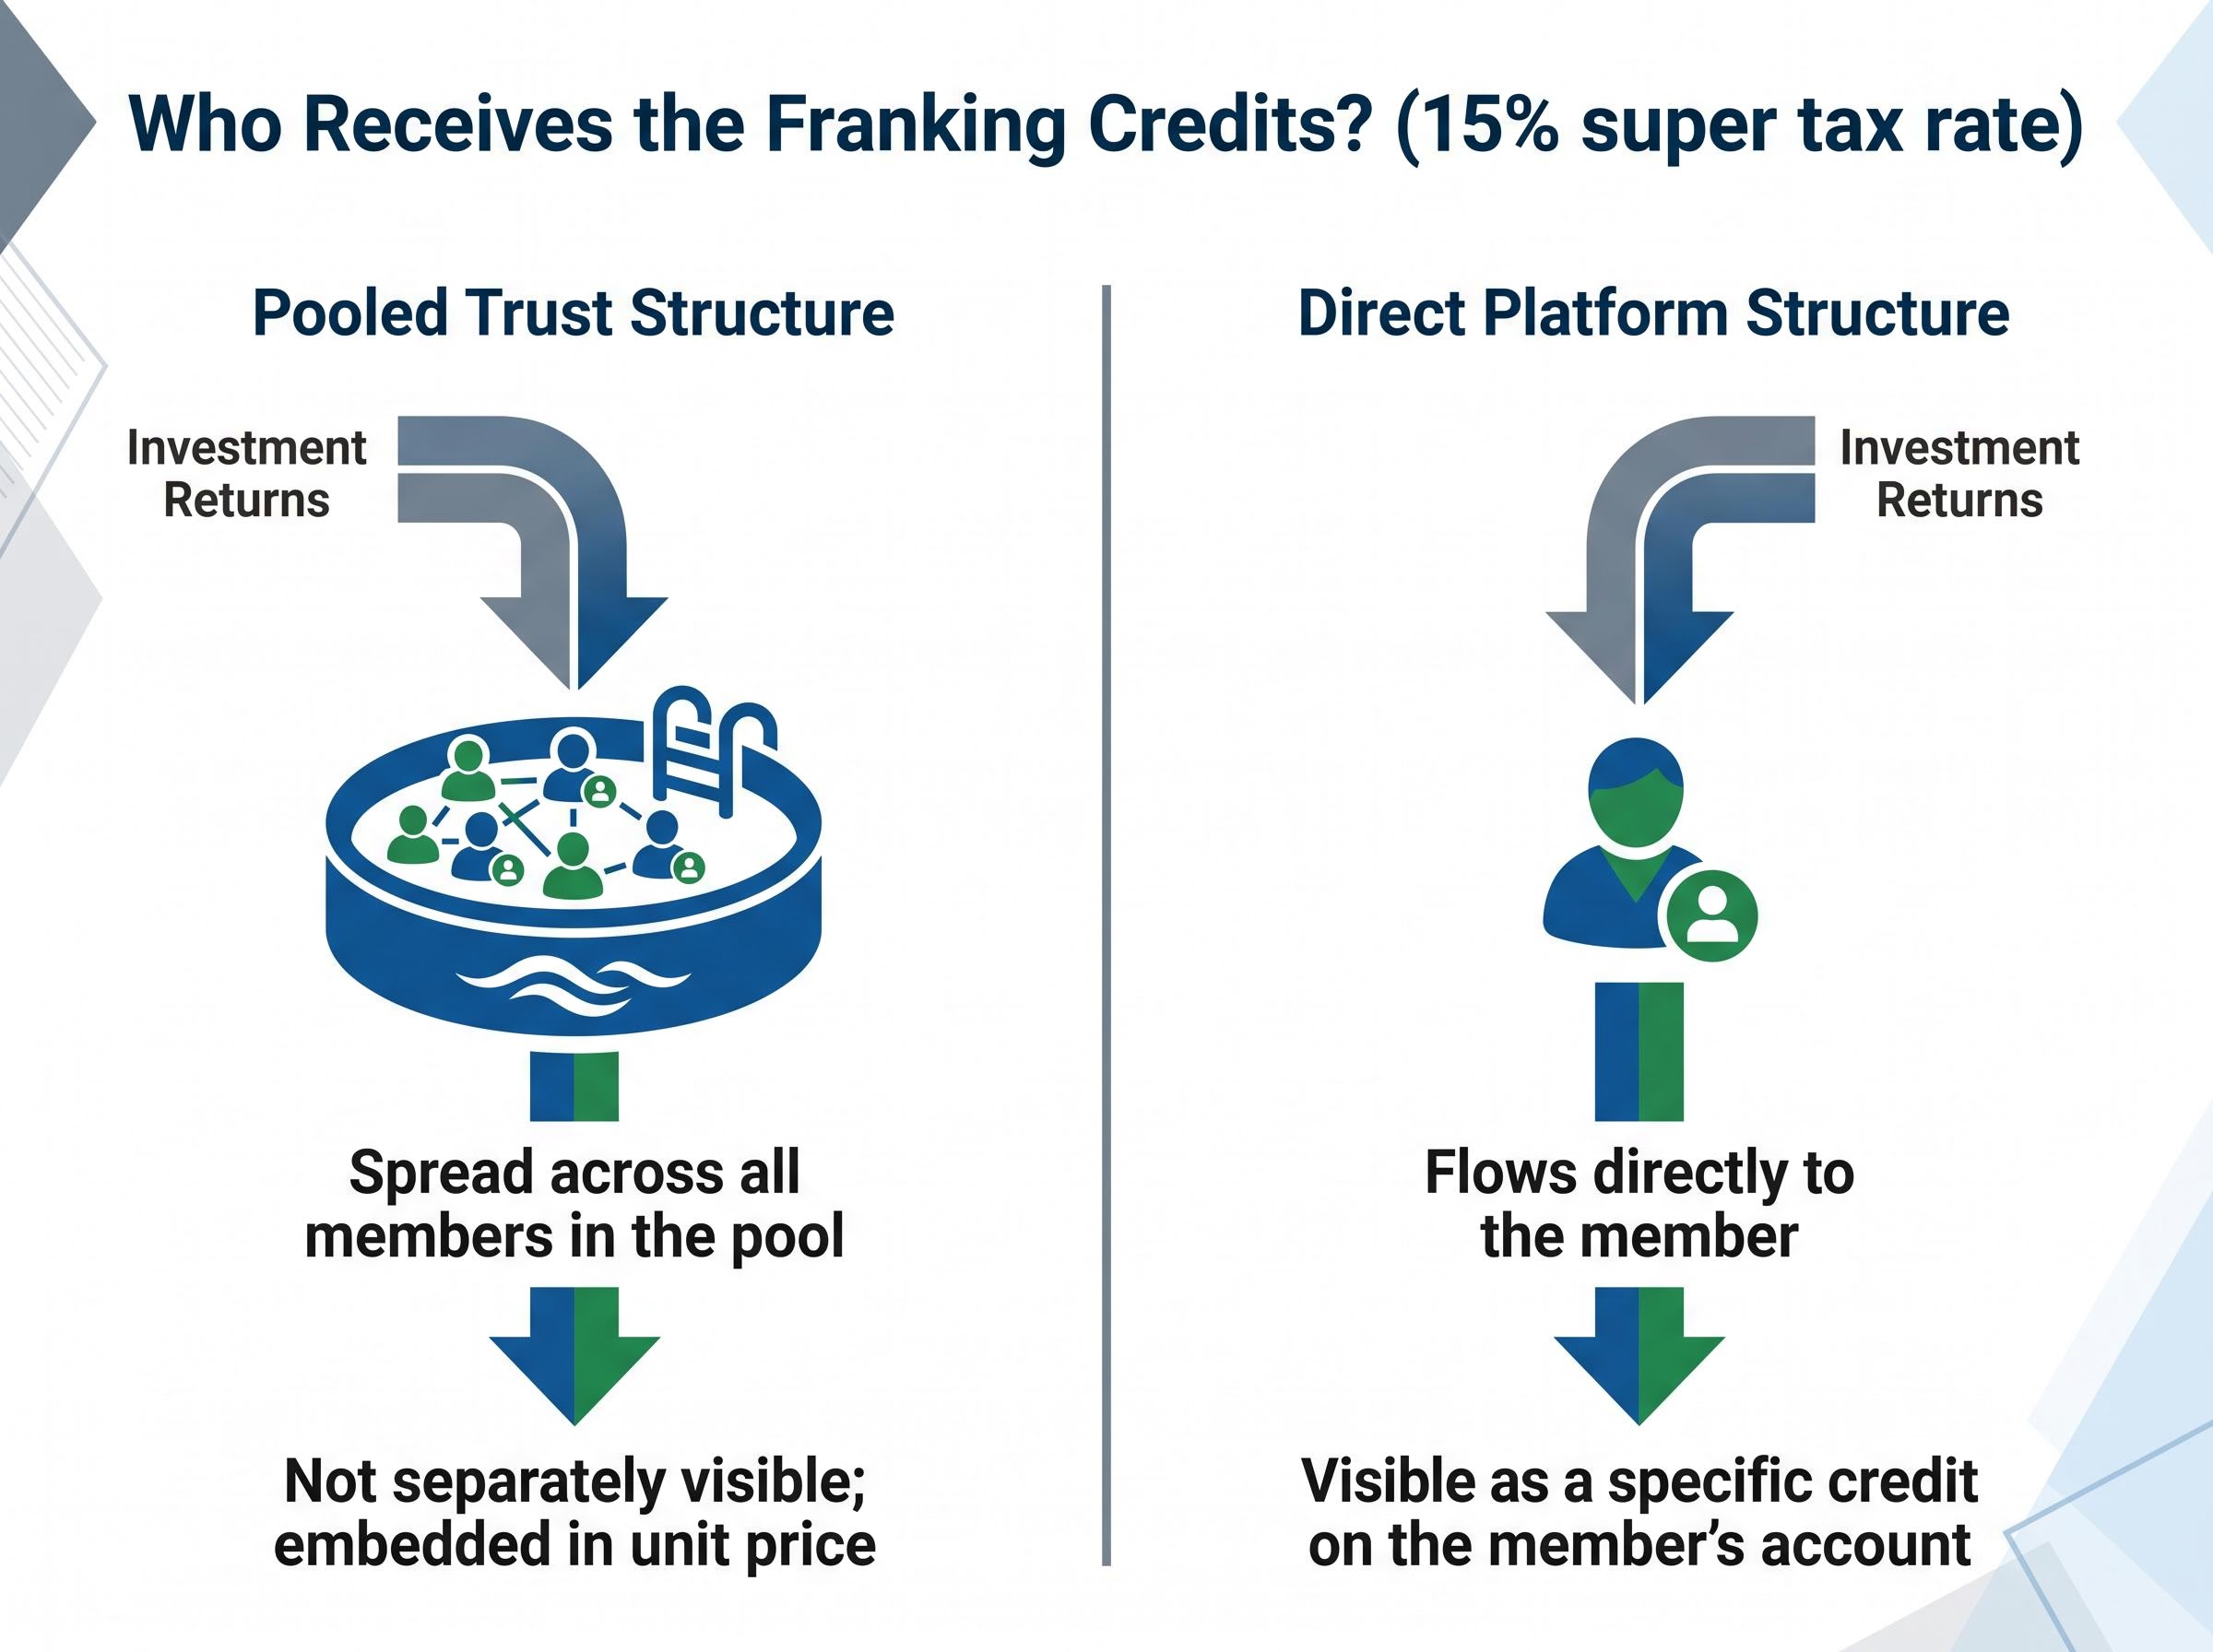
| Who receives the franking credit | The pooled trust entity | The individual member |
| How it is distributed | Spread across all members in the pool, regardless of individual holdings | Flows directly to the member whose holdings generated the dividend |
| Member’s ability to see their individual allocation | Not separately visible; embedded in unit price | Visible as a specific credit on the member’s account |
In a pooled structure, franking credits go into a common pool and are distributed across all members regardless of which individual holdings generated them. In a direct-ownership platform structure, credits flow to the specific member whose portfolio produced the dividend. This structural distinction is absent from standard fee comparison tools and from most product disclosure summaries presented in fund advertising.
Stockspot’s Chris Brycki has noted this allocation difference as one of the structural costs that headline fee comparisons consistently miss. ASIC’s February 2026 proposed amendments to RG 97 include a full review of fee and cost disclosure standards planned for 2026, which may eventually address gaps like this one. Until then, members holding Australian equity options within super are generating franking credits continuously; whether those credits accrue to their own balance or are shared across the fund’s broader membership depends entirely on structural design, not on the advertised fee.
Index options are the go-to choice for cost-conscious super members. The logic is simple: passive tracking of a market index should cost less than active management. In many cases it does. But some super options marketed as low-fee index strategies achieve their market exposure not by directly holding the underlying shares, but through derivative swap contracts with investment banks.
A swap contract works by having the investment bank agree to pay the fund the index return in exchange for a financing rate. The spread between the index return the fund receives and the financing rate the bank charges is a cost embedded in the contract terms. It does not appear as a separate line item in the fund’s disclosed fee schedule.
The stated fee on a swap-based index option may appear lower precisely because the economic cost is inside the swap contract, not visible as a fee line item.
Members selecting swap-based index options face two distinct risks that no published fee comparison captures:
According to Stockspot’s analysis, benchmark disclosure gaps compound this problem further. Some funds do not clearly disclose which index their option tracks, making it difficult for members to verify whether their returns match the benchmark the option is supposedly replicating. A member choosing between two “index” options based on fee alone may not realise that the cheaper-looking option achieves its exposure through a mechanism that adds costs and introduces a form of risk entirely absent from direct-holding alternatives.
Understanding the mechanisms behind hidden costs is only useful if it translates into action. The following four-step sequence provides a practical starting point for any member preparing for their next annual super review:
The annual performance test compares each fund’s net returns against a benchmark that accounts for asset allocation and fees. Funds that fail are required to notify their members in writing. Consistent underperformers are often products where fee drag, including the hidden cost mechanisms described in this article, is a contributing factor. Members of a fund that has failed the test in consecutive years face a direct signal that their retirement savings may be eroding faster than necessary.
For investors who want a structured framework for applying these steps beyond superannuation, our dedicated guide to managed fund due diligence covers PDS section analysis, fee compounding calculations, manager licence verification, and red flag screening across multiple asset classes, with worked examples drawn from recent Australian fund collapses.
Regulatory reform is underway. In February 2026, ASIC proposed amendments to stamp duty and portfolio holdings disclosure requirements for superannuation funds, including averaging stamp duty costs over seven years to improve comparability. A full review of RG 97 is planned for 2026, and industry bodies including SMC Australia have welcomed the consultation process.
Neither reform has yet changed what members can currently see. The proposed changes address specific disclosure gaps, but their scope does not extend to all the structural cost mechanisms covered in this article:
Competitive pressure to advertise low fees has created an incentive structure where funds reduce fee visibility rather than genuinely reduce costs. As The Australian noted in March 2026, the race for lower headline super fees is masking the real cost to retirement savings. This dynamic will persist until disclosure rules are standardised and enforced.
Grattan Institute analysis of superannuation fee drag demonstrates how even small annual cost differentials, compounding across a 30-40 year accumulation period, produce retirement balance outcomes that differ by tens of thousands of dollars, providing the mathematical foundation for why the distinction between visible and embedded costs matters at the scale of the current $4.5 trillion system.
A hidden annual cost of 0.5% to 1%, left unaddressed over a 30-year working life, accumulates silently and leaves little room for correction once the damage becomes visible at retirement.
Compounding inside tax-advantaged accounts amplifies both the gains from good fund selection and the losses from hidden cost drag: a 0.5% annual fee difference that appears immaterial in year one becomes a five-figure divergence by year twenty, which is why the structural cost mechanisms described in this article carry disproportionate weight for members with long accumulation horizons ahead of them.
The most valuable moment to understand these costs is now, not after regulatory reform eventually arrives. Every year of inaction allows the compounding to continue.
The fee number on a comparison tool reflects a narrow subset of what a superannuation fund actually costs. Members who treat it as the complete picture are comparing funds on incomplete information. The three structural mechanisms covered in this article, CGT drag in pooled trusts, franking credit allocation differences, and swap-based index costs, are not captured by the ATO YourSuper tool’s fee display without additional investigation.
Two steps represent the minimum due diligence before concluding a fund is working efficiently: reading the PDS for indirect cost ratios and checking the fund’s APRA performance test result. These are available now, free, and take less than an hour.
Regulatory reform is underway and may eventually close the disclosure gap. Members cannot afford to wait for it. The compounding damage from hidden costs runs continuously, regardless of when better rules arrive.
This article is for informational purposes only and should not be considered financial advice. Investors should conduct their own research and consult with financial professionals before making investment decisions.
Hidden superannuation fees are structural costs embedded in fund architecture that do not appear as named line items in standard fee disclosures, including CGT liabilities from pooled trust structures, franking credit dilution, and financing spreads inside swap-based index options. Stockspot estimates these can add between 0.5% and 1% in annual cost drag on top of the headline administration fee, compounding significantly over a 30-40 year accumulation period.
When a member exits a pooled super fund, the fund may sell appreciated assets to meet the redemption, realising a capital gain taxed at the 15% super earnings rate, and that tax liability is then distributed across all remaining members in the pool, not just the member who triggered the sale. This means long-term members who have never switched options can still absorb tax drag generated by other members' decisions over many years.
You can read your fund's Product Disclosure Statement and look specifically for the fees and costs summary and the additional explanation of fees and costs sections, which must disclose indirect cost ratios, buy/sell spreads, and performance fees under ASIC's RG 97 framework. You can also compare net returns using the ATO YourSuper comparison tool and check your fund's APRA annual performance test result, published each August.
Not always, because some super options marketed as low-fee index strategies achieve market exposure through derivative swap contracts with investment banks rather than by directly holding the underlying shares. The financing spread embedded in those swap contracts is a real economic cost to members that does not appear as a separate line item in the fund's disclosed fee schedule.
APRA published the 2025 performance test results on 29 August 2025, and seven funds failed the test. Funds that fail are required to notify their members in writing, and consistent underperformers are often products where fee drag, including hidden structural costs, is a contributing factor.