
US-Iran Framework Sends Nasdaq Futures Up 1.4%, Brent Below $100
1 hr ago


Westpac declared a fully franked interim dividend of 77 cents per share alongside a $3.4 billion statutory net profit on 5 May 2026, the same day the Reserve Bank of Australia lifted the cash rate by 25 basis points to 4.35%. The simultaneous release of a major bank earnings result and a rate decision created an unusually charged session for ASX investors. With the ex-dividend date falling on 8 May 2026, income-focused shareholders face an immediate decision, while the broader result raises questions about whether Westpac’s earnings trajectory can withstand a tightening margin environment. What follows is a breakdown of the dividend mechanics, peer comparison, earnings drivers, capital position, and market reaction that together define Westpac’s investment case after these results.
The headline number for income investors is straightforward: Westpac will pay 77 cents per share, fully franked, with a payout ratio of 77.1%. For Australian resident investors in taxable accounts, full franking means the attached tax credits can offset personal income tax liabilities, making the effective yield materially higher than an equivalent unfranked payment.
The grossed-up dividend calculation for a fully franked payment applies the standard 30/70 formula: a 77-cent cash dividend carries an attached franking credit of approximately 33 cents, lifting the gross value to roughly $1.10 for eligible investors before any tax offset is applied.
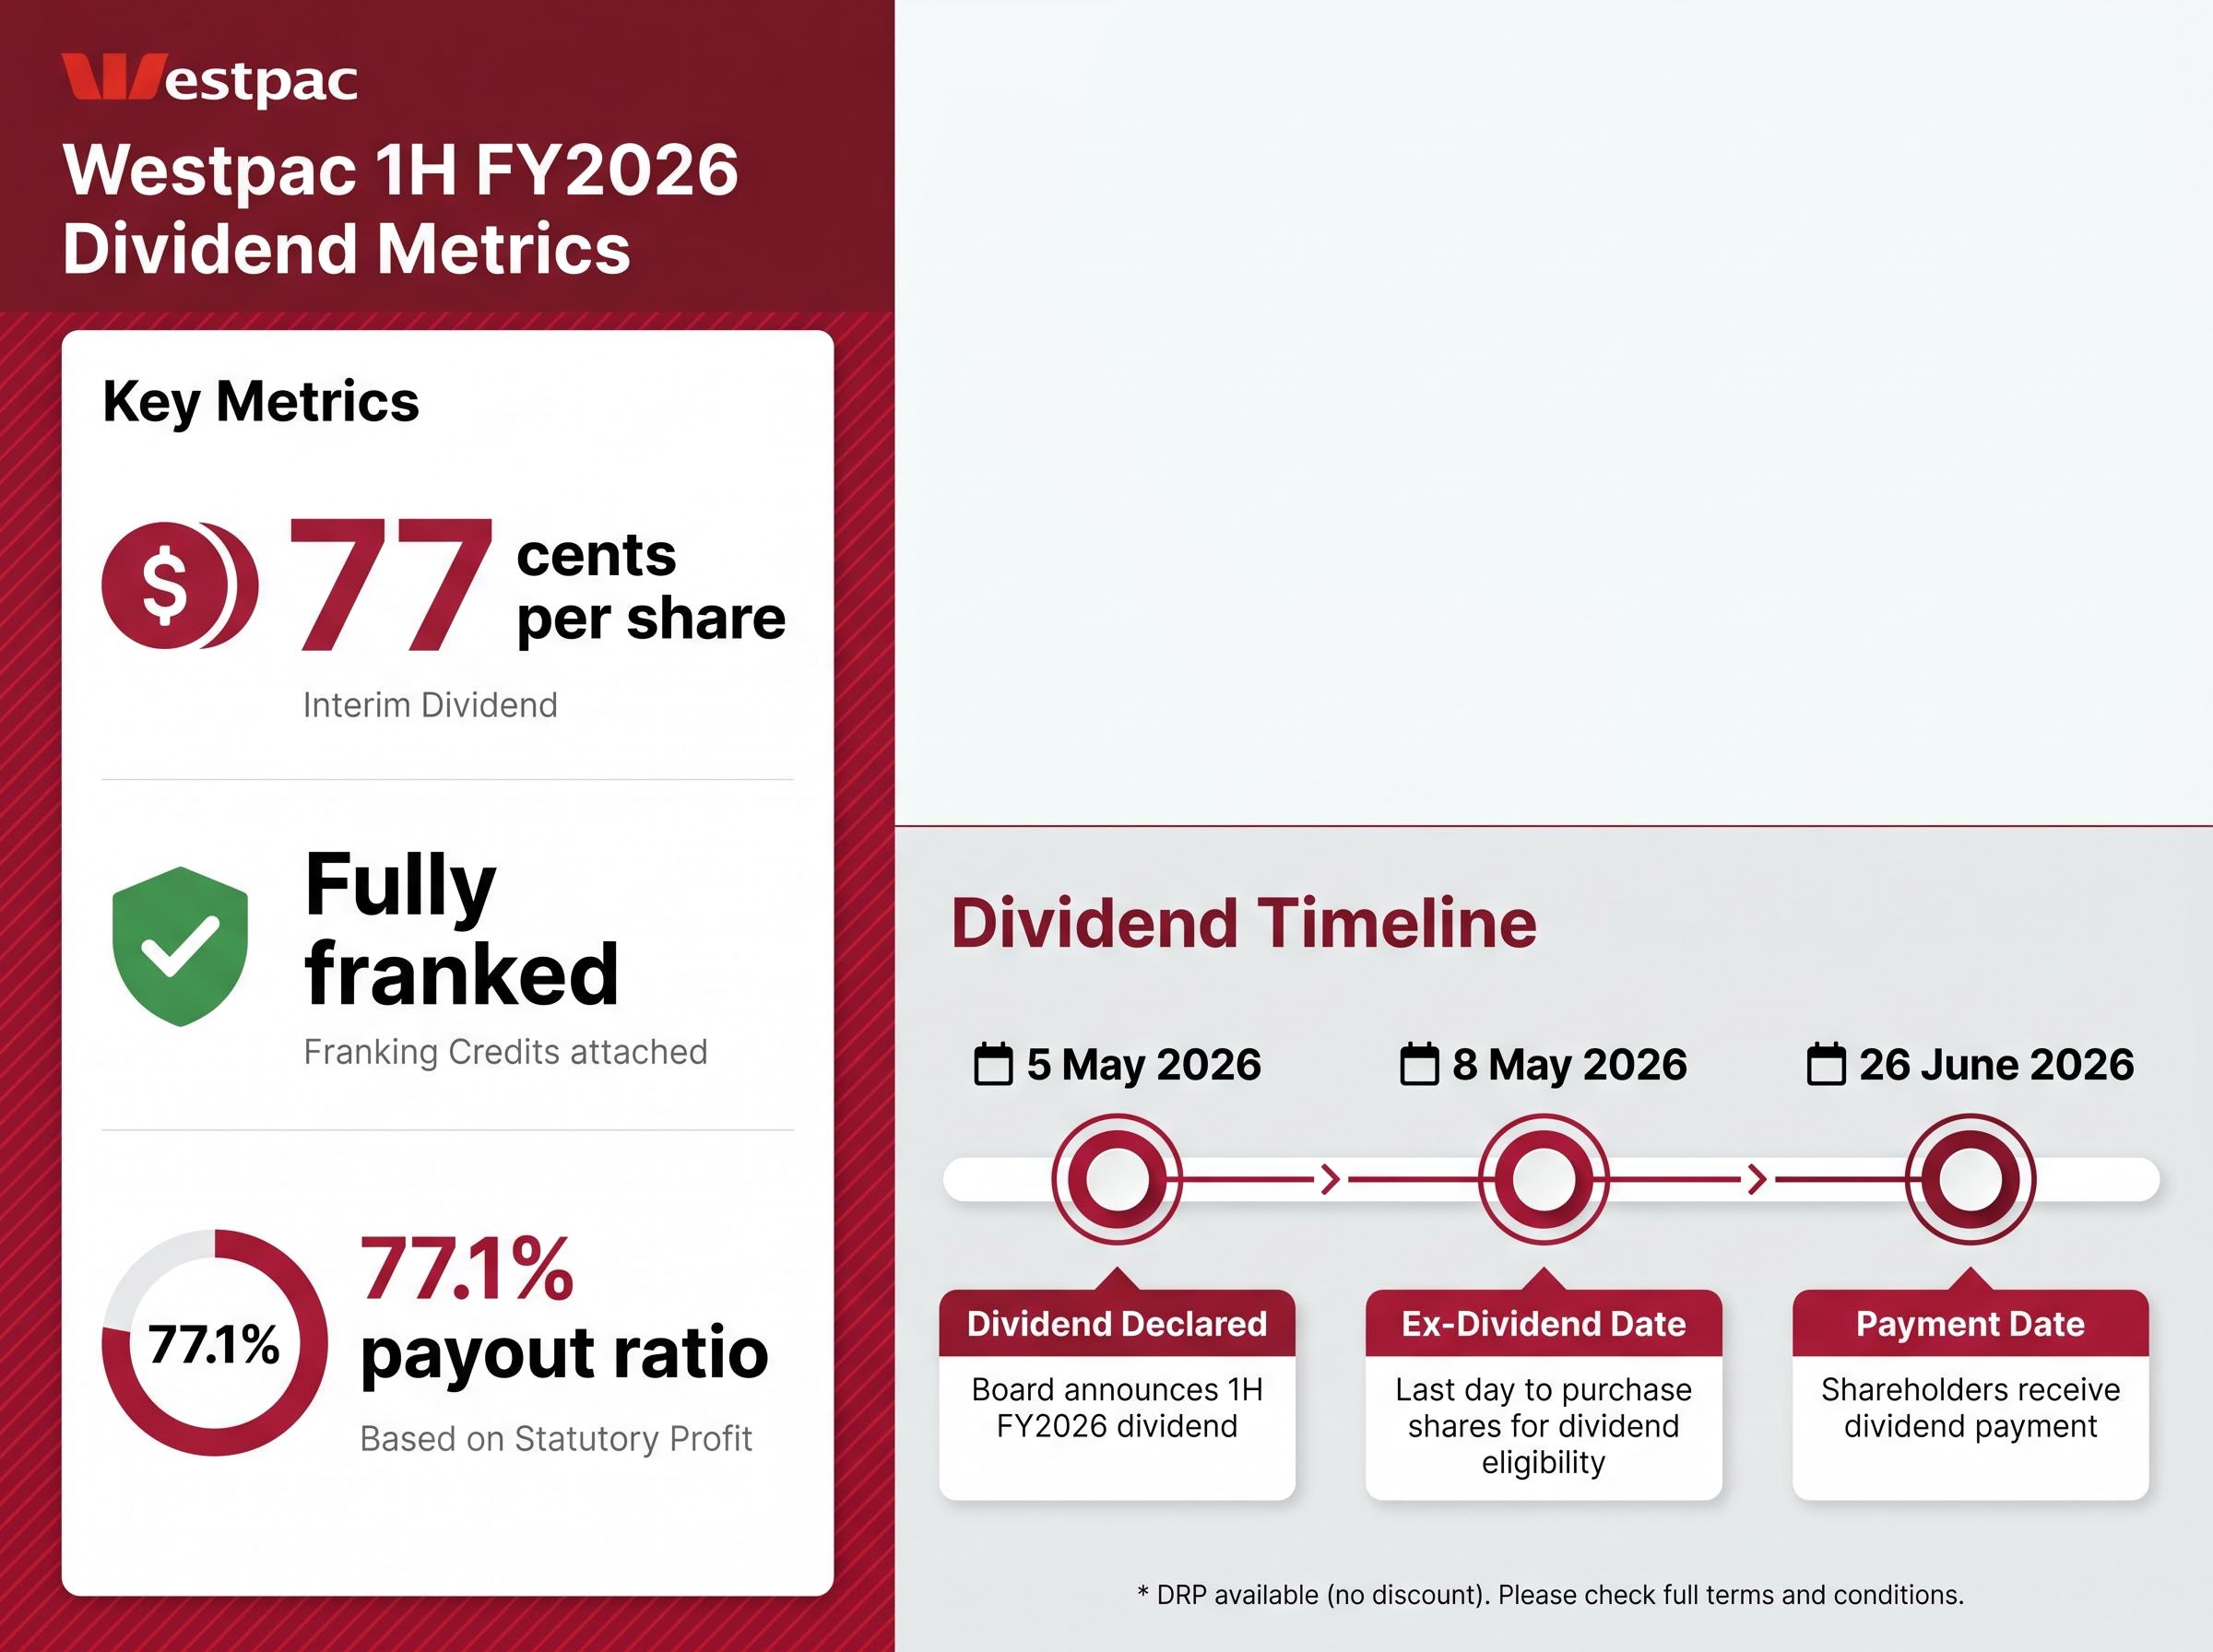
The key dates are as follows:
Investors purchasing Westpac shares on or after 8 May 2026 will not be entitled to receive the interim dividend. To qualify, shares must be held before the ex-dividend date.
Westpac’s dividend reinvestment plan (DRP) is available for this payment, though no discount applies to shares issued under the plan. This contrasts with NAB, which has historically offered a DRP discount on selected payments. For shareholders deciding between cash and reinvestment, the absence of a discount removes one incentive to participate, though the DRP still provides a mechanism for compounding without brokerage costs.
Across Australia’s four major banks, the 1H FY2026 interim dividends vary not only in dollar terms but in franking status, a distinction that carries real after-tax consequences for domestic shareholders.
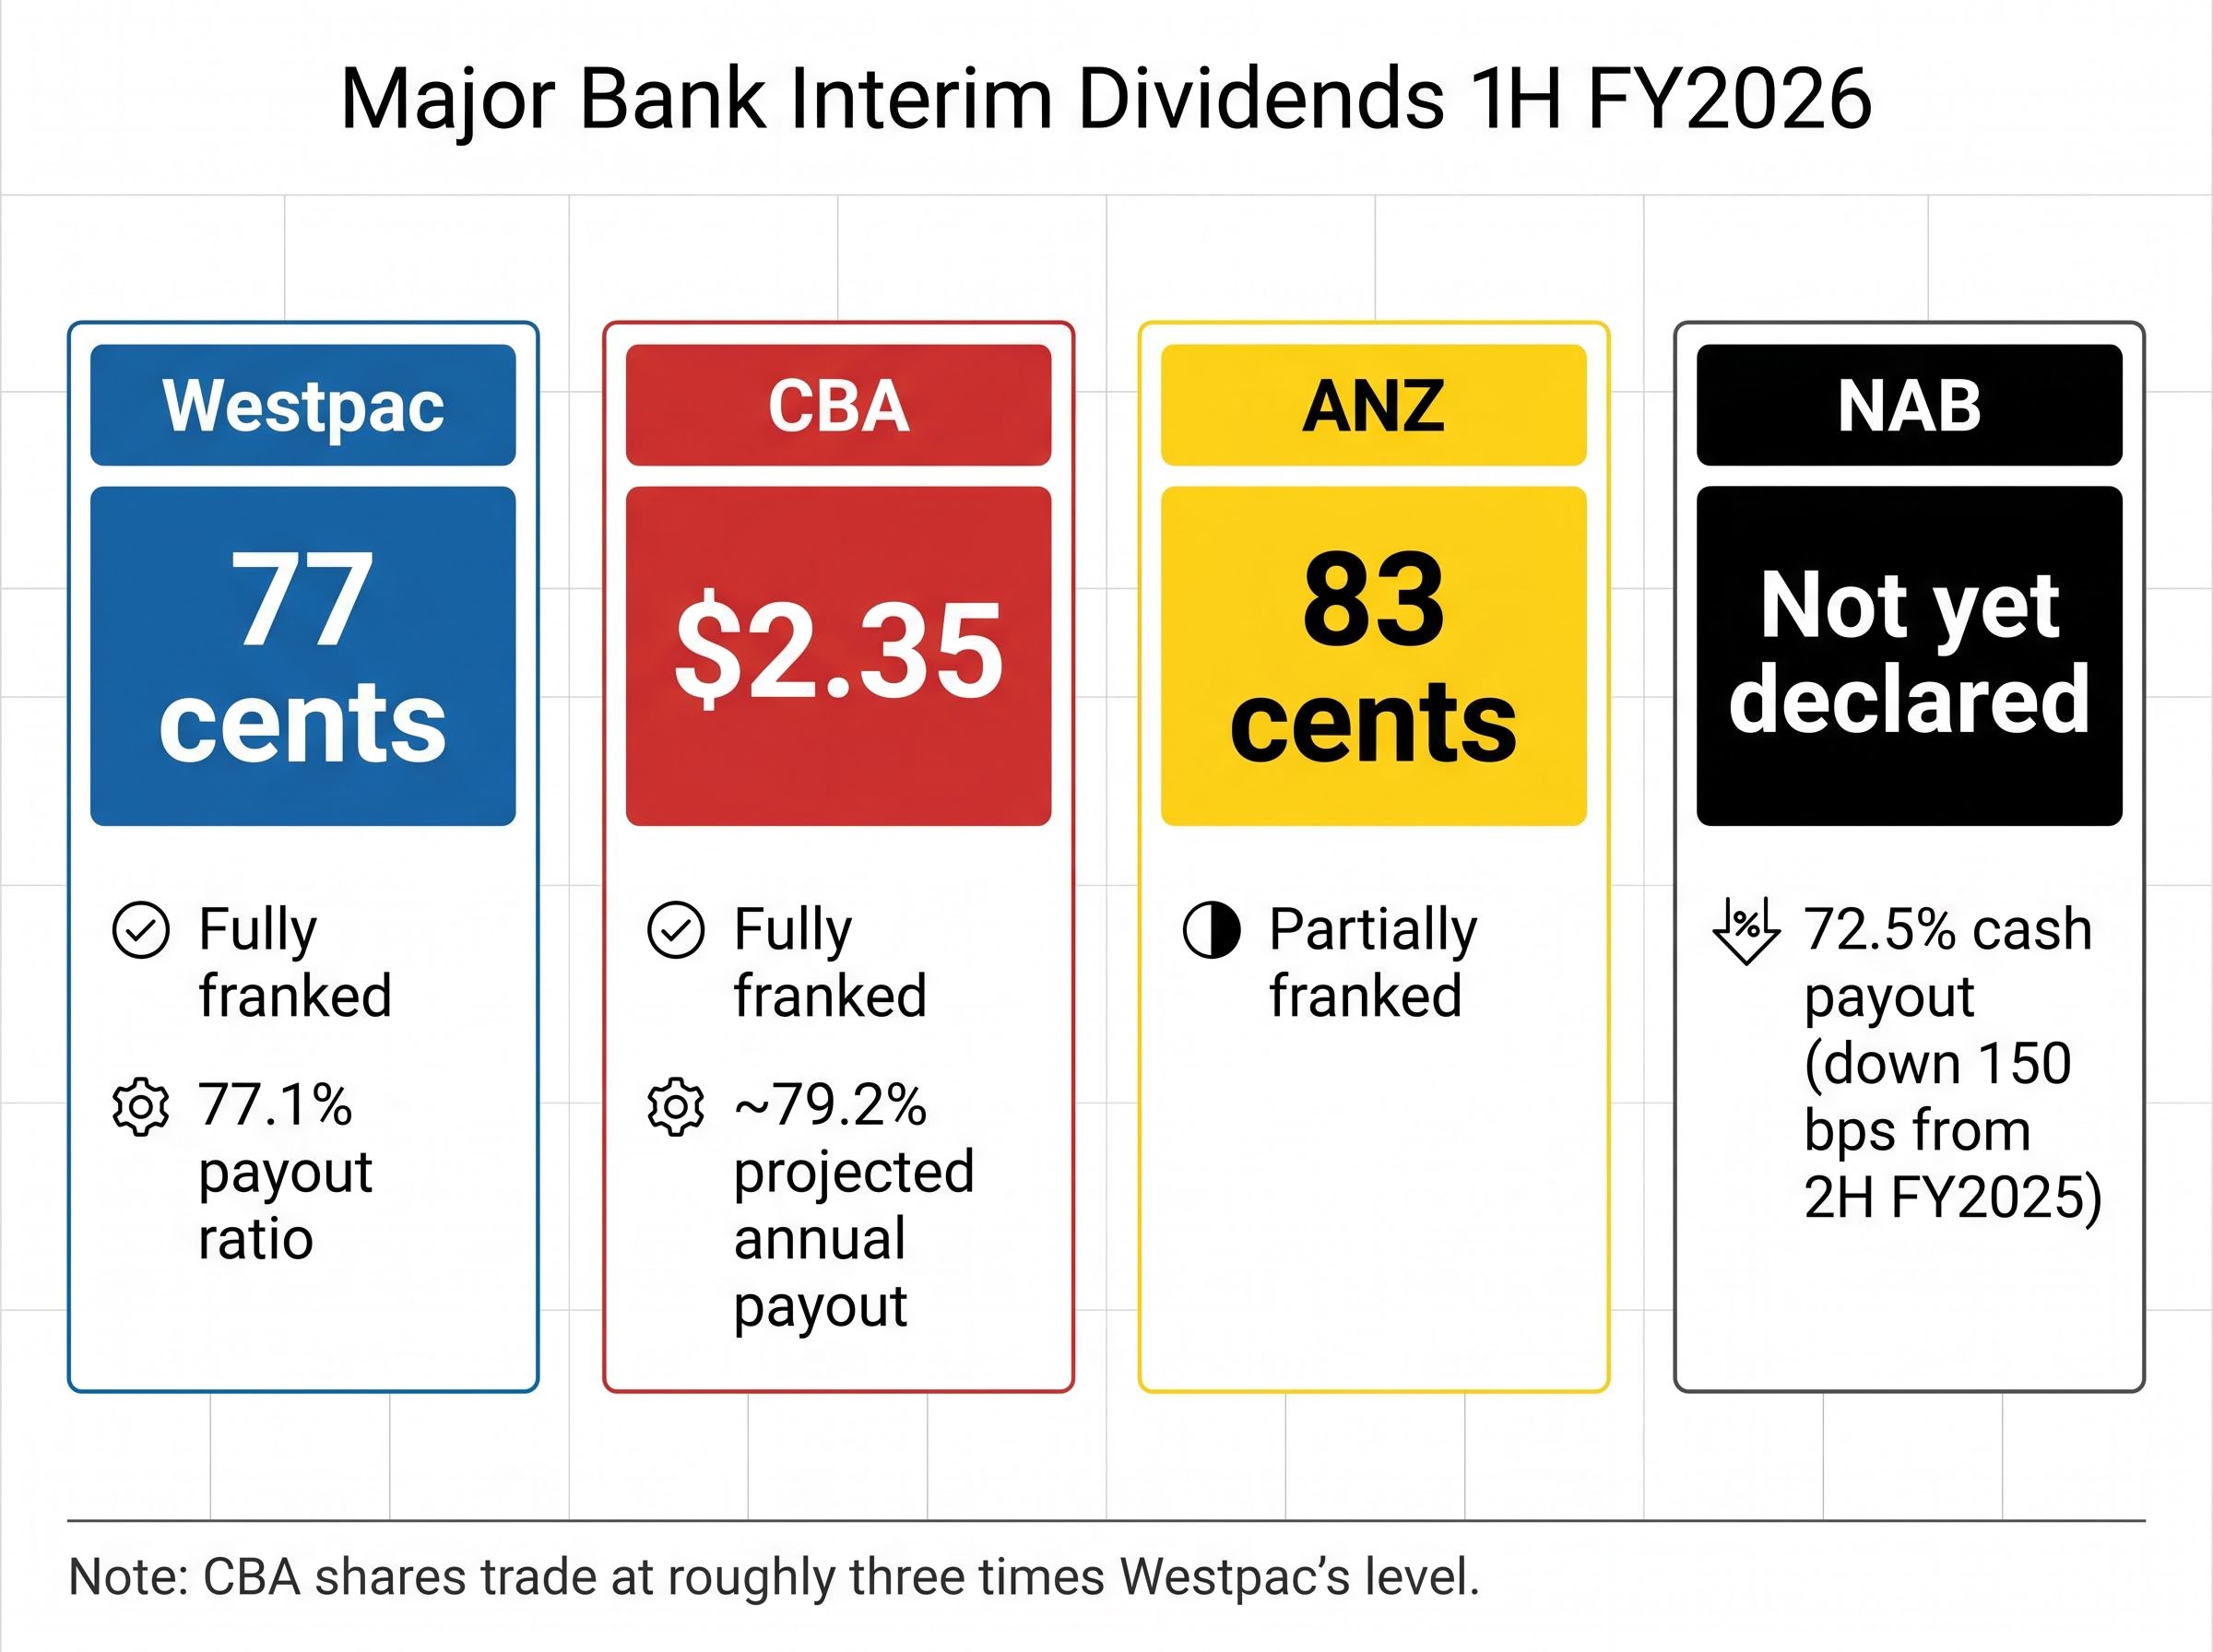
| Bank | Interim Dividend | Franking Status | Payout Context |
|---|---|---|---|
| Westpac | 77 cents | Fully franked | Payout ratio 77.1% |
| CBA | $2.35 | Fully franked | Projected annual payout ratio ~79.2% |
| ANZ | 83 cents | Partially franked | Partial franking reduces effective tax credit |
| NAB | Not yet declared | N/A | Cash dividend payout ratio 72.5%, down 150 bps from 2H FY2025 |
CBA’s significantly higher absolute dollar figure reflects its share price base, which trades at roughly three times Westpac’s level. Direct dollar-to-dollar comparisons across the two are misleading without adjusting for that difference. Yield and payout ratio provide a more useful basis for comparison.
ANZ’s partial franking is the standout divergence. For an Australian resident investor in the top marginal tax bracket, a fully franked dividend carries a franking credit worth approximately 30% of the gross dividend amount. That credit is unavailable, or only partially available, on ANZ’s payment, narrowing the after-tax gap between ANZ’s nominally higher 83 cents and Westpac’s 77 cents.
A franking-adjusted yield comparison across the Big Four shows why ANZ’s nominally higher 83-cent interim sits closer to Westpac’s 77-cent payment than the raw figures imply: once ANZ’s partial franking is accounted for, the after-tax income gap narrows significantly for investors in mid-to-high marginal tax brackets.
Westpac’s profit was built on volume rather than windfall. Mortgage growth came in at 1.2 times the system rate (excluding RAMS), signalling that the bank gained share in a competitive home loan market during the half. Business lending rose 16%, the strongest growth rate across Westpac’s divisional segments and evidence that the commercial banking franchise is contributing beyond the mortgage book.
Total lending and deposit growth reached 7% year-on-year. Return on equity came in at 9.6%.
The key financial metrics from the half:
Against analyst consensus of $3.47 billion, the adjusted net profit of $3.5 billion represented a modest miss, though the gap was narrow enough that the market treated the result as broadly in line.
The difference between the $3.4 billion statutory figure and the $3.5 billion adjusted figure reflects the exclusion of notable items, which are one-off or irregular charges that analysts strip out to assess underlying performance. The adjusted figure is the benchmark most broker research uses for consensus comparison.
Operating costs fell relative to 2H FY2025, a continuation of Westpac’s multi-year efficiency programme. The cost reductions contributed directly to the adjusted result and helped offset the pressure from a competitive lending environment where margins are under strain.
Westpac reported a Common Equity Tier 1 (CET1) capital ratio of 12.4%, sitting 115 basis points above its own internal target of 11.25% under normal operating conditions.
CET1 capital is the highest-quality form of a bank’s reserves: predominantly shareholders’ equity and retained earnings, after regulatory deductions. Regulators require banks to hold minimum CET1 ratios to ensure they can absorb losses during periods of stress without becoming insolvent. A bank’s internal target typically sits above the regulatory minimum to provide an additional buffer.
APRA’s capital adequacy standard APS 110 sets the minimum CET1 requirements that Australian authorised deposit-taking institutions must meet, with Westpac’s reported 12.4% ratio sitting well clear of the regulatory floor and its own internal target of 11.25%.
Westpac’s CET1 ratio of 12.4% sits approximately 115 basis points above its own 11.25% target, providing a buffer that supports both dividend sustainability and strategic optionality.
The surplus matters for two reasons. First, it underpins the fully franked dividend. A bank operating close to its capital floor faces pressure to cut or defer dividend payments; Westpac’s buffer suggests the current payout level is sustainable absent a severe deterioration in asset quality. Second, it creates optionality. Capital above the target can be deployed through share buybacks, increased future dividends, or reinvestment in lending growth, depending on management’s assessment of where the best risk-adjusted return lies.
The market’s initial response was positive. Westpac shares rose approximately 1-2% on 5 May, and by the close on 6 May had reached approximately $38.35, up 1.91% intraday. From a year-to-date starting point of roughly $33.87, the stock has delivered meaningful capital appreciation alongside its income credentials.
That share price strength, however, sits in tension with the macro backdrop. The RBA’s 25 basis point rate hike to 4.35%, announced the same day as the results, introduces a complicating variable. When funding costs rise in a competitive mortgage market, banks face pressure on their net interest margins: the spread between what they earn on loans and what they pay on deposits and wholesale funding. If competition prevents Westpac from fully passing higher rates through to borrowers, that spread narrows, and profitability compresses.
The RBA rate decision on 5 May was the third consecutive 25 basis point hike from a starting point of 3.85% in January 2026, with eight of nine Board members voting for the increase and forward guidance language that left a fourth hike in July firmly on the table pending Q2 CPI data.
Westpac management also cited the Middle East conflict as a contributing factor to the weaker-than-expected profit, adding a layer of geopolitical uncertainty to the earnings outlook.
Three risk factors warrant attention from here:
The gap between the market’s positive short-term reaction and the analyst community’s more cautious longer-term positioning represents a tension that income-focused investors will need to weigh carefully.
Westpac’s 1H FY2026 result delivered on the income proposition. A fully franked 77-cent interim dividend, a 12.4% CET1 ratio, and volume-driven earnings growth across mortgages and business lending provide a solid foundation for shareholders focused on yield and franking credits.
The other side of the ledger is harder to dismiss. A modest earnings miss, analyst consensus tilted toward Sell, and a rate environment that pressures net interest margins all complicate the forward view. Investors should monitor broker research reports due between 5 and 7 May 2026 for updated margin forecasts, as well as second-half trends in funding costs and competitive pricing.
The dividend credentials are intact. Whether the earnings base that supports them can hold through a tightening cycle is the question the next half will need to answer.
For income investors weighing whether Westpac’s payout trajectory can hold through the current tightening cycle, our dedicated guide to Westpac’s dividend forecast projects cumulative growth from the confirmed FY25 full-year payout of $1.53 to a projected $1.70 by FY28, and stress-tests that path against the three most likely disruption scenarios: UNITE cost overruns, mortgage margin compression, and credit quality deterioration.
This article is for informational purposes only and should not be considered financial advice. Investors should conduct their own research and consult with financial professionals before making investment decisions. Past performance does not guarantee future results.
Westpac declared a fully franked interim dividend of 77 cents per share for 1H FY2026, with an ex-dividend date of 8 May 2026 and a payment date of 26 June 2026.
A fully franked dividend means Westpac has already paid 30% corporate tax on the profits distributed, and eligible Australian resident investors receive attached franking credits that can offset their personal income tax liability, increasing the effective after-tax value of the payment.
Westpac's 77-cent fully franked interim dividend compares to ANZ's 83-cent partially franked payment and CBA's $2.35 fully franked interim; once ANZ's partial franking is factored in, the after-tax income gap between ANZ and Westpac narrows significantly for investors in mid-to-high marginal tax brackets.
Westpac reported a Common Equity Tier 1 capital ratio of 12.4%, sitting 115 basis points above its own internal target of 11.25%, which supports the sustainability of its current dividend payout and provides optionality for future buybacks or increased distributions.
The RBA's 25 basis point rate increase to 4.35%, announced on the same day as Westpac's results, puts pressure on the bank's net interest margins because rising funding costs in a competitive mortgage market can compress the spread between what Westpac earns on loans and what it pays on deposits and wholesale funding.