Nikkei 225 Tops 65,000 for First Time on AI Chip Surge
30 mins ago

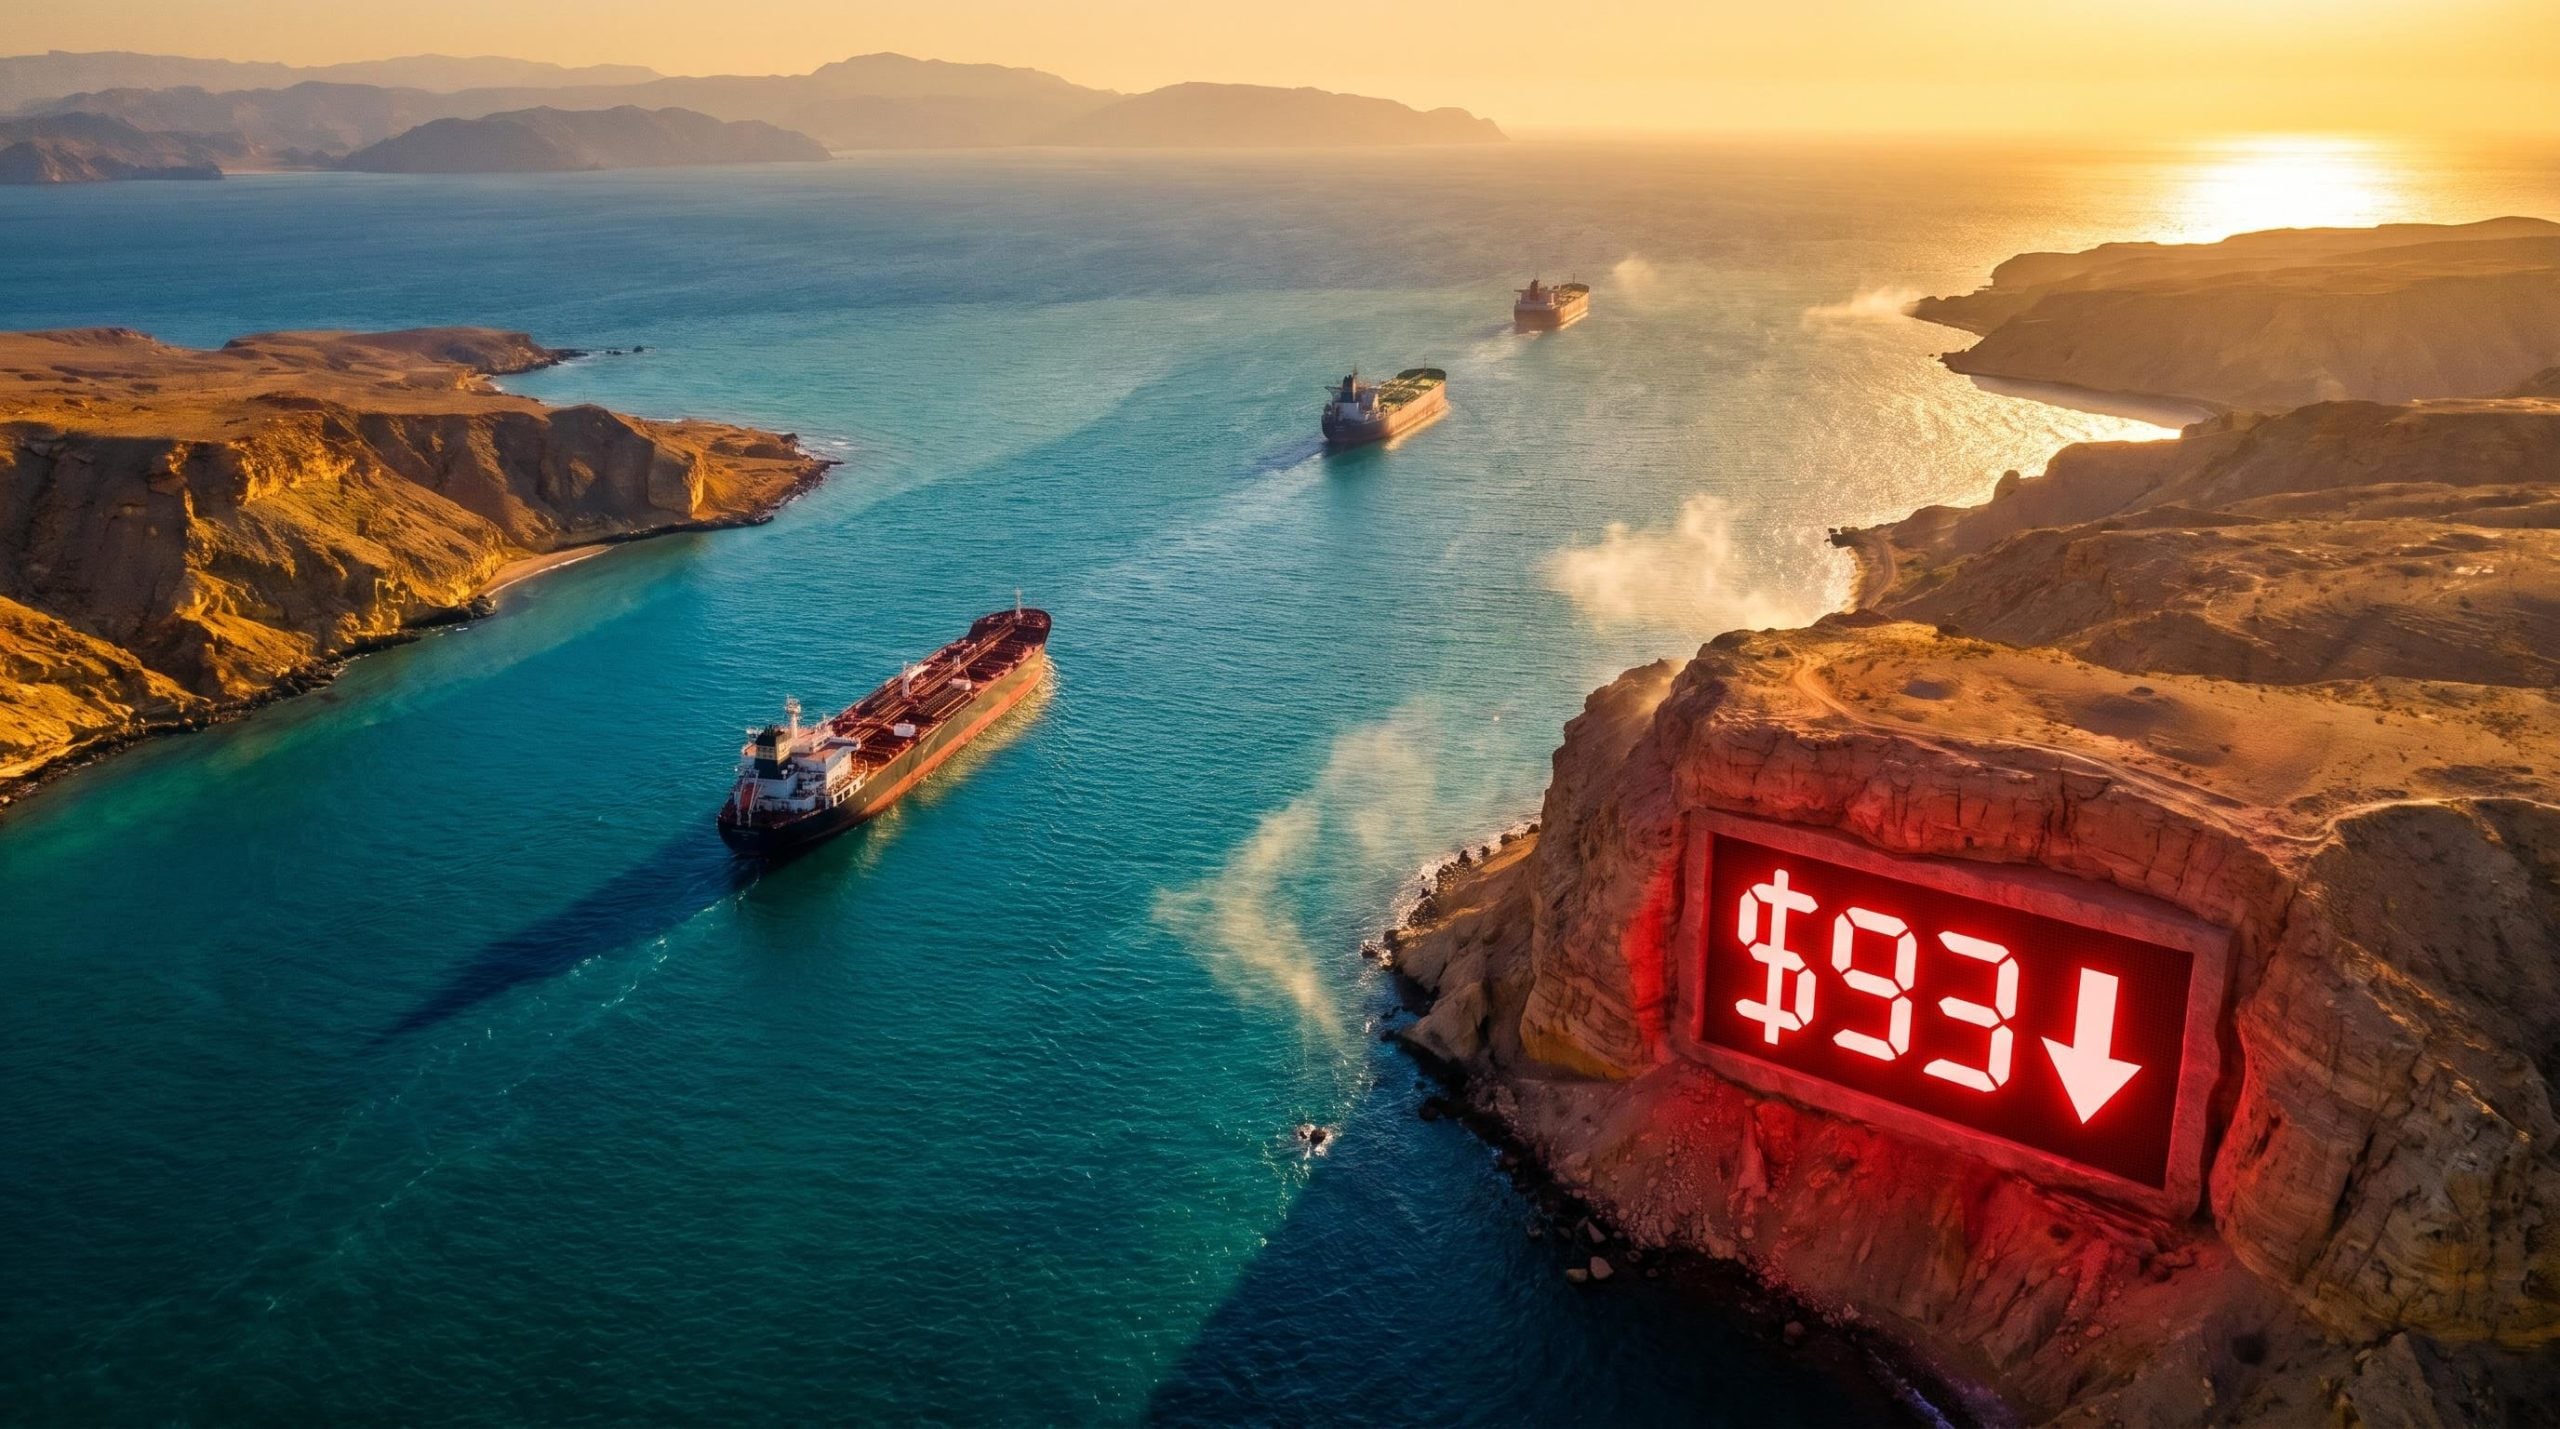
Crude oil prices fell sharply on 25 May 2026, with Brent crude dropping more than 4% to below $100 a barrel and WTI sliding to around $93, as traders priced in the growing possibility that commercial traffic through the Strait of Hormuz could soon resume. The move followed reports of indirect U.S.-Iran talks, mediated by Oman and Qatar, raising hopes of a negotiated arrangement to restore energy flows through the world’s most strategically significant shipping corridor. After months in which a risk premium of roughly $15 per barrel had been embedded in crude, the prospect of normalised transit immediately shifted the calculus for inflation, equity markets, and central bank timelines across the globe. What follows is an examination of what drove the drop, why the Strait carries such outsized weight, what cheaper oil could mean for interest rates, and why President Trump’s comments suggest traders should treat this as a fragile turning point rather than a confirmed one.
The speed of the repricing was striking. Brent July futures had settled at $103.40 a barrel in London on 24 May 2026, with WTI July closing at $97.85 in New York. By early Asian trade the following morning, Brent had punched through the $100 level and WTI was trading in the low $90s, around $93.
The implied prior-week high for Brent sat at approximately $109-$110, based on the magnitude of the decline Bloomberg reported. In the space of a few sessions, more than $10 a barrel had evaporated.
The move was sentiment-driven, not supply-driven. No barrels had been added to the market. No agreement had been signed. Traders were repricing the probability of a diplomatic outcome, and that distinction matters.
Hormuz oil price volatility has a consistent anatomy: intraday swings driven by military or diplomatic headlines obscure the broader directional trend, and the same $103 Brent print on 8 May 2026 that looked like a daily gain of 2% was simultaneously a weekly loss of roughly 7%, illustrating how sentiment-driven sessions can mislead investors who focus on session-level moves rather than the underlying supply picture.
Ole Hansen, Head of Commodity Strategy at Saxo Bank, told Reuters that a sustained move “comfortably below $100” would likely require “tangible progress at the negotiating table, not just headlines,” adding that “if the Hormuz corridor remains uncertain, $95-$110 is still the near-term range.”
The talks are indirect. According to the Wall Street Journal (22 May 2026), U.S. and Iranian officials are communicating through Omani and Qatari mediators. The agenda covers commercial shipping safeguards, rules of engagement for naval assets, and phased sanctions relief linked to Hormuz transit.
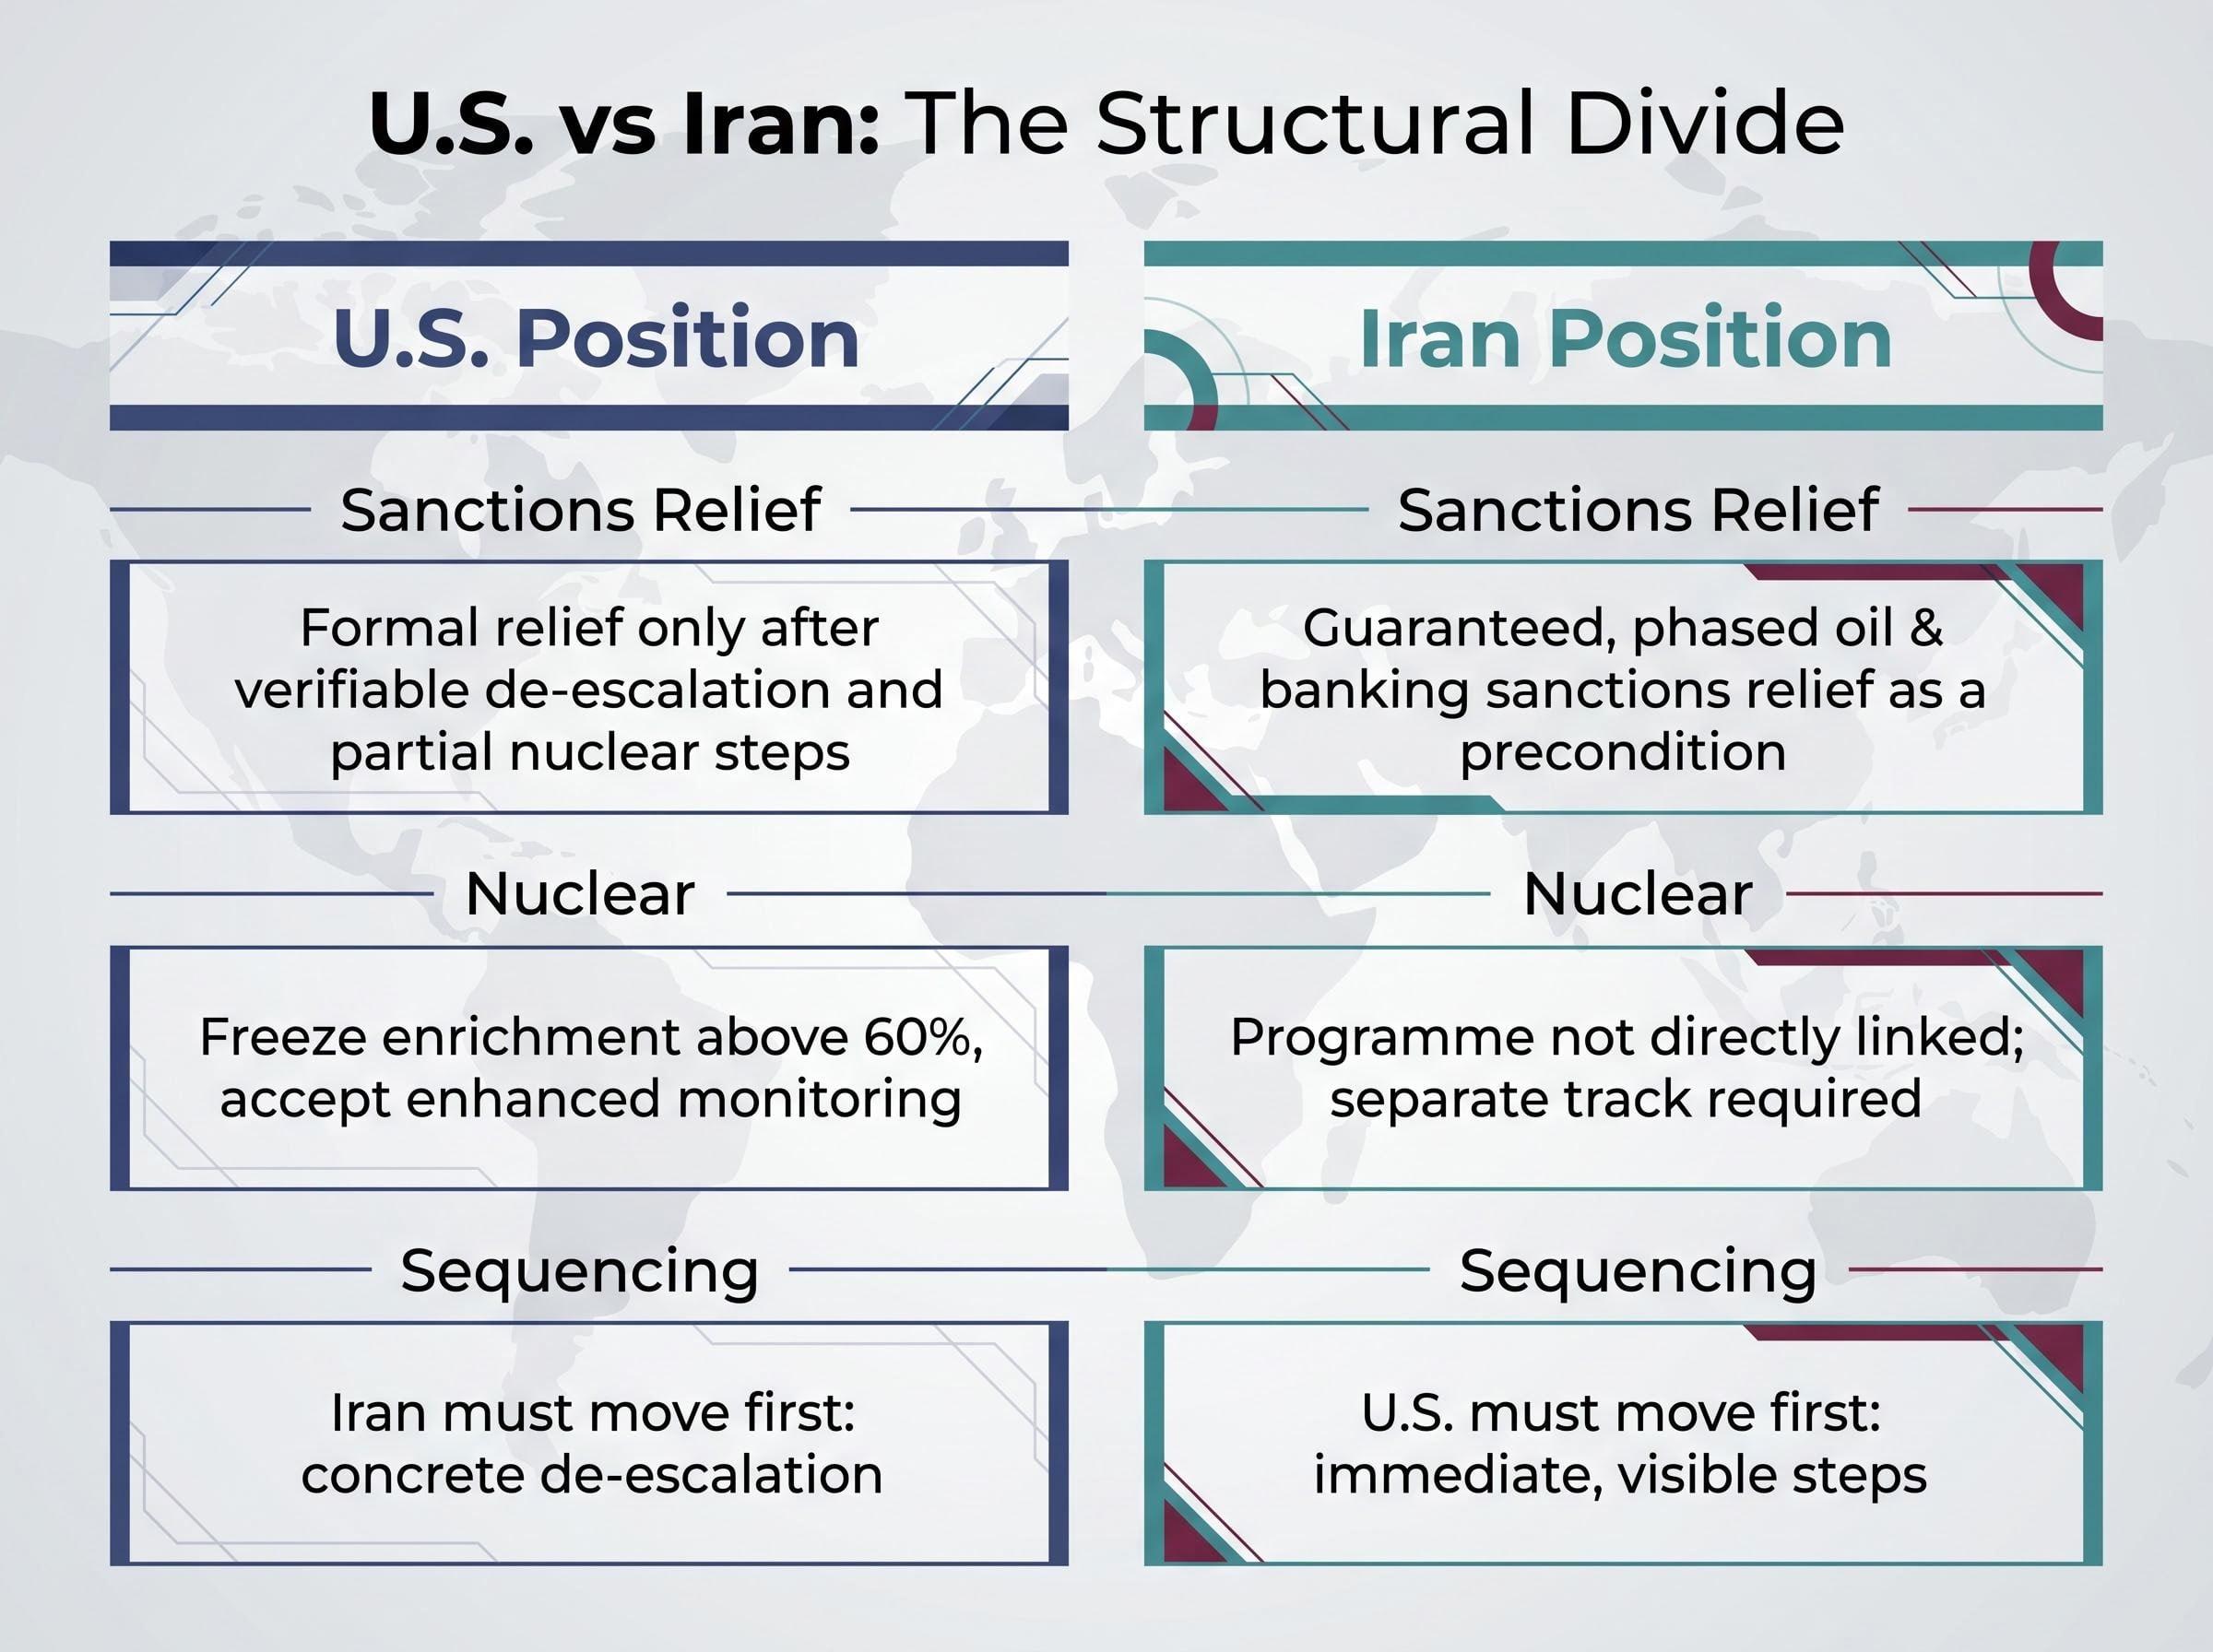
The distance between the two sides is specific and structural.
| Issue | U.S. Position | Iran Position |
|---|---|---|
| Sanctions relief | Formal relief only after verifiable de-escalation in the Strait and partial nuclear steps | Guaranteed, phased oil and banking sanctions relief as a precondition for de-militarising Strait posture |
| Nuclear and enrichment | Freeze enrichment above 60%, accept enhanced monitoring of nuclear facilities | Nuclear programme not directly linked to Hormuz shipping; separate track required |
| Sequencing | Iran must move first: concrete de-escalation before any easing | U.S. must move first: immediate, visible steps on oil exports and frozen funds |
The Iranian Foreign Ministry spokesperson said on 22 May 2026 that Iran “will not accept any agreement that does not include meaningful sanctions relief.” A senior IRGC Navy commander put it more bluntly via IRNA on 21 May 2026: “As long as Iranian oil is under siege, no one should expect total calm in the Strait.”
Iran’s sovereignty demand over the Strait, described by Iranian negotiators as a requirement for permanent transit authority rather than a temporary de-militarisation arrangement, represents the specific structural barrier that makes the sequencing dispute in the current talks more than a procedural disagreement; it is a question of whether Tehran will ever accept an external framework governing what it regards as territorial waters adjacent to its coastline.
Washington’s tone was measured but unhurried. The U.S. Secretary of State reportedly described media accounts of an imminent agreement as “over-excited” (Washington Post, 23 May 2026).
President Trump, in a White House pool report on 24 May 2026, said: “There’s no rush. We’d like to see safe passage through Hormuz, but we’re not under any immediate pressure to sign a deal.”
That statement is the single clearest signal that the market may be running ahead of the diplomacy.
Approximately 21 million barrels per day of crude oil and petroleum liquids passed through the Strait of Hormuz in 2024, according to the U.S. Energy Information Administration (EIA). That represents roughly 21% of global petroleum liquids consumption. The International Energy Agency (IEA), in its February 2026 Oil Market Report, described the Strait as “the world’s single most important oil chokepoint.”
The EIA Hormuz chokepoint data records that roughly 21 million barrels per day of crude and petroleum liquids transited the Strait in 2022, a figure consistent with 2024 estimates, representing approximately 21% of global petroleum liquids consumption and making it categorically different in scale from any other maritime energy corridor.
No other waterway comes close to concentrating that volume of supply through such a narrow corridor.
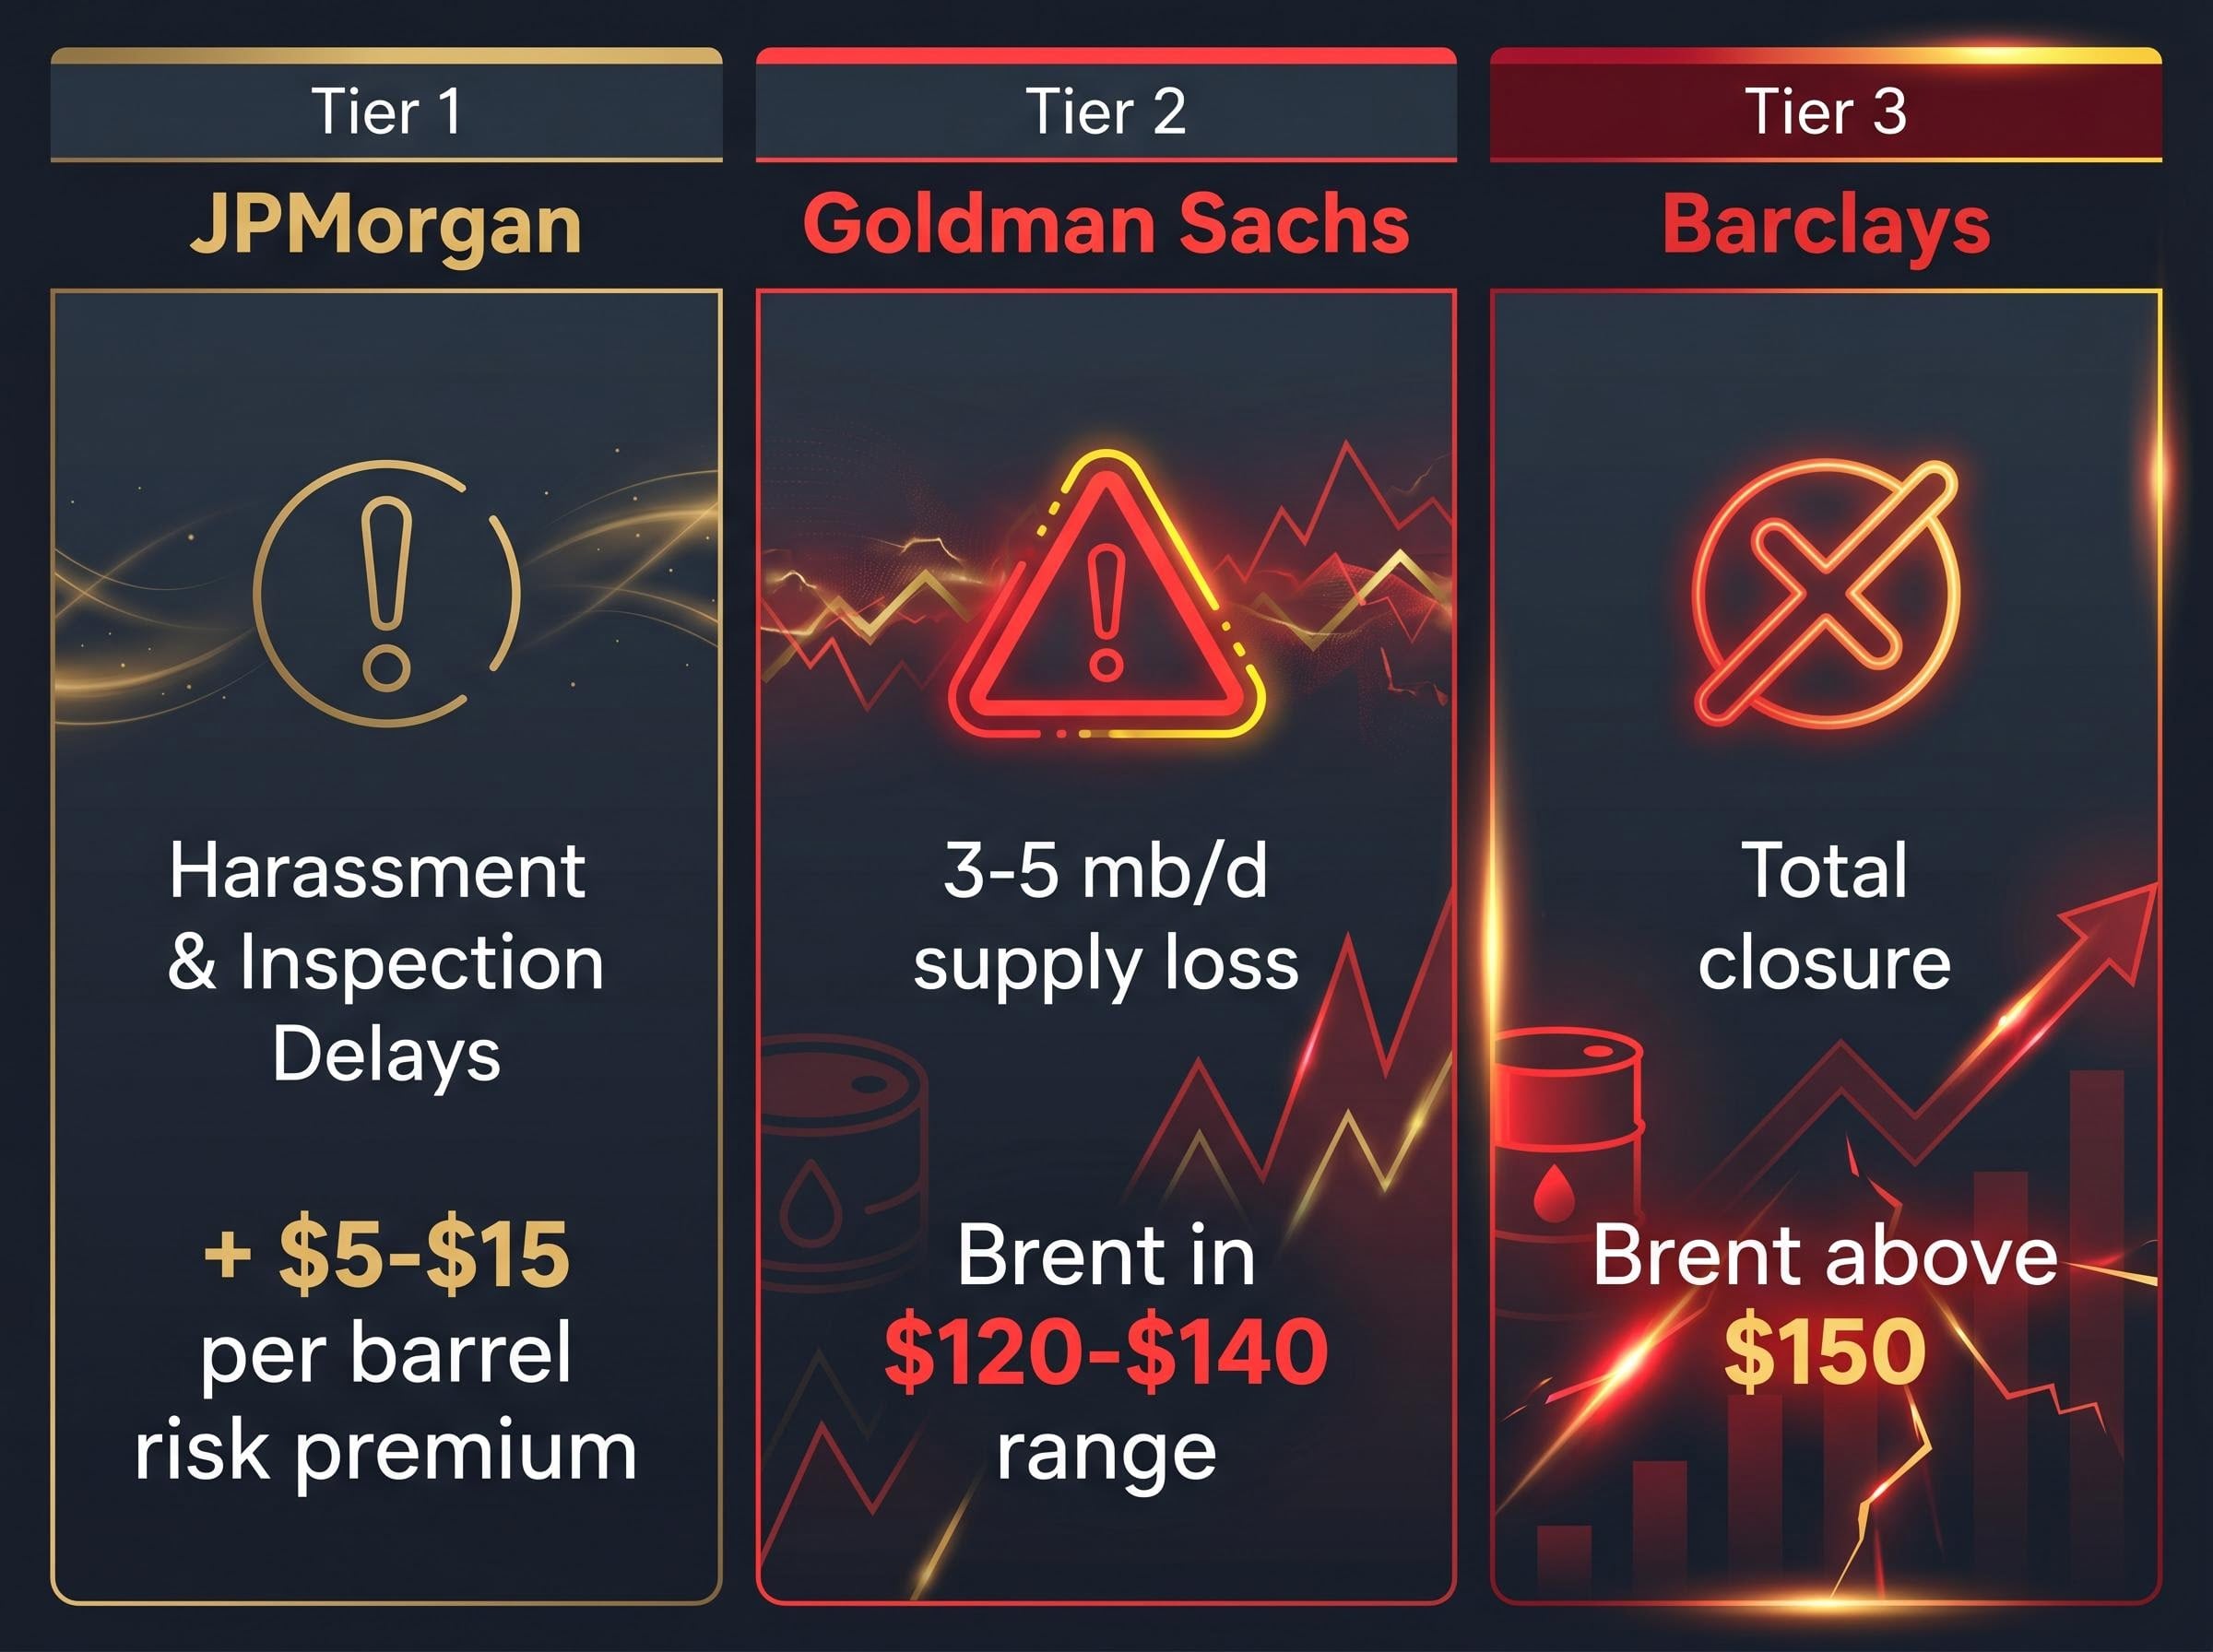
The disruption scenarios escalate quickly. JPMorgan estimated that even “persistent harassment or inspection delays,” short of any formal closure, could add $5-$15 per barrel in risk premia through higher freight and insurance costs alone. Goldman Sachs modelled intermittent disruption with effective supply losses of 3-5 mb/d, estimating that scenario would keep Brent in a $120-$140 range. Barclays modelled a temporary but total closure, projecting a short-term Brent spike above $150 if strategic reserves responded slowly.
The mitigation ceiling is the problem. The Abu Dhabi Crude Oil Pipeline and the Saudi East-West pipeline (Petroline) can bypass Hormuz for up to approximately 7 mb/d combined, according to the EIA. Against 21 mb/d of normal Hormuz flow, that leaves a gap no alternative route can fill. IEA member countries hold more than 1.4 billion barrels of emergency reserves, but as the IEA noted, “coordination and timing are critical.”
The gap between those tail-risk price forecasts and today’s sub-$100 print explains why a diplomatic process that has not yet produced a signed agreement can move crude by 4% in a single session.
The arithmetic is straightforward, at least at the headline level. If Brent holds in the $90s rather than the $110-$120 range that prevailed earlier in 2026, the disinflationary effect flows directly into consumer prices through fuel, transport, and energy-intensive goods.
Michael Feroli, Chief U.S. Economist at JPMorgan, told Bloomberg News on 20 May 2026 that sustained sub-$100 Brent could “shave about 0.3-0.4 percentage points off headline U.S. CPI over the next year,” making “two cuts later this year” more plausible provided core inflation continued drifting lower.
The jurisdiction-by-jurisdiction picture adds nuance:
Capital Economics estimated that Brent averaging $95 rather than $115 would lower its global inflation forecast by approximately 0.3 percentage points for 2026, raising the likelihood of major central bank easing by year-end.
The core-versus-headline distinction is why this is not an automatic green light for rate cuts. Central banks will welcome cheaper oil as a buffer, not a mandate. The rate-cut timeline has improved, conditionally.
Geopolitical risk transmission from the Hormuz corridor into bond markets has been operating through the term premium channel as well as the inflation channel, with U.S. 30-year Treasury yields reaching 5.145% and Japanese government bond yields hitting 29-year highs simultaneously in mid-May 2026, a cross-market dynamic that means cheaper oil benefits fixed income holders as well as equity risk appetite if the diplomatic track holds.
The pattern from the past 14 months is consistent: risk premia build quickly on fear of escalation and unwind just as quickly once the threat appears to recede.
HSBC strategists, cited by the Wall Street Journal on 24 May 2026, observed: “Risk premia built up quickly on fear of escalation but unwound just as fast once diplomatic channels produced a credible de-escalation path.”
JPMorgan strategists noted that in both the 2025 and 2026 Hormuz episodes, “equities traded the macro implications, growth and inflation, more than the geopolitics themselves.” Asian markets were consistently the most sensitive to Hormuz-driven oil swings, with energy-importing economies’ equities underperforming when Brent surged and outperforming when prices retreated.
The implication for today: if talks stall, the $15 premium that was built over months can return far faster than it took to accumulate.
Amrita Sen, co-founder of Energy Aspects, told Bloomberg Television on 24 May 2026 that her base case had Brent “averaging in the mid-$90s in the second half if flows normalise.” The caveat followed immediately: a breakdown in talks could push Brent “back above $110 very quickly.”
Giovanni Staunovo, Commodity Strategist at UBS, wrote in a client note cited by CNBC on 23 May 2026: “Brief dips below $100 are possible on progress headlines, but we doubt they will be durable until shipping and insurance premia for Hormuz return to pre-crisis levels.”
The deal-optimism pricing risk embedded in today’s move is sharpened by equity market positioning data: Bank of America’s May 2026 Fund Manager Survey showed cash allocations at 3.9%, a level that historically triggers a contrarian sell signal, while the S&P 500 had recorded eight consecutive weekly gains before 25 May, leaving portfolios unusually exposed to a binary negative outcome if the diplomatic track reverses.
The Pentagon confirmed on 22 May 2026 that no adjustments to U.S. Navy force posture had been ordered and that freedom of navigation operations would continue regardless of the diplomatic track. That is not the posture of a government expecting a deal imminently.
The specific signals traders should monitor to judge whether today’s move has legs:
The asymmetry is clear. The upside scenario, normalised flows and sustained sub-$100 Brent, is constructive for equities and inflation. The downside scenario, a breakdown in talks and re-escalation, reintroduces the $120-$140 Brent range that Goldman Sachs modelled for partial disruption.
Crude oil prices have moved sharply on the expectation that diplomacy will deliver what months of geopolitical tension could not: safe, uninterrupted passage through the Strait of Hormuz. The downstream consequences, inflation relief, central bank optionality, improved equity risk appetite, are real if the price holds. They are conditional if it does not.
The specific sticking points in U.S.-Iran talks remain unresolved. Sequencing, nuclear conditions, and sanctions phasing are live disputes, and President Trump’s “no rush” framing leaves the timeline to resolution undefined.
The distinction that matters is between the signal and the outcome. Markets are pricing a probability of de-escalation, not a signed, verifiable agreement. The evidence base for whether today’s move holds or reverses will come from observable milestones: Iranian de-escalation steps, U.S. sanctions decisions, and the normalisation of Hormuz freight and insurance costs.
Until those milestones arrive, the 4% drop in Brent is a bet on hope, not a confirmation of peace.
This article is for informational purposes only and should not be considered financial advice. Investors should conduct their own research and consult with financial professionals before making investment decisions. Forward-looking statements regarding oil prices, inflation, and central bank policy are speculative and subject to change based on market developments and geopolitical conditions.
Crude oil prices fell more than 4% on 25 May 2026 after reports emerged of indirect U.S.-Iran talks mediated by Oman and Qatar, raising the possibility that commercial shipping through the Strait of Hormuz could soon resume and that a roughly $15 per barrel geopolitical risk premium could be unwound.
The Strait of Hormuz is a narrow maritime corridor through which approximately 21 million barrels per day of crude oil and petroleum liquids passed in 2024, representing about 21% of global petroleum consumption, making it the world's single most important oil chokepoint according to the IEA.
JPMorgan economists estimated that sustained sub-$100 Brent crude could shave 0.3-0.4 percentage points off U.S. headline CPI over the next year, while Capital Economics calculated that Brent averaging $95 instead of $115 would lower global inflation forecasts by roughly 0.3 percentage points, improving the conditions for central bank rate cuts.
The core disputes involve sequencing (the U.S. wants Iranian de-escalation before sanctions relief, while Iran demands upfront oil and banking sanctions easing as a precondition), nuclear enrichment conditions, and Iran's insistence on permanent transit authority over the Strait rather than a temporary de-militarisation arrangement.
Key indicators include verifiable Iranian de-escalation steps in the Strait, U.S. sanctions sequencing decisions, changes to U.S. Navy force posture signalling confidence in the diplomatic process, and the normalisation of Hormuz freight and insurance costs to pre-crisis levels.