Hedge Funds Hit a 10-Year High in Tech Exposure Despite Iran Risk
4 hrs ago


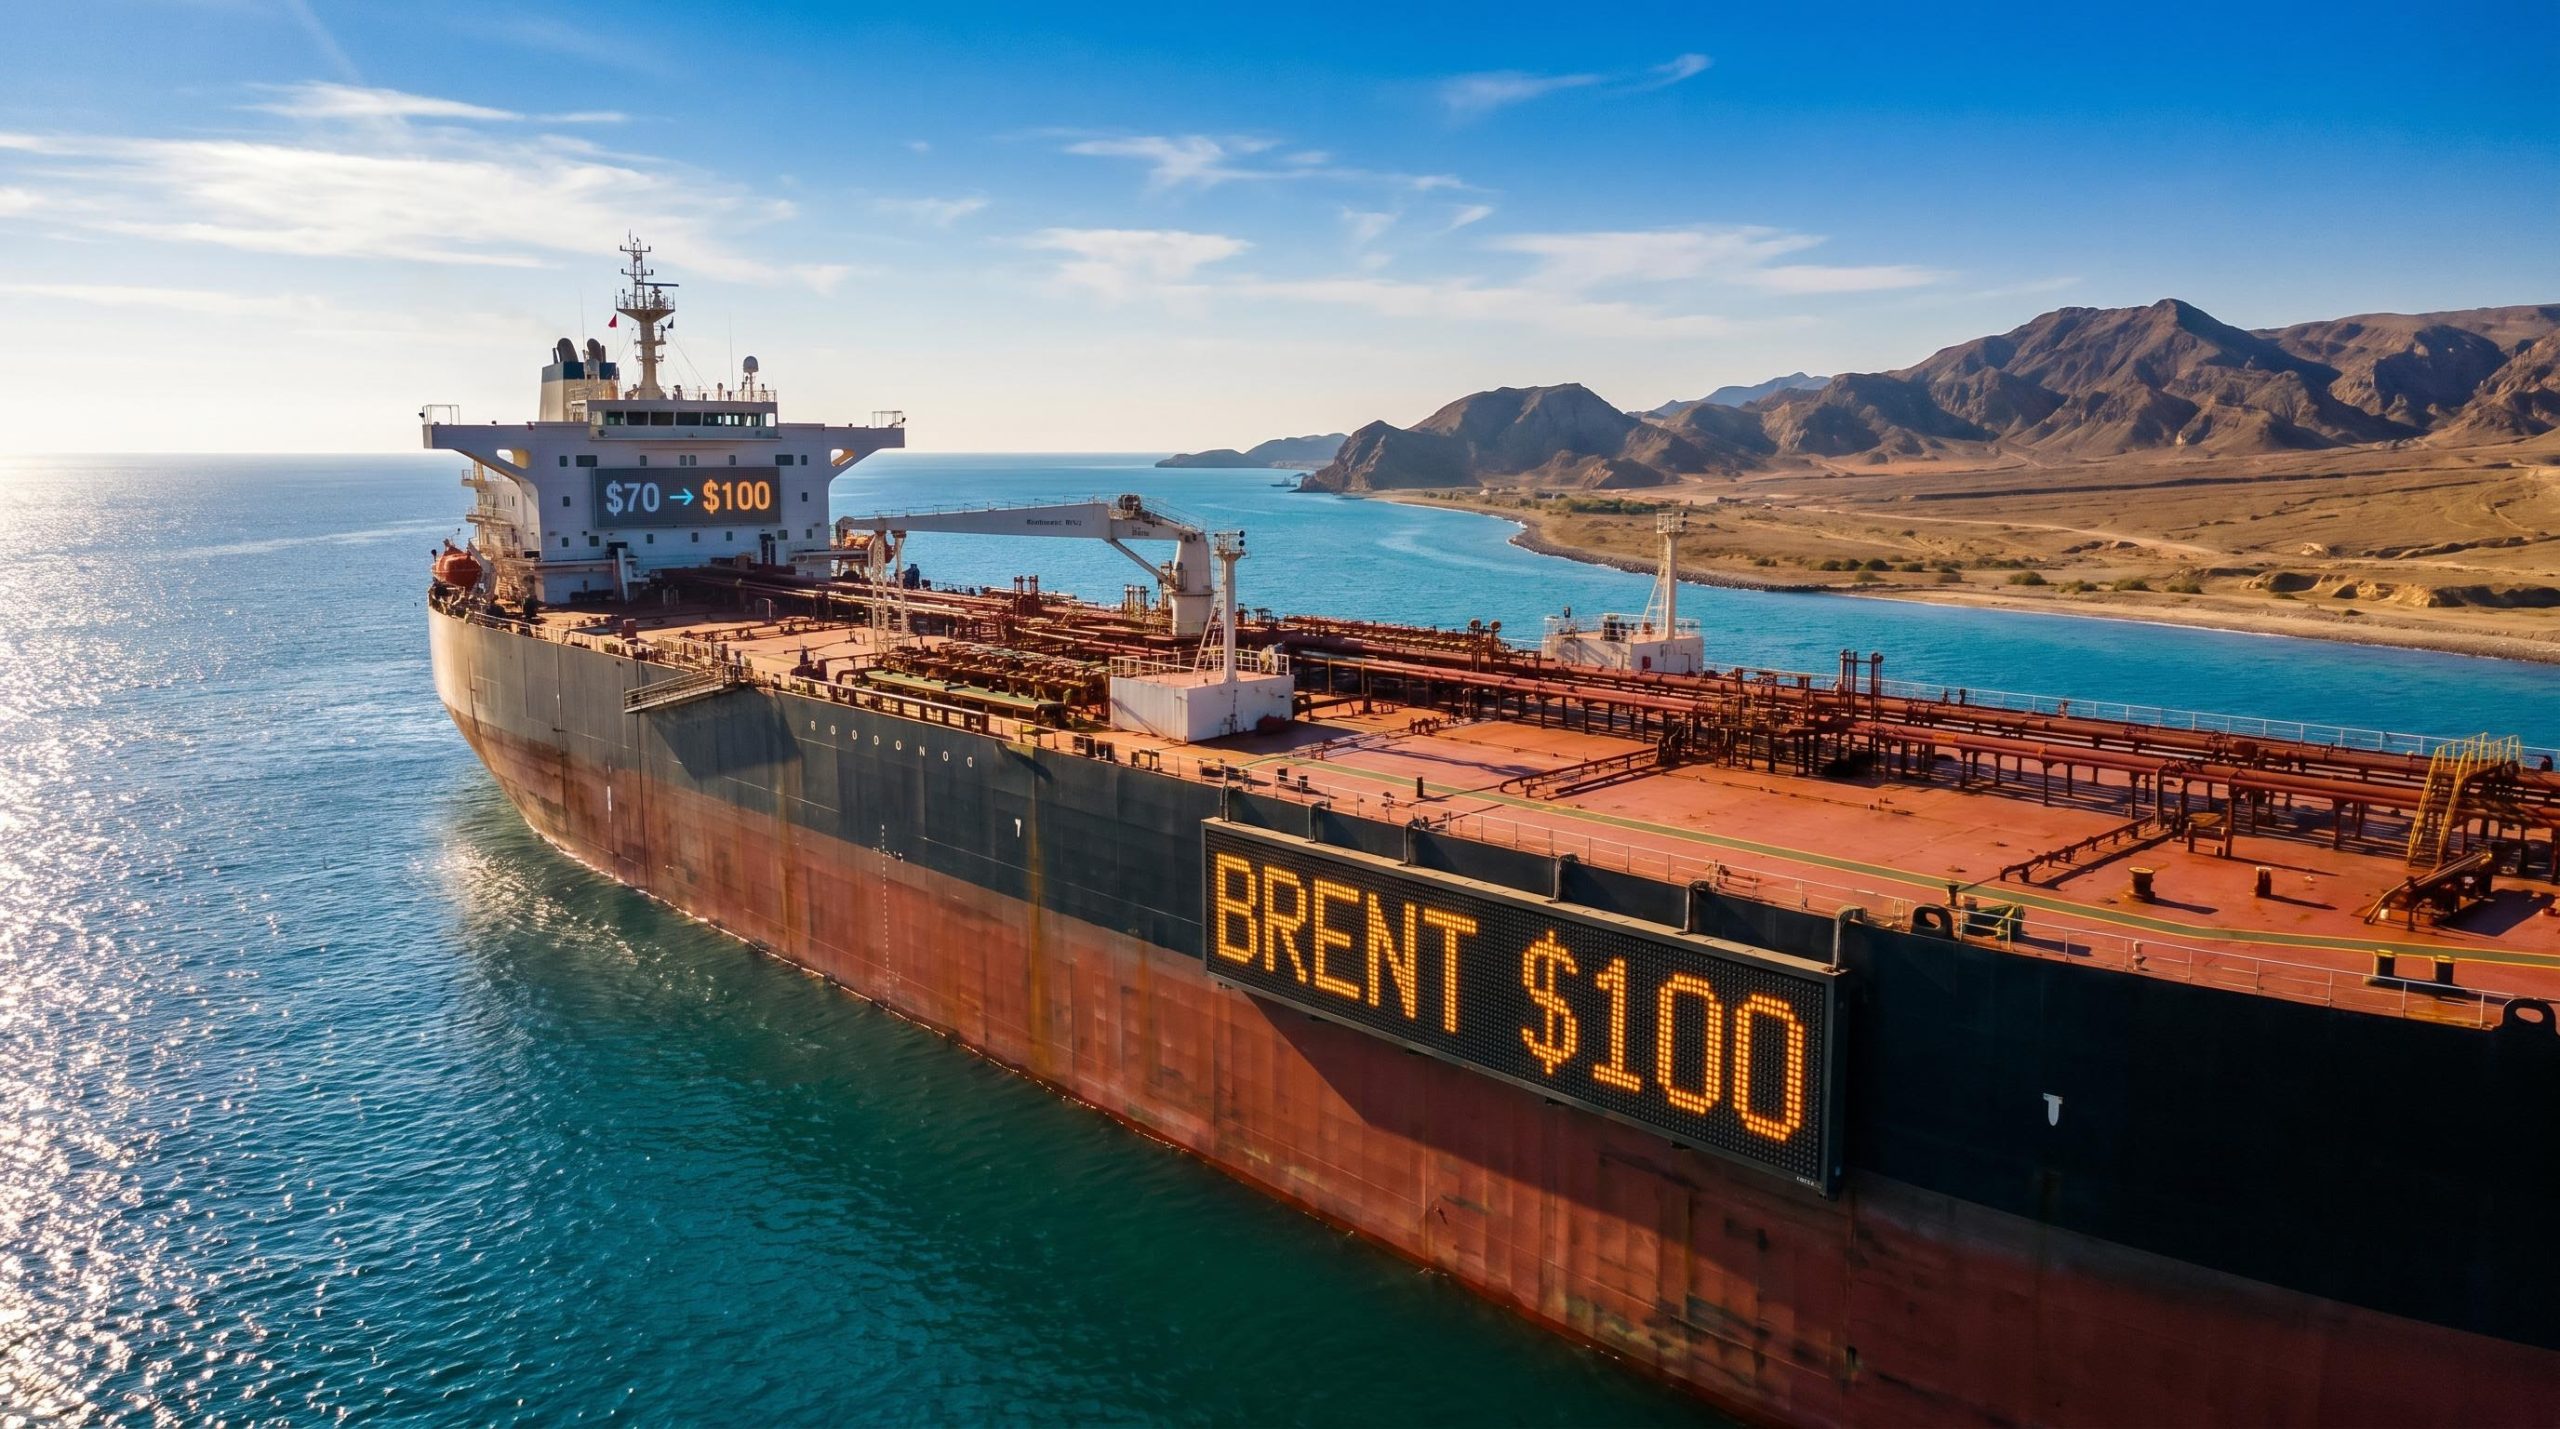
On 25 May 2026, Brent crude fell below $100 per barrel for the first time in weeks, dropping approximately 5.3% in a single session as traders priced in the possibility that the Strait of Hormuz, effectively closed to tanker traffic since late February, could soon reopen. The Strait’s closure had been a primary driver of the inflation surge that reshaped the global macro environment through early 2026, forcing central banks to reassess tightening timelines they had only recently begun to relax.
A single day’s move in crude does not resolve that story. It does, however, open a different question: if oil prices retrace toward pre-conflict levels near $70 per barrel, what happens to the inflation arithmetic, the bond market, and the rate-cut calculus that investors have been running all year?
What follows is an analysis of the transmission mechanism from crude oil prices to headline inflation, what falling energy costs would mean for central bank decision-making in the current cycle, and which interest-rate-sensitive assets stand to benefit most if the Hormuz reopening materialises into a sustained price decline.
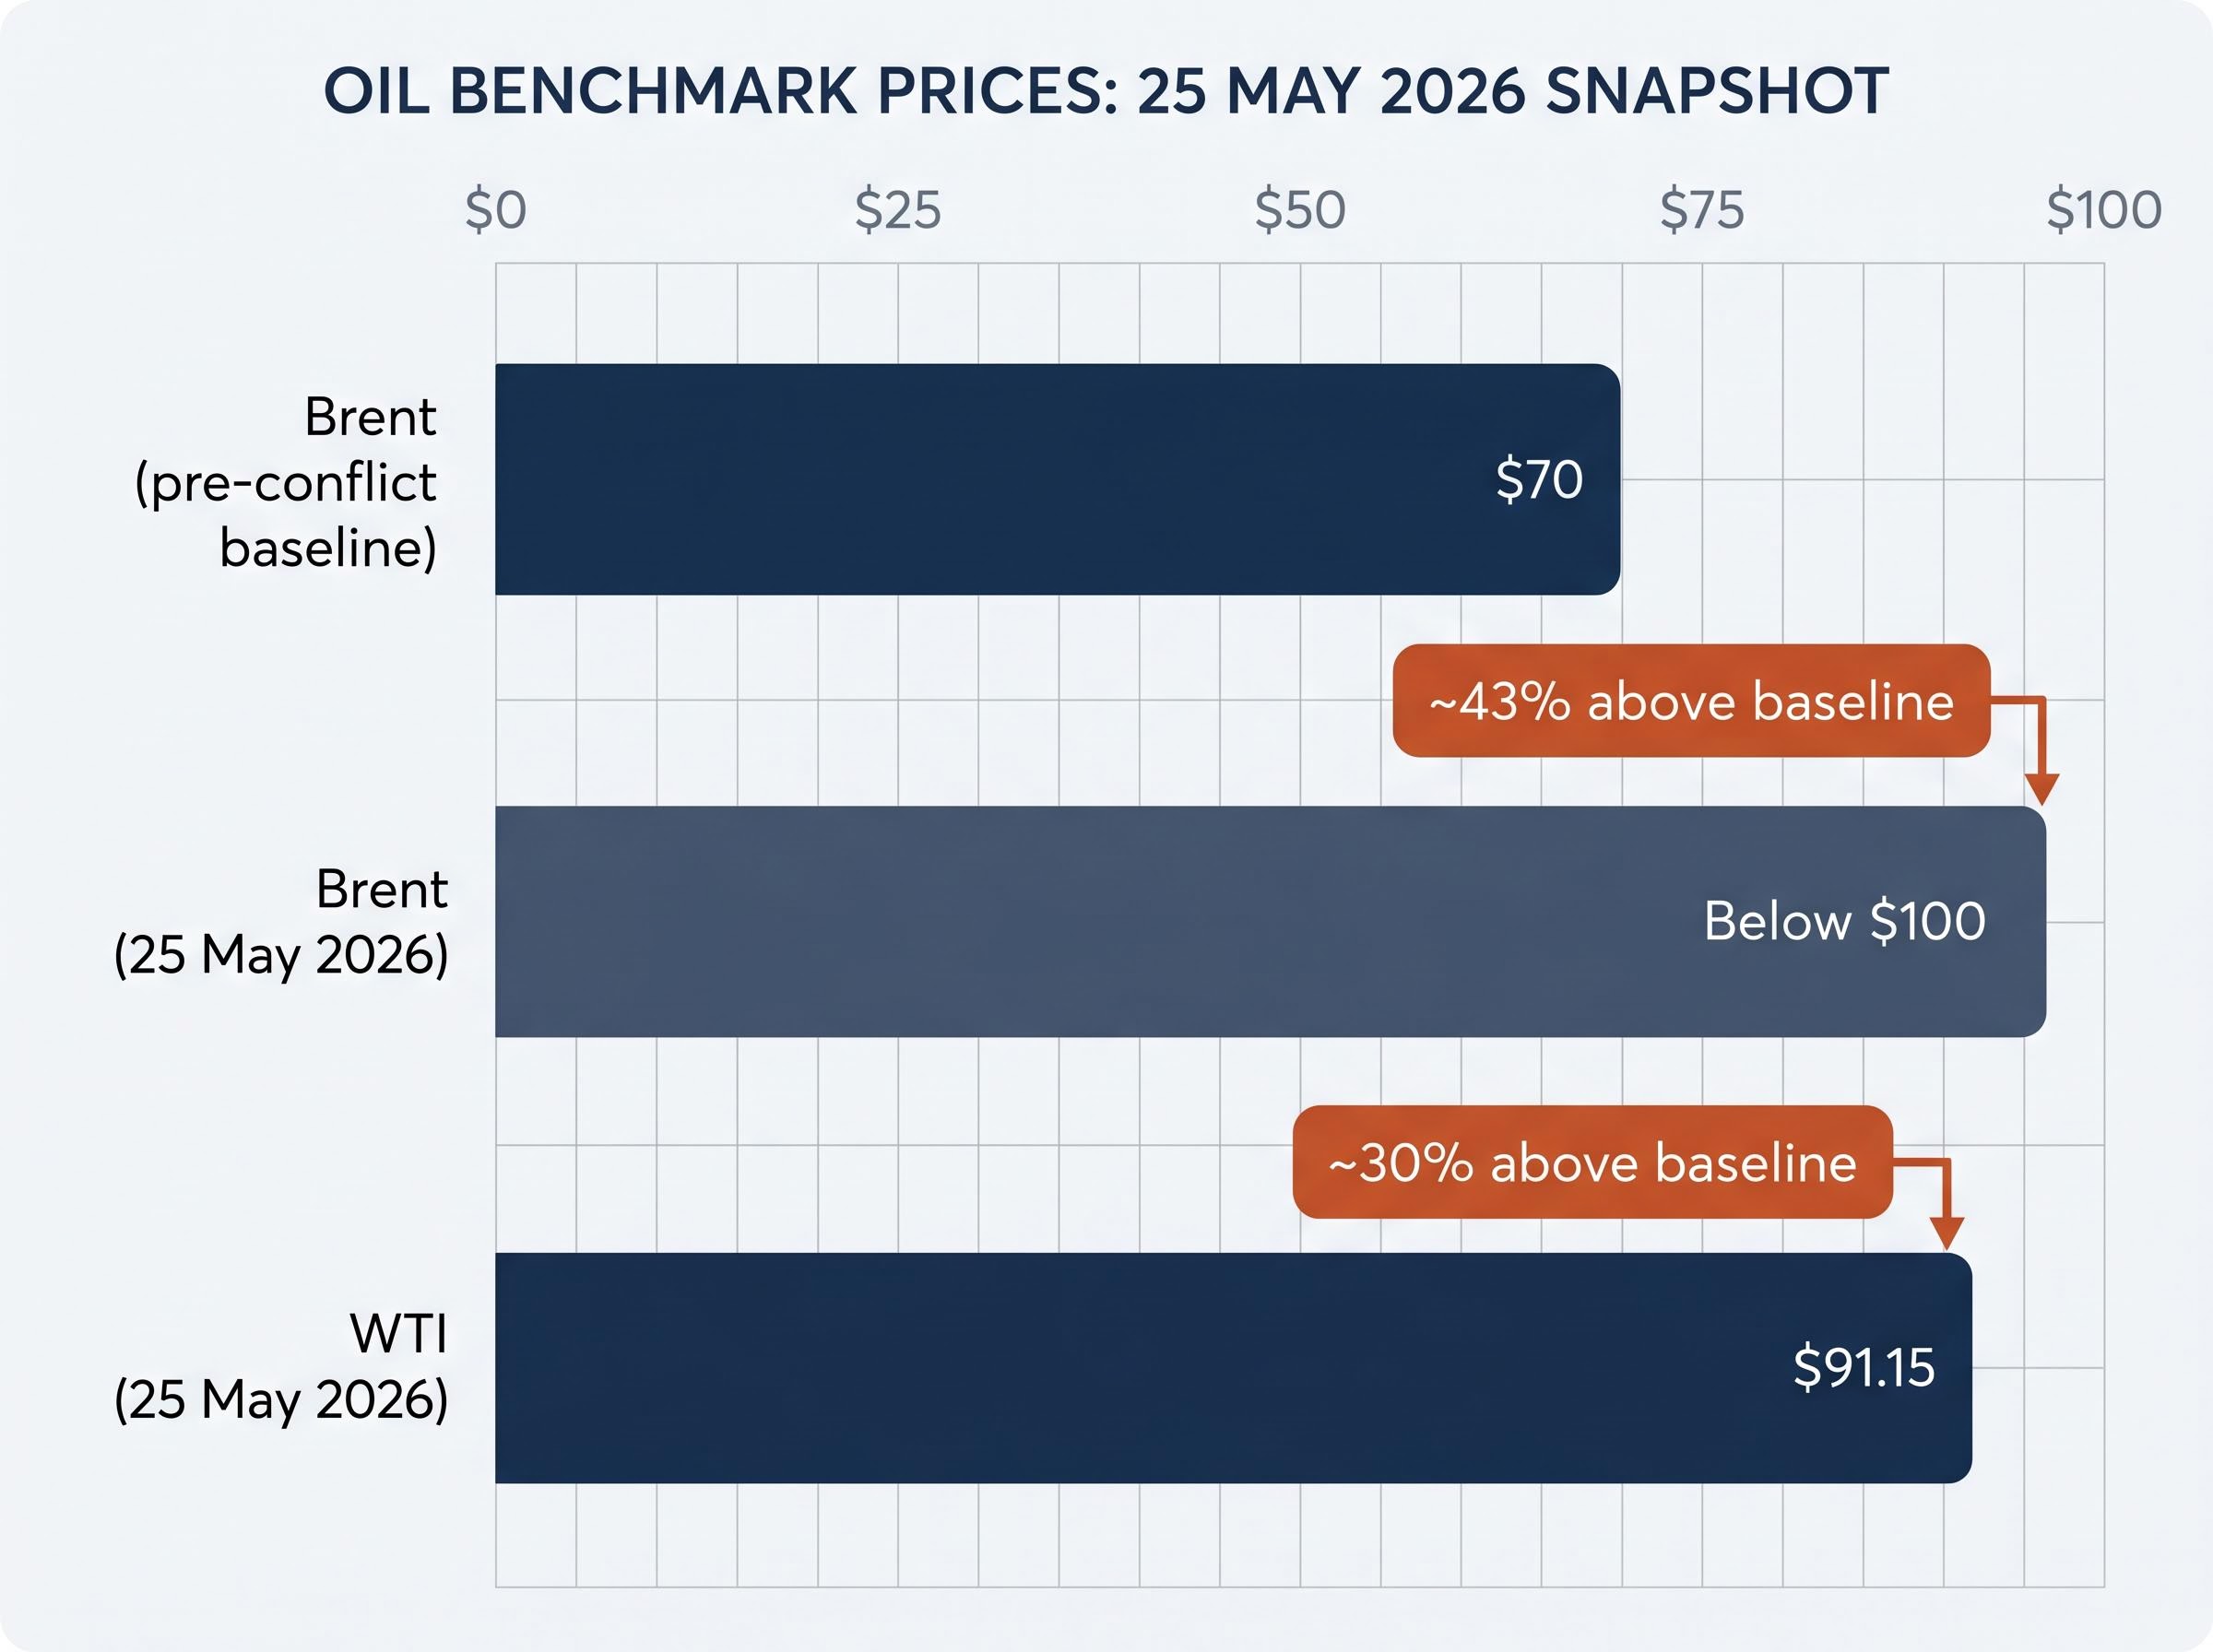
The numbers told one story. Brent crude closed below $100, down approximately 5.3% on the session. West Texas Intermediate settled at $91.15, a decline of roughly 5.6%. Both contracts moved sharply away from the conflict-era highs that have persisted since the Strait of Hormuz closure in late February, though they remain well above the pre-conflict baseline of approximately $70 per barrel.
| Benchmark | Price | Distance from Pre-Conflict Baseline (~$70) |
|---|---|---|
| Brent (pre-conflict baseline) | ~$70 | Baseline |
| Brent (25 May 2026) | Below $100 | ~43% above baseline |
| WTI (25 May 2026) | $91.15 | ~30% above baseline |
The catalyst was diplomatic, not operational. Reports emerged of a preliminary US-Iran framework that reportedly includes provisions for reopening the Strait, through which approximately one-fifth of global oil supply transits. The market moved on the framework’s existence, not its completion.
The context behind that gap matters: the 57% oil price surge from approximately $70 to above $110 per barrel unfolded in under three months, driven by EIA-modelled Gulf production shut-ins that peaked at nearly 10.8 million barrels per day, a volume equivalent to removing roughly 80% of total US crude output from global markets.
That distinction matters. Iran’s foreign ministry stated that a final accord is not imminent. Key disputes over nuclear enrichment remain unresolved. President Trump stated his team has been directed not to rush, with port blockades remaining in place until a deal is verified.
ING analysts described the resolution of differences over Iran’s nuclear activities as a major outstanding uncertainty, suggesting that the diplomatic framework is a starting point rather than a conclusion.
The 5.3% drop is a probability repricing, not a confirmation. The gap between current prices and the $70 baseline measures exactly how much further the adjustment could run if a deal is formalised, and how much could snap back if talks collapse.
The connection between a barrel of crude and the inflation readings that central banks target is mechanical, and it moves faster than most investors assume.
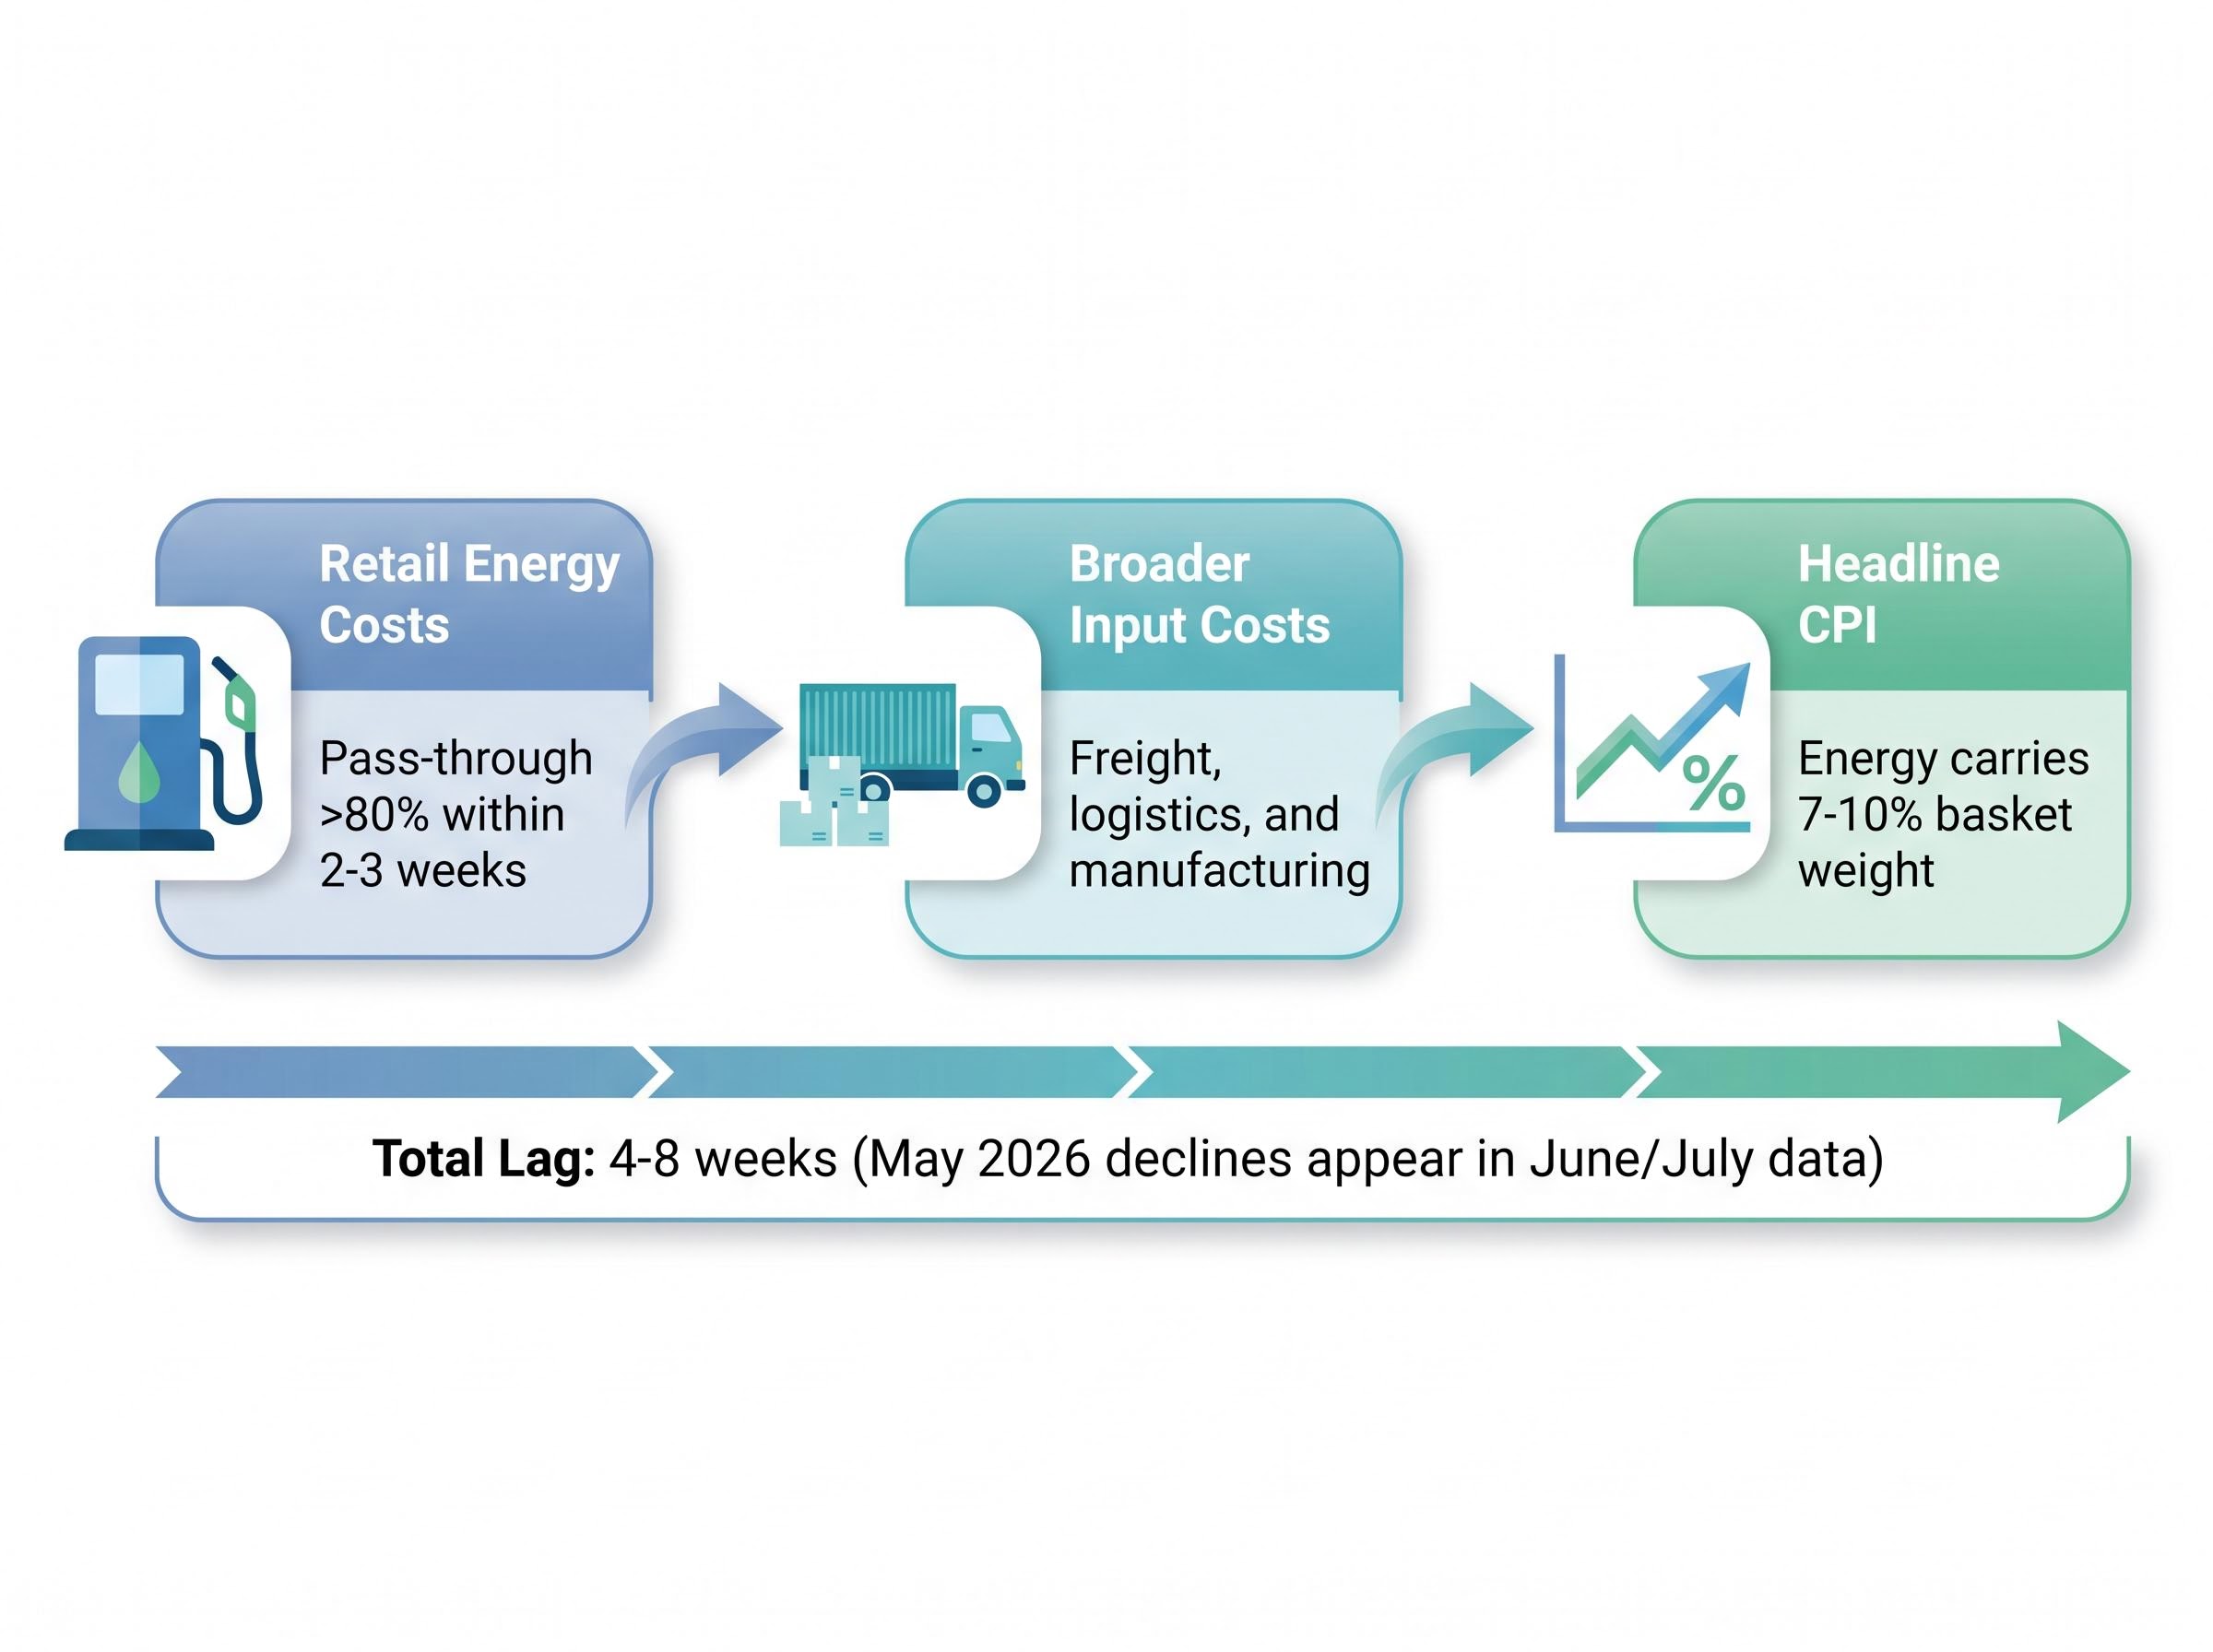
The chain operates in three sequential stages:
Federal Reserve oil price pass-through research documents that the effect on core inflation is limited but long-lasting, with direct energy cost changes moving through to consumer prices across both the US and Euro area, an asymmetry that explains why headline relief can arrive quickly while underlying price pressures prove more stubborn.
US Bureau of Labor Statistics CPI releases, Eurostat Harmonised Index of Consumer Prices readings, and UK Office for National Statistics CPI data through spring 2026 all show elevated energy components in their headline series. These readings are consistent with the period of the Strait closure, though none of the statistical agencies explicitly attributes its published figures to the Hormuz disruption in release text.
A sustained oil decline would reduce headline inflation relatively quickly, potentially within months, as lower energy costs mechanically compress the CPI basket’s energy component.
Core inflation, which strips out energy and food, adjusts far more slowly. Services prices and wage growth, the dominant drivers of core readings, have proven persistent through the 2022-2025 period across all three major economies. Central banks in the current cycle have been particularly attentive to core readings for this reason.
The implication is direct: an oil price decline could deliver rapid headline relief while leaving the underlying inflation pressure that central banks worry about most largely intact. Both numbers will matter in the months ahead.
Core CPI pass-through estimates from Barclays and JPMorgan suggest that 40-60% of the oil price increase feeds into core readings over a 3-6 month horizon, which is precisely why June and July prints carry more policy weight than the April figure already released, and why central bank language around energy developments will be parsed closely in the weeks ahead.
The arithmetic is straightforward. If Brent were to decline from approximately $100 (as of 25 May) toward the pre-conflict baseline of roughly $70, that would represent a decline of approximately 30% from current levels. A move of that magnitude would produce a proportionate compression in the energy component of headline CPI across every major economy where fuel costs carry a 7-10% basket weight.
The approximately $30 gap between current Brent levels and the pre-conflict baseline is the single most important number for the inflation outlook. It represents the full potential scale of headline relief if a diplomatic resolution holds.
The lag structure means this relief would not appear immediately. Oil price changes typically take 4-8 weeks to show up in headline CPI prints, meaning a sustained May 2026 decline would begin appearing in June and July inflation data.
Several conditions would need to hold for the full inflation reversal to materialise:
No named analyst commentary identified as of 25 May explicitly models this full reversal scenario. The analysis is inferential, built from documented price levels and standard macroeconomic transmission frameworks rather than from a specific research note forecasting the path from $100 to $70.
This article is for informational purposes only and should not be considered financial advice. Investors should conduct their own research and consult with financial professionals before making investment decisions.
Ahead of the late-February conflict, central banks had begun cautiously signalling a shift toward easing after the aggressive hiking cycles of 2022-2024. The Hormuz-driven inflation resurgence complicated those signals, reintroducing energy-price risk into a policy environment that had started to assume the inflation fight was largely won.
No Federal Open Market Committee statement, European Central Bank Governing Council account, or Bank of England Monetary Policy Committee communication has been identified that explicitly attributes rate guidance to the 2026 conflict or the Strait closure. What is documented is that all three institutions reference energy-price developments as active inflation variables in their 2024-2026 communications.
Goldman Sachs estimates that a sustained $10-20 per barrel increase in the geopolitical oil risk premium adds several tenths of a percentage point to US headline CPI over 12 months, and all three major central banks maintained a conditional look-through posture on energy-driven inflation throughout the conflict period, meaning any escalation that feeds into wages or services prices could trigger tightening signals across the Fed, ECB, and Bank of Japan simultaneously.
The forward logic follows a conditional path: if oil prices sustain a decline and upcoming CPI prints reflect lower energy contributions, rate-setters gain headroom to proceed with cuts that were already directionally signalled but had been delayed by the energy shock.
| Phase | Rate Expectation | Energy Price Context |
|---|---|---|
| Pre-conflict (before late Feb 2026) | Cautious easing direction | Oil near ~$70; energy inflation moderating |
| Post-conflict disruption (Mar-May 2026) | Easing paused; tightening risk re-emerged | Oil above $100; energy inflation resurgent |
| Post-resolution scenario (conditional) | Easing path potentially restored | Oil declining toward $70; energy drag fading |
Past performance does not guarantee future results. These forward-looking rate expectations are conditional on diplomatic and market developments that remain uncertain.
The gap between the second and third rows of that table is the space where rate-sensitive assets, from equities to bonds to mortgage rates, will be repriced in the weeks ahead.
Falling oil prices reduce inflation expectations. When inflation expectations decline, the inflation premium embedded in nominal bond yields compresses, which typically pushes yields lower. The effect is most visible in the 5-year and 10-year segments of the yield curve, where inflation expectations carry the greatest weight relative to shorter-duration instruments.
Oil prices posted weekly losses in May 2026 sessions amid diplomatic progress signals, according to Reuters and CNBC reporting. However, specific 10-year Treasury yield levels and intraday breakeven movements as of 25 May 2026 are not detailed in named primary sources examined for this analysis.
Specific yield and breakeven data for 25 May is not yet captured in named primary sources. The directional relationships described here are grounded in documented macro mechanics rather than confirmed real-time reporting from this session.
Historically, sustained 10% declines in crude oil correspond to approximately 0.1-0.2 percentage point compressions in 5-year inflation breakevens. If oil were to complete the full 30% retrace to $70, the cumulative breakeven compression could prove material for fixed-income positioning.
An inflation breakeven is the yield difference between a standard Treasury bond and a Treasury Inflation-Protected Security (TIPS) of the same maturity. It represents the market’s implied inflation expectation over that period. If the 10-year breakeven sits at 2.5%, the bond market is collectively pricing average annual inflation of 2.5% over the next decade.
Breakevens are particularly sensitive to energy price moves because energy is a large and volatile component of the CPI basket used to calculate TIPS adjustments. When oil falls, the market’s implied inflation expectation adjusts accordingly, often within the same trading session.
The 5% drop on 25 May moved the market, but it did not close the gap. As of the session’s close, the remaining distance between Brent’s sub-$100 level and the pre-conflict $70 baseline implies approximately $30 per barrel of risk premium still embedded in prices. That premium represents the market’s collective assessment that reopening the Strait of Hormuz remains uncertain.
The unresolved issues keeping that premium intact are specific and identifiable:
ING analysts described the resolution of differences over Iran’s nuclear activities as a major outstanding uncertainty, reinforcing that the diplomatic framework announced this week is a starting point, not a settlement.
A breakdown in talks would reverse the day’s price action rapidly, restoring crude toward conflict-era highs and unwinding the inflation relief narrative that bond and equity markets began pricing on 25 May. The $30 gap is the measure of that binary risk.
The deal-collapse scenario carries specific positioning risk: Bank of America’s May 2026 Fund Manager Survey showed cash allocations at 3.9%, triggering a contrarian sell signal, while the S&P 500 had recorded eight consecutive weekly gains by late May, leaving market positioning unusually concentrated on a binary diplomatic outcome that Reuters characterised as near collapse as recently as 22-23 May.
The 5.3% single-day decline in Brent crude is a meaningful signal. It confirms that the market sees a non-trivial probability of resolution. But the macro relief that signal promises, lower headline inflation, central bank easing headroom, compressed yields and breakevens, only fully materialises if the $30 gap between current prices and pre-conflict levels closes sustainably.
The indicators to watch in the weeks ahead are specific. June and July CPI prints across the US, Eurozone, and UK will be the first releases where lower energy costs could begin appearing, given the 4-8 week transmission lag. Central bank communications from the Fed, ECB, and BoE will be scrutinised for any shift in language around energy-price developments. And Strait of Hormuz shipping traffic data, the operational measure of whether the reopening is real, will matter more than diplomatic communiqués.
What 25 May represents is not a resolution. It is a repricing of probability. The distance between that repricing and the full macro payoff, measured in the $30 per barrel the global economy is still paying above pre-conflict norms, is the question that will shape inflation, interest rates, and asset prices through mid-2026.
These statements reflect analytical inference based on documented price levels and standard macroeconomic frameworks. They are speculative and subject to change based on market developments and diplomatic outcomes.
An inflation breakeven is the yield difference between a standard Treasury bond and a Treasury Inflation-Protected Security (TIPS) of the same maturity, representing the bond market's implied inflation expectation. Because energy is a large and volatile component of the CPI basket used to calculate TIPS adjustments, when oil prices fall, the market's implied inflation expectation typically adjusts downward, often within the same trading session.
Oil price changes typically take 4-8 weeks to appear in headline CPI prints, meaning a sustained decline starting in May 2026 would begin showing up in June and July inflation releases. The pass-through to retail energy costs at the pump is faster, generally exceeding 80% within two to three weeks of a sustained move in wholesale crude benchmarks.
A decline from approximately $100 to the pre-conflict baseline of $70 per barrel would represent a roughly 30% drop, producing a proportionate compression in the energy component of headline CPI in economies where fuel costs carry a 7-10% basket weight. However, core inflation, which strips out energy and food, would adjust far more slowly due to persistent services prices and wage growth.
The catalyst was diplomatic, not operational: reports emerged of a preliminary US-Iran framework that reportedly includes provisions for reopening the Strait of Hormuz, through which approximately one-fifth of global oil supply transits. The market repriced the probability of resolution, though Iran's foreign ministry stated a final accord is not imminent and key disputes over nuclear enrichment remain unresolved.
The Hormuz-driven oil price surge reintroduced energy-price risk into a policy environment where the Fed, ECB, and Bank of England had begun cautiously signalling a shift toward easing after hiking cycles in 2022-2024. All three institutions reference energy-price developments as active inflation variables, meaning a sustained oil price decline could restore the easing headroom that the conflict disruption had delayed.