
KOSPI Loses 10% in a Day After One Unverified Media Report
2 hrs ago

Westpac shares have climbed 17.1% over the past 12 months, comfortably outpacing the S&P/ASX 200. Yet on 23 April 2026, Morgans analyst Damien Nguyen downgraded the stock to Sell, setting a price target that implies more than 11% downside from current levels. That tension sits at the centre of the Westpac share price debate heading into next week’s half-year results. With the stock closing at A$38.43 on 30 April 2026 and half-year FY2026 numbers due 5 May, the timing is pointed. A pre-result trading update has already flagged weaker revenues and higher credit impairment charges, lending weight to the bearish case. What follows is a breakdown of what the performance data actually shows, where the analyst consensus sits, how valuation metrics frame the risk, and what dividend investors need to weigh before the results land.
The headline number is strong. Westpac gained 17.1% over the trailing 12 months, more than double the S&P/ASX 200’s 6.6% return across the same window. For investors who bought a year ago, that is a clear outperformance story.
Westpac returned 17.1% over 12 months versus 6.6% for the S&P/ASX 200, a spread of more than 10 percentage points.
The 2026 year-to-date picture tells a different story. The shorter-term data points reveal momentum fading rather than building:
On 13 February 2026, the day Westpac reported Q1 FY2026 results, shares fell 1.2%. That session suggested the market was already shifting focus from the prior year’s gains toward near-term execution risk. The gap between the 12-month and YTD figures is not noise; it signals that much of the prior rally may already be reflected in the price.
The downgrade did not arrive in isolation. Ahead of the 5 May 2026 half-year results, Westpac issued a pre-result trading update that flagged three specific items: weaker revenues than expected, lower costs, and higher credit impairment charges. The revenue and impairment lines caught attention because they point in the same direction, suggesting margin and asset quality pressure arriving simultaneously.
Rising impairment charges across Australian banks are not isolated to Westpac; Bank of Queensland’s 1H26 results showed loan impairment expense jump from $3 million to $20 million year-on-year, with management flagging that historically low impairment levels may not persist as the macroeconomic environment deteriorates.
Morgans analyst Damien Nguyen moved the stock to Sell on 23 April 2026, citing limited growth prospects, execution risk, and a valuation that offers no meaningful margin of safety at current levels. The timing, less than two weeks before the half-year result, underscored the urgency of the call.
Morgans’ price target of A$34.04 implies approximately 11.4% downside from the 30 April close of A$38.43. That target sits below even the TradingView broker consensus average of A$34.75, meaning Nguyen’s view is marginally more bearish than the broader analyst community. For investors weighing the stock, a named analyst attaching a specific downside figure to a Sell rating provides a concrete reference point, not a vague caution but a quantified view of where fair value sits.
The Morgans downgrade is not an outlier. Multiple independent broker targets cluster well below the current share price, and the pattern is consistent enough to constitute a directional signal.
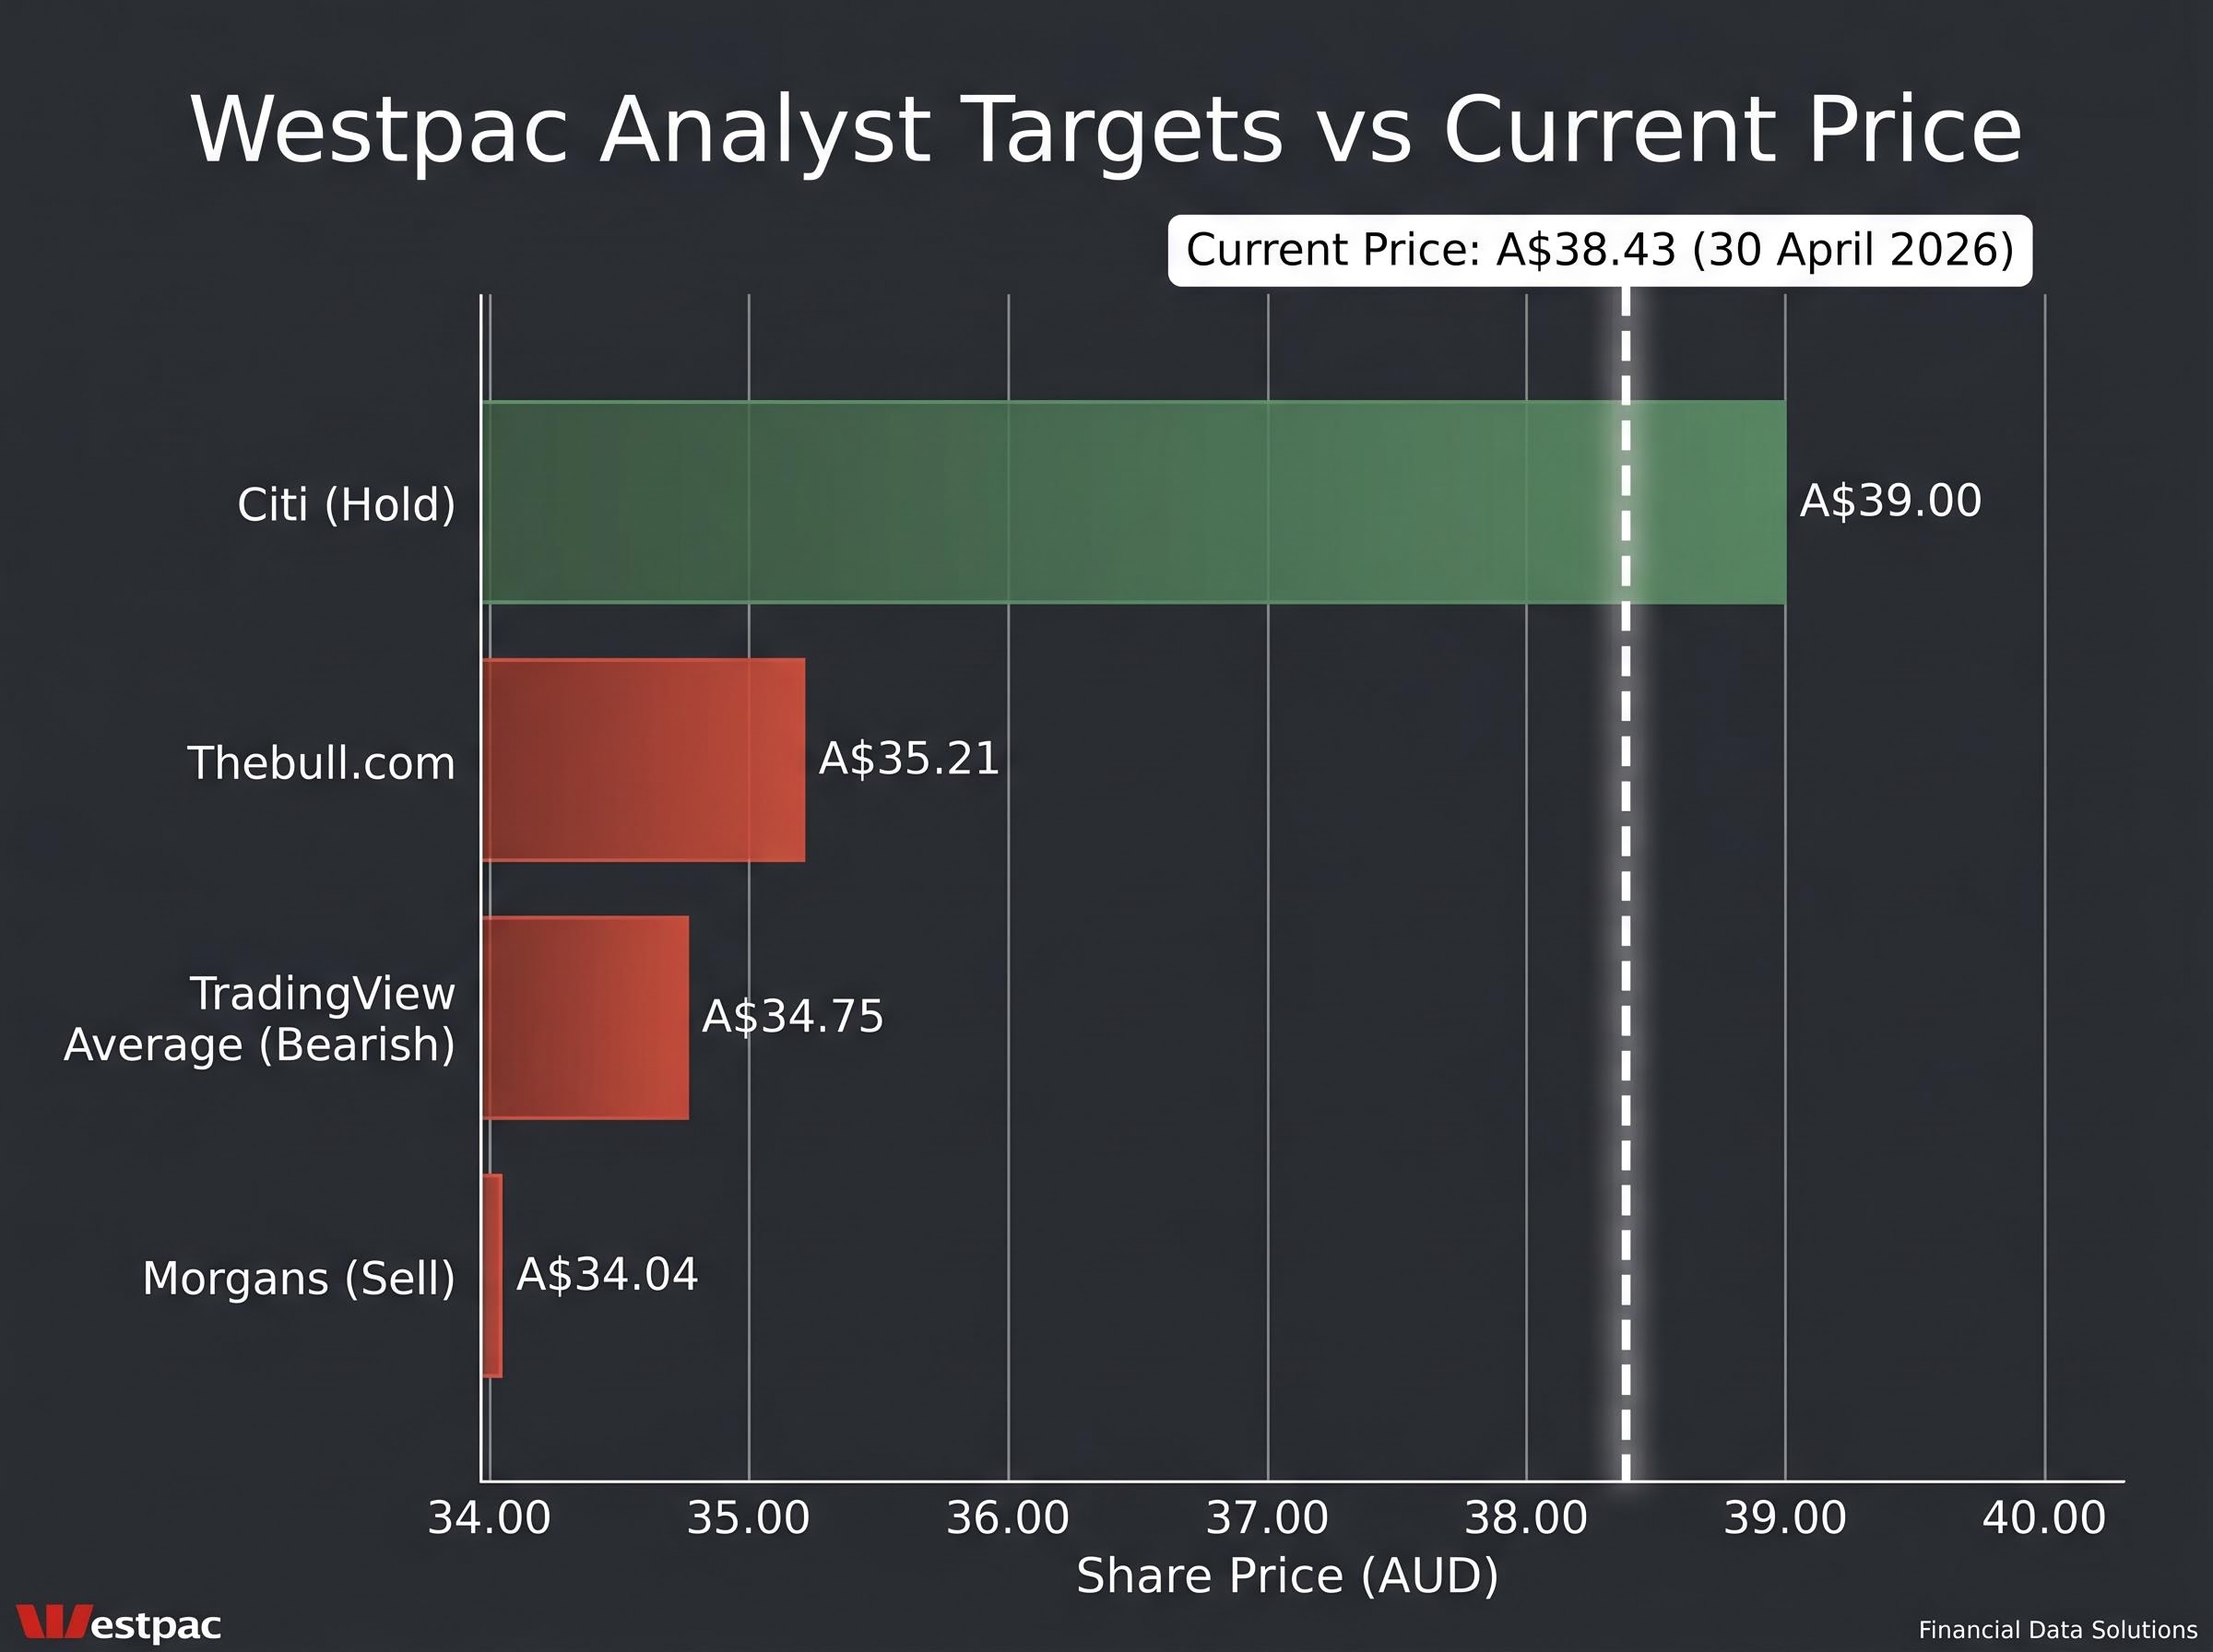
| Source | Rating | Price Target | Implied Move vs A$38.43 |
|---|---|---|---|
| Morgans | Sell | A$34.04 | -11.4% |
| TradingView consensus | Bearish | A$34.75 | -9.6% |
| Thebull.com | N/A | A$35.21 | -8.4% |
| Citi | Hold | A$39.00 | +1.5% |
The TradingView consensus range spans A$29.32 to A$40.00, but the average of A$34.75 lands roughly 9.6% below the current price. Citi’s Hold rating with a A$39.00 target is the constructive outlier, sitting near current levels. The overall consensus direction, as characterised by TradingView, is bearish. When three of four reference points imply 8-11% downside, the convergence carries weight.
A price-to-earnings (P/E) ratio measures how much investors are paying for each dollar of a company’s earnings. A higher number means the market is pricing in stronger future growth or is willing to pay a premium for perceived quality. The figure matters differently depending on the type of company.
A trailing P/E above 21 on a bank operating in a mature, competitive sector with limited revenue expansion prospects raises a specific question: what growth is the market paying for?
For a high-growth technology company, a P/E of 21 might be unremarkable. For an Australian major bank operating in a sector where loan book growth is steady but rarely accelerating, it suggests the share price has moved ahead of the earnings base. This is precisely the “no margin of safety” concern Morgans’ Damien Nguyen cited.
Australian bank overvaluation is not confined to Westpac; Morningstar’s Matt Wilkinson has flagged all four major banks as trading above fair value, with the S&P/ASX 200’s modest year-to-date gain almost entirely dependent on financials holding their current price levels.
The forward P/E of 18.15 implies the market expects earnings to grow into the valuation gap. The pre-result trading update, with its combination of weaker revenues and higher credit impairment charges, gives reason to scrutinise whether that earnings improvement will materialise on schedule.
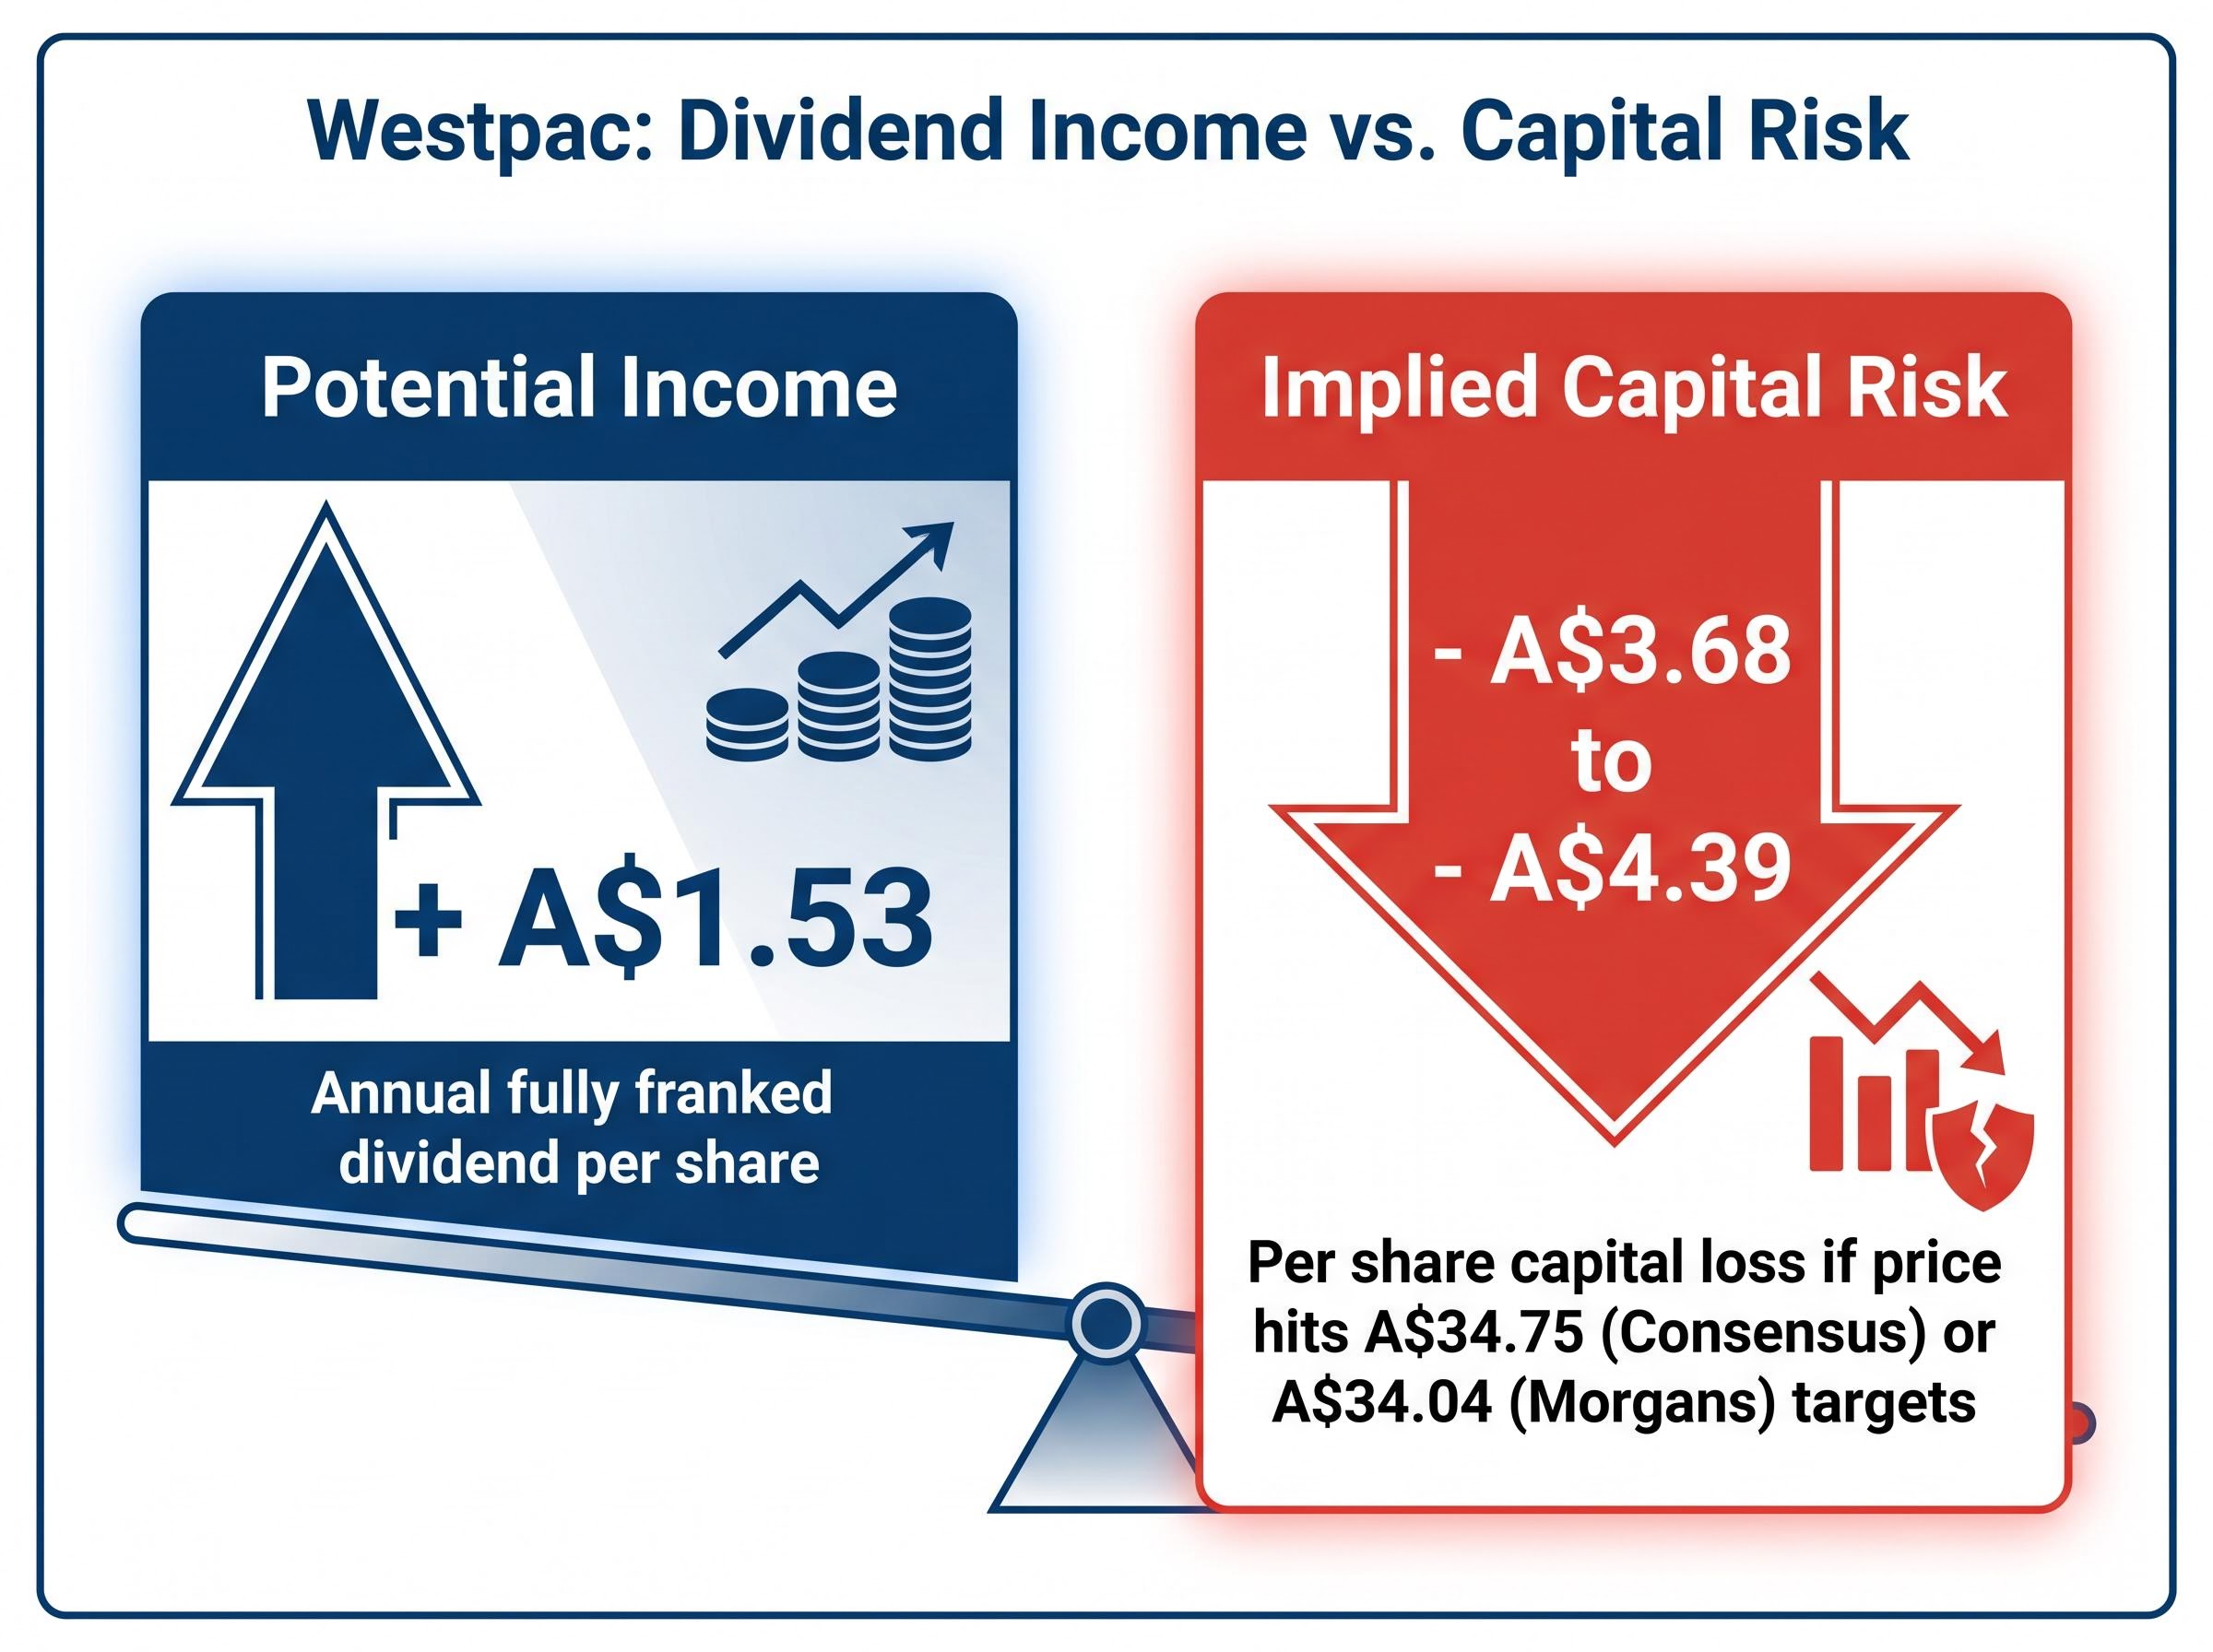
The income case for Westpac is genuine. A trailing fully franked dividend yield, based on a confirmed final FY2025 dividend of A$1.53 per share pending confirmation of interim dividend details, delivers a real cash return. The confirmed final FY2025 dividend of 77 cents per share (fully franked, paid 19 December 2025) underpins the figure. Even Morgans’ Damien Nguyen, while rating the stock a Sell, acknowledged that the income profile holds appeal for dividend-focused investors.
Fully franked dividends carry franking credits that represent company tax already paid on the earnings. For Australian resident shareholders, these credits can be used to offset personal tax liabilities, or in some cases generate a tax refund. A headline yield, once grossed up for franking credits at the 30% corporate tax rate, delivers a materially higher effective return. For retirees and low-tax-bracket investors, this distinction is significant.
A dividend investor’s total return has three components:
If Westpac shares were to move toward the Morgans target of A$34.04 or the consensus target of A$34.75 over the next 12 months, the capital loss would range from roughly A$3.68 to A$4.39 per share. Against annual dividends of A$1.53, the total return would turn negative even after collecting the dividend and franking benefit. Yield alone does not justify holding a stock trading well above where multiple brokers see fair value.
Key date: 5 May 2026, Westpac half-year FY2026 results release.
The variables converging next week are unusually concentrated. The 5 May result will land against a backdrop of pre-flagged revenue weakness, higher credit impairment charges, and an RBA rate outlook that includes three forecast 25bp cuts in May, June, and August 2026. Rate cuts create a mixed environment for banks: they can stimulate lending volumes but compress net interest margins, the spread between what a bank earns on loans and pays on deposits.
| Factor | Bull Case | Bear Case |
|---|---|---|
| Price Target | Citi: A$39.00 (Hold) | Morgans: A$34.04 (Sell) |
| Key Supporting Data | Q1 deposit growth A$12B; lending growth A$22B; statutory net profit A$1.9B (up 5% on 2H25 avg) | Pre-result update: weaker revenue, higher impairment charges; consensus target A$34.75 |
| Primary Risk Factor | Margin compression from three RBA rate cuts | Valuation stretch with trailing P/E at 21.39 |
Fitch Ratings affirmed in March 2026 that all four major Australian banks retain profiles with Stable Outlooks, providing a credit quality floor. The 5 May result is the near-term catalyst that will either validate the bearish consensus or give bulls fresh ammunition.
The Fitch credit quality assessment of Australia’s major banks has remained constructive across the sector, with CBA receiving an upgrade to AA in March 2026 shortly before Fitch affirmed Stable Outlooks for all four majors, providing a systemic credit floor even as individual bank earnings profiles diverge.
The 17.1% gain over 12 months is documented history. It happened, and shareholders who held through the period captured it. The question now is whether that return is a prologue or a peak.
The current price of A$38.43 sits above the consensus target of A$34.75, above the Morgans target of A$34.04, and above where the market’s own P/E arithmetic suggests a mature bank should trade. The 4.0% fully franked yield is a genuine positive, but it does not offset the capital risk implied by broker targets.
CEO Anthony Miller has expressed optimism about business and household credit demand, a counterpoint to the analyst caution that frames much of the current debate.
The 5 May half-year results are the next objective data point. What investors find in the revenue line, the impairment charges, and the margin guidance will determine whether the stock’s premium to consensus is justified or whether the bearish view carries the day. Until those numbers arrive, the evidence leans one way: the past was strong, the path forward is less certain.
Investors weighing whether to hold, reduce, or exit Westpac ahead of the 5 May result will find our comprehensive walkthrough of ASX portfolio positioning during inflation covers cash ETF alternatives, equity defensive strategies, and the historical case against reactive selling during high-CPI tightening cycles.
This article is for informational purposes only and should not be considered financial advice. Investors should conduct their own research and consult with financial professionals before making investment decisions. Past performance does not guarantee future results. Financial projections are subject to market conditions and various risk factors.
Westpac closed at A$38.43 on 30 April 2026, while the TradingView broker consensus average sits at A$34.75, implying approximately 9.6% downside from current levels.
Morgans analyst Damien Nguyen downgraded Westpac to Sell on 23 April 2026, citing limited growth prospects, execution risk, and a valuation that offers no meaningful margin of safety, with a price target of A$34.04 implying more than 11% downside.
Westpac's pre-result trading update flagged weaker revenues and higher credit impairment charges, lending support to the bearish analyst consensus ahead of the half-year FY2026 results due on 5 May 2026.
Westpac offers a fully franked trailing dividend yield based on A$1.53 per share annually, but if the share price moves toward broker targets of A$34.04 to A$34.75, the capital loss of roughly A$3.68 to A$4.39 per share would outweigh the dividend income and franking benefit.
Westpac's trailing P/E of 21.39 is considered elevated for a mature Australian bank with limited revenue expansion prospects, which is a core part of the valuation concern raised by Morgans and reflected in the broader bearish analyst consensus.


