Fed Holds Rates but Dot Plot Signals a Hike Before Year-End
3 hrs ago

Westpac posted a $1.9 billion quarterly profit in February 2026, yet the share price closed at $38.43 on 30 April 2026, sitting roughly where it started the year. The stock has slipped approximately ~0.18% year-to-date while the ASX 200 has fallen only 0.7% over the same period. That divergence between operating performance and share price momentum is the question this analysis sets out to resolve. With Westpac’s half-year results confirmed for 5 May 2026, the timing is pointed. What follows is a structured examination of what Q1 FY2026 results signal about the bank’s financial health, how the share price has responded across multiple timeframes, where analysts currently stand, and what the 5 May disclosure could mean for investors holding or considering WBC.
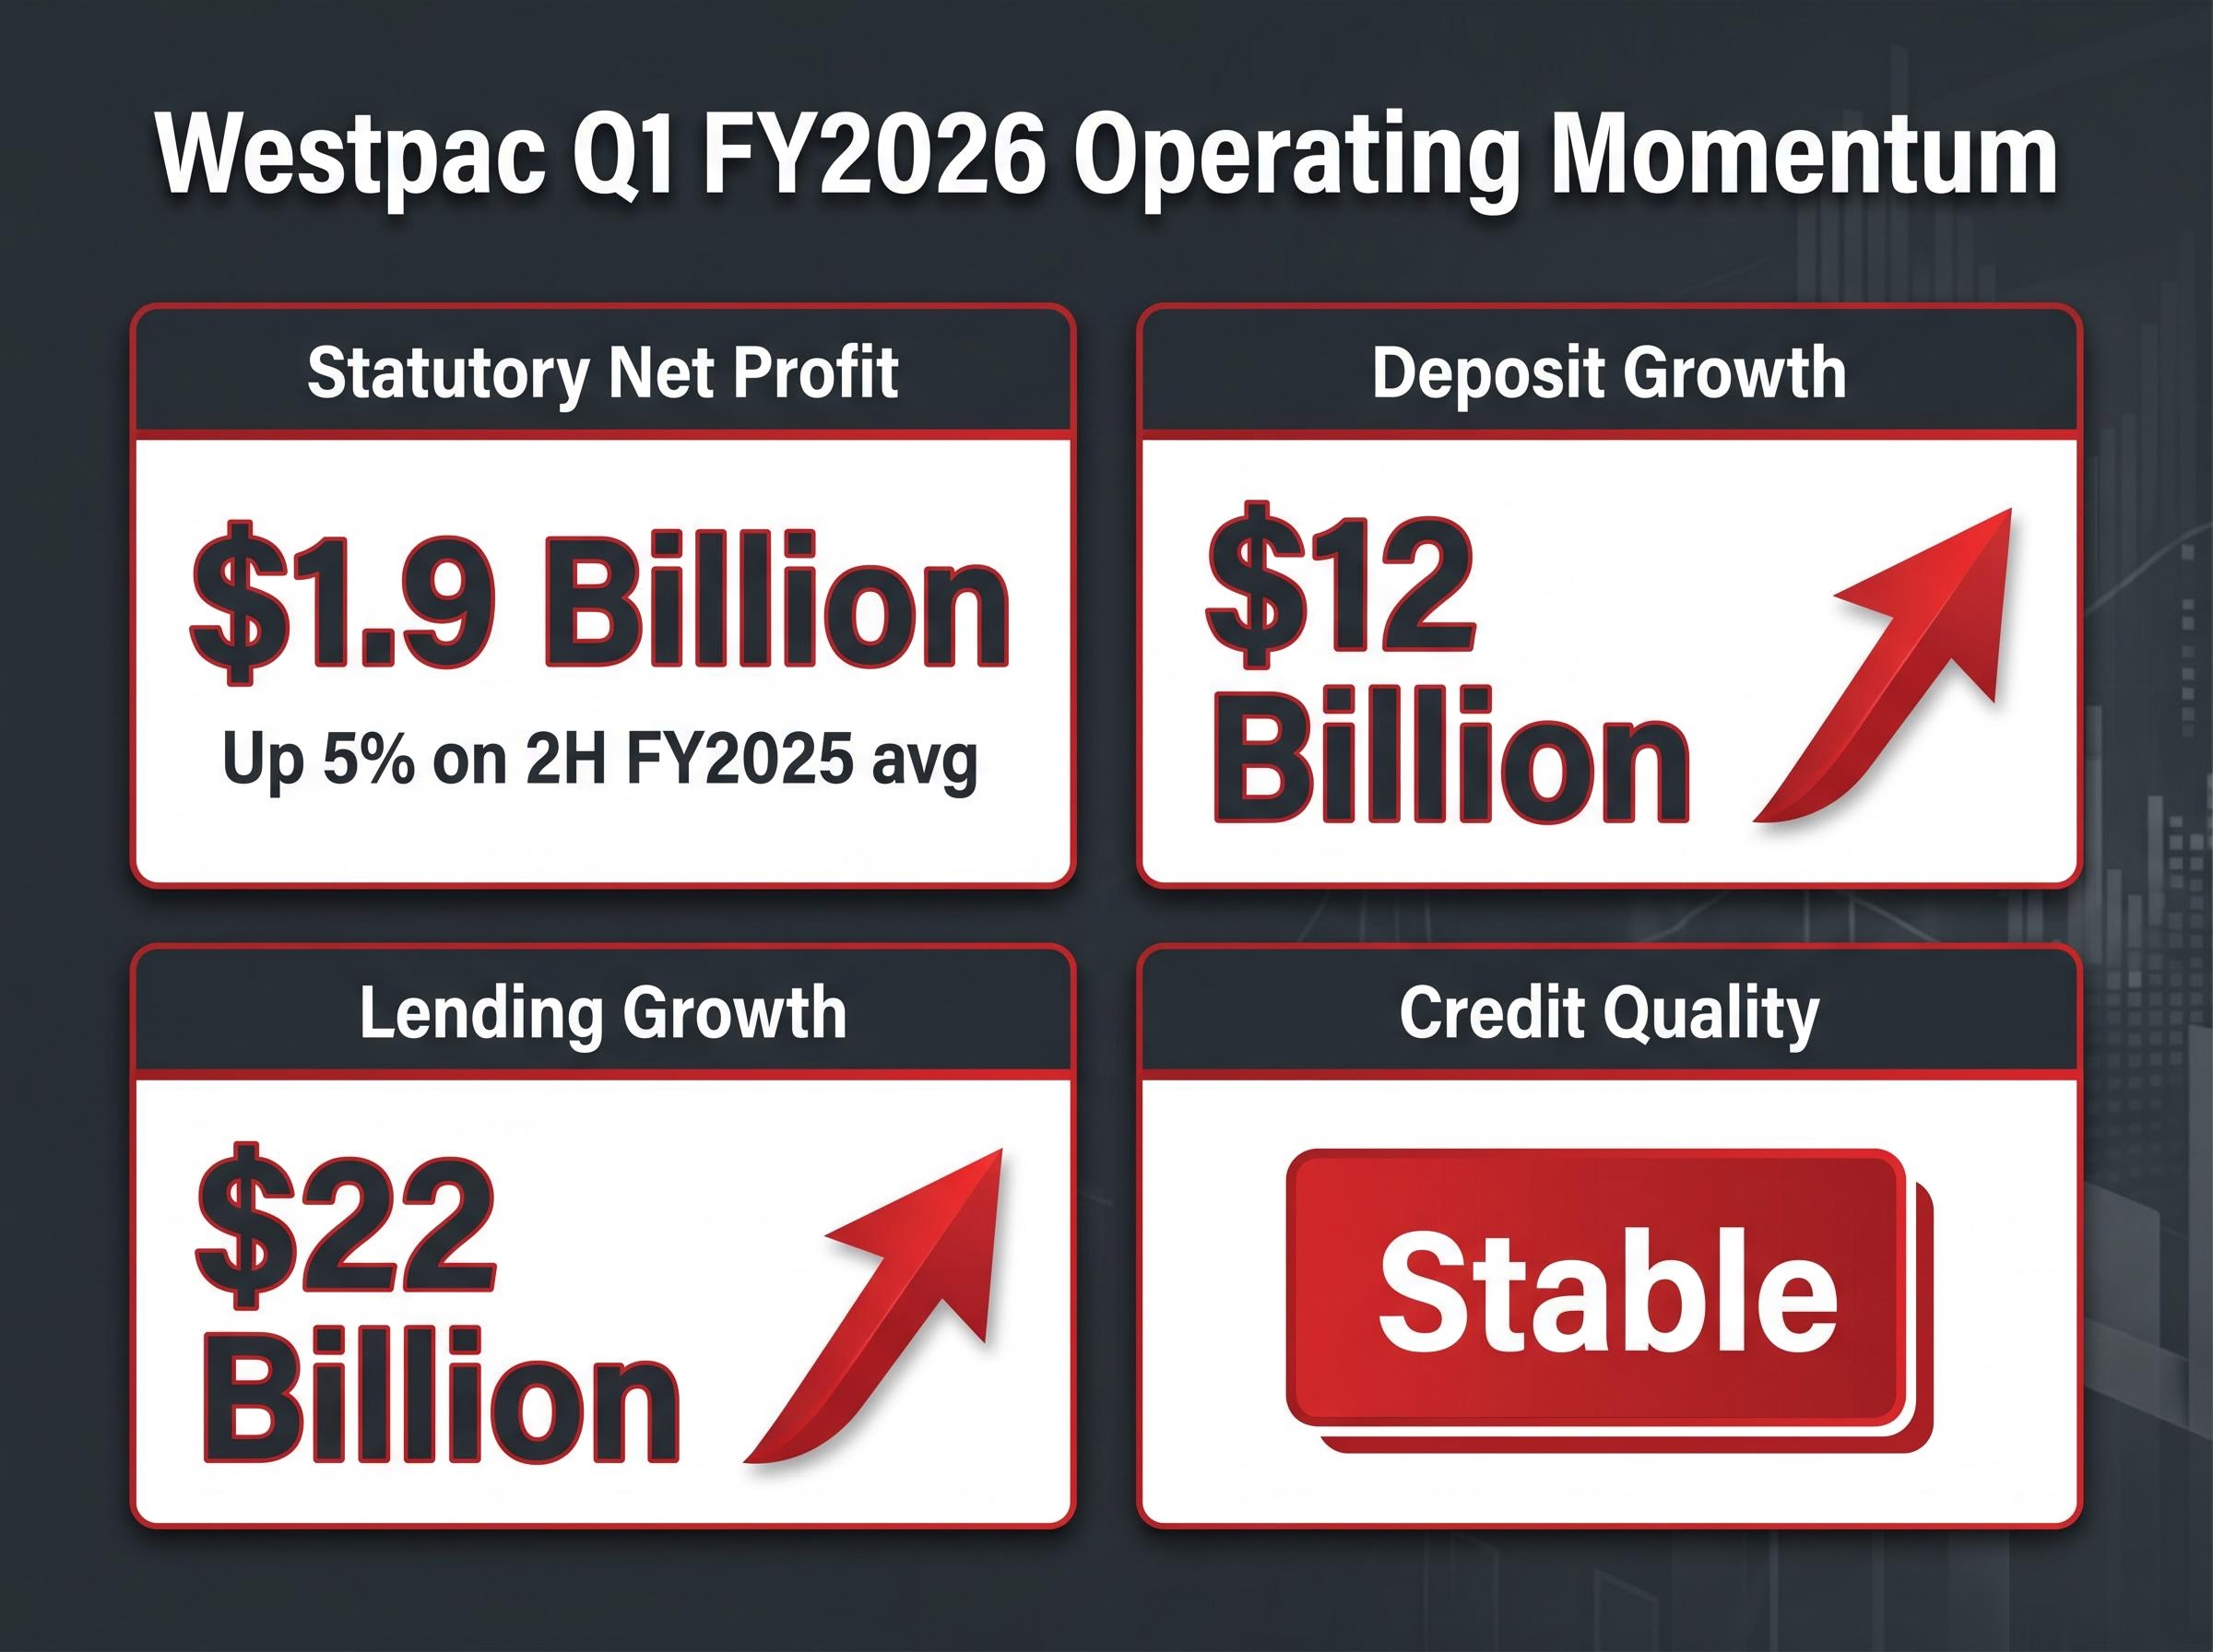
The headline number is strong. Westpac reported Q1 FY2026 statutory net profit of $1.9 billion, up 5% on the average quarterly result for the second half of FY2025. But the figures beneath the profit line tell a more instructive story about the bank’s operating momentum.
The $12 billion in deposit inflows and $22 billion in lending expansion reflect genuine balance sheet growth rather than margin compression masking a flatline. Deposit growth of that scale in a single quarter signals that Westpac is winning or retaining customer funds in a competitive rate environment, while the lending figure suggests sustained demand across household and business credit channels.
Westpac’s deposit-to-loan ratio surpassing 80% ahead of the Q1 result, a milestone that enabled the bank’s voluntary SEC deregistration by removing the need for US capital market compliance, provides structural context for why the $12 billion in quarterly deposit inflows represents a funding quality improvement rather than simply a volume metric.
CEO Anthony Miller characterised the results as evidence that the bank has “strong financial foundations” and the capacity to support stakeholders, citing ongoing resilience in household and business credit demand and a degree of optimism about the broader economic outlook.
Credit quality metrics were described as “stable” for the quarter, though that characterisation carries an implicit caveat: the rate environment that supported lending volumes in Q1 has since intensified, raising the question of whether “stable” can hold into the second quarter.
A single share price number tells an incomplete story. Three distinct timeframes reveal why the current trading level is less contradictory than it first appears.
The Q1 results release in February 2026 triggered a material short-term rally. Westpac shares reached an intraday high of approximately $42.13 on 13 February 2026, with the stock climbing further to a post-results peak close near $42.54 by approximately 20 February 2026.
The rally did not hold. From that peak, the stock retraced through March and April, settling into the $38 range. The prior session close on 29 April 2026 was $38.22, and the 30 April close of $38.43 places the stock down approximately ~0.18% for the calendar year, against the ASX 200’s more modest 0.7% decline.
Over the trailing 12 months, Westpac shares appreciated 17.1%, substantially outpacing the ASX 200’s 6.6% gain over the same period. The 2026 year-to-date high of $43.32 confirms a stock that reached cycle highs before pulling back, not one in structural decline.
The flat 2026 run, viewed against that 17.1% prior-year gain, reads more as consolidation than deterioration.
| Timeframe | WBC Performance | ASX 200 Performance |
|---|---|---|
| Post-results peak (Feb 2026) | Rally to ~$42.54 | N/A |
| 2026 YTD (to 30 April) | ~-1.3% | ~-0.7% |
| 12-month trailing | +17.1% | +6.6% |
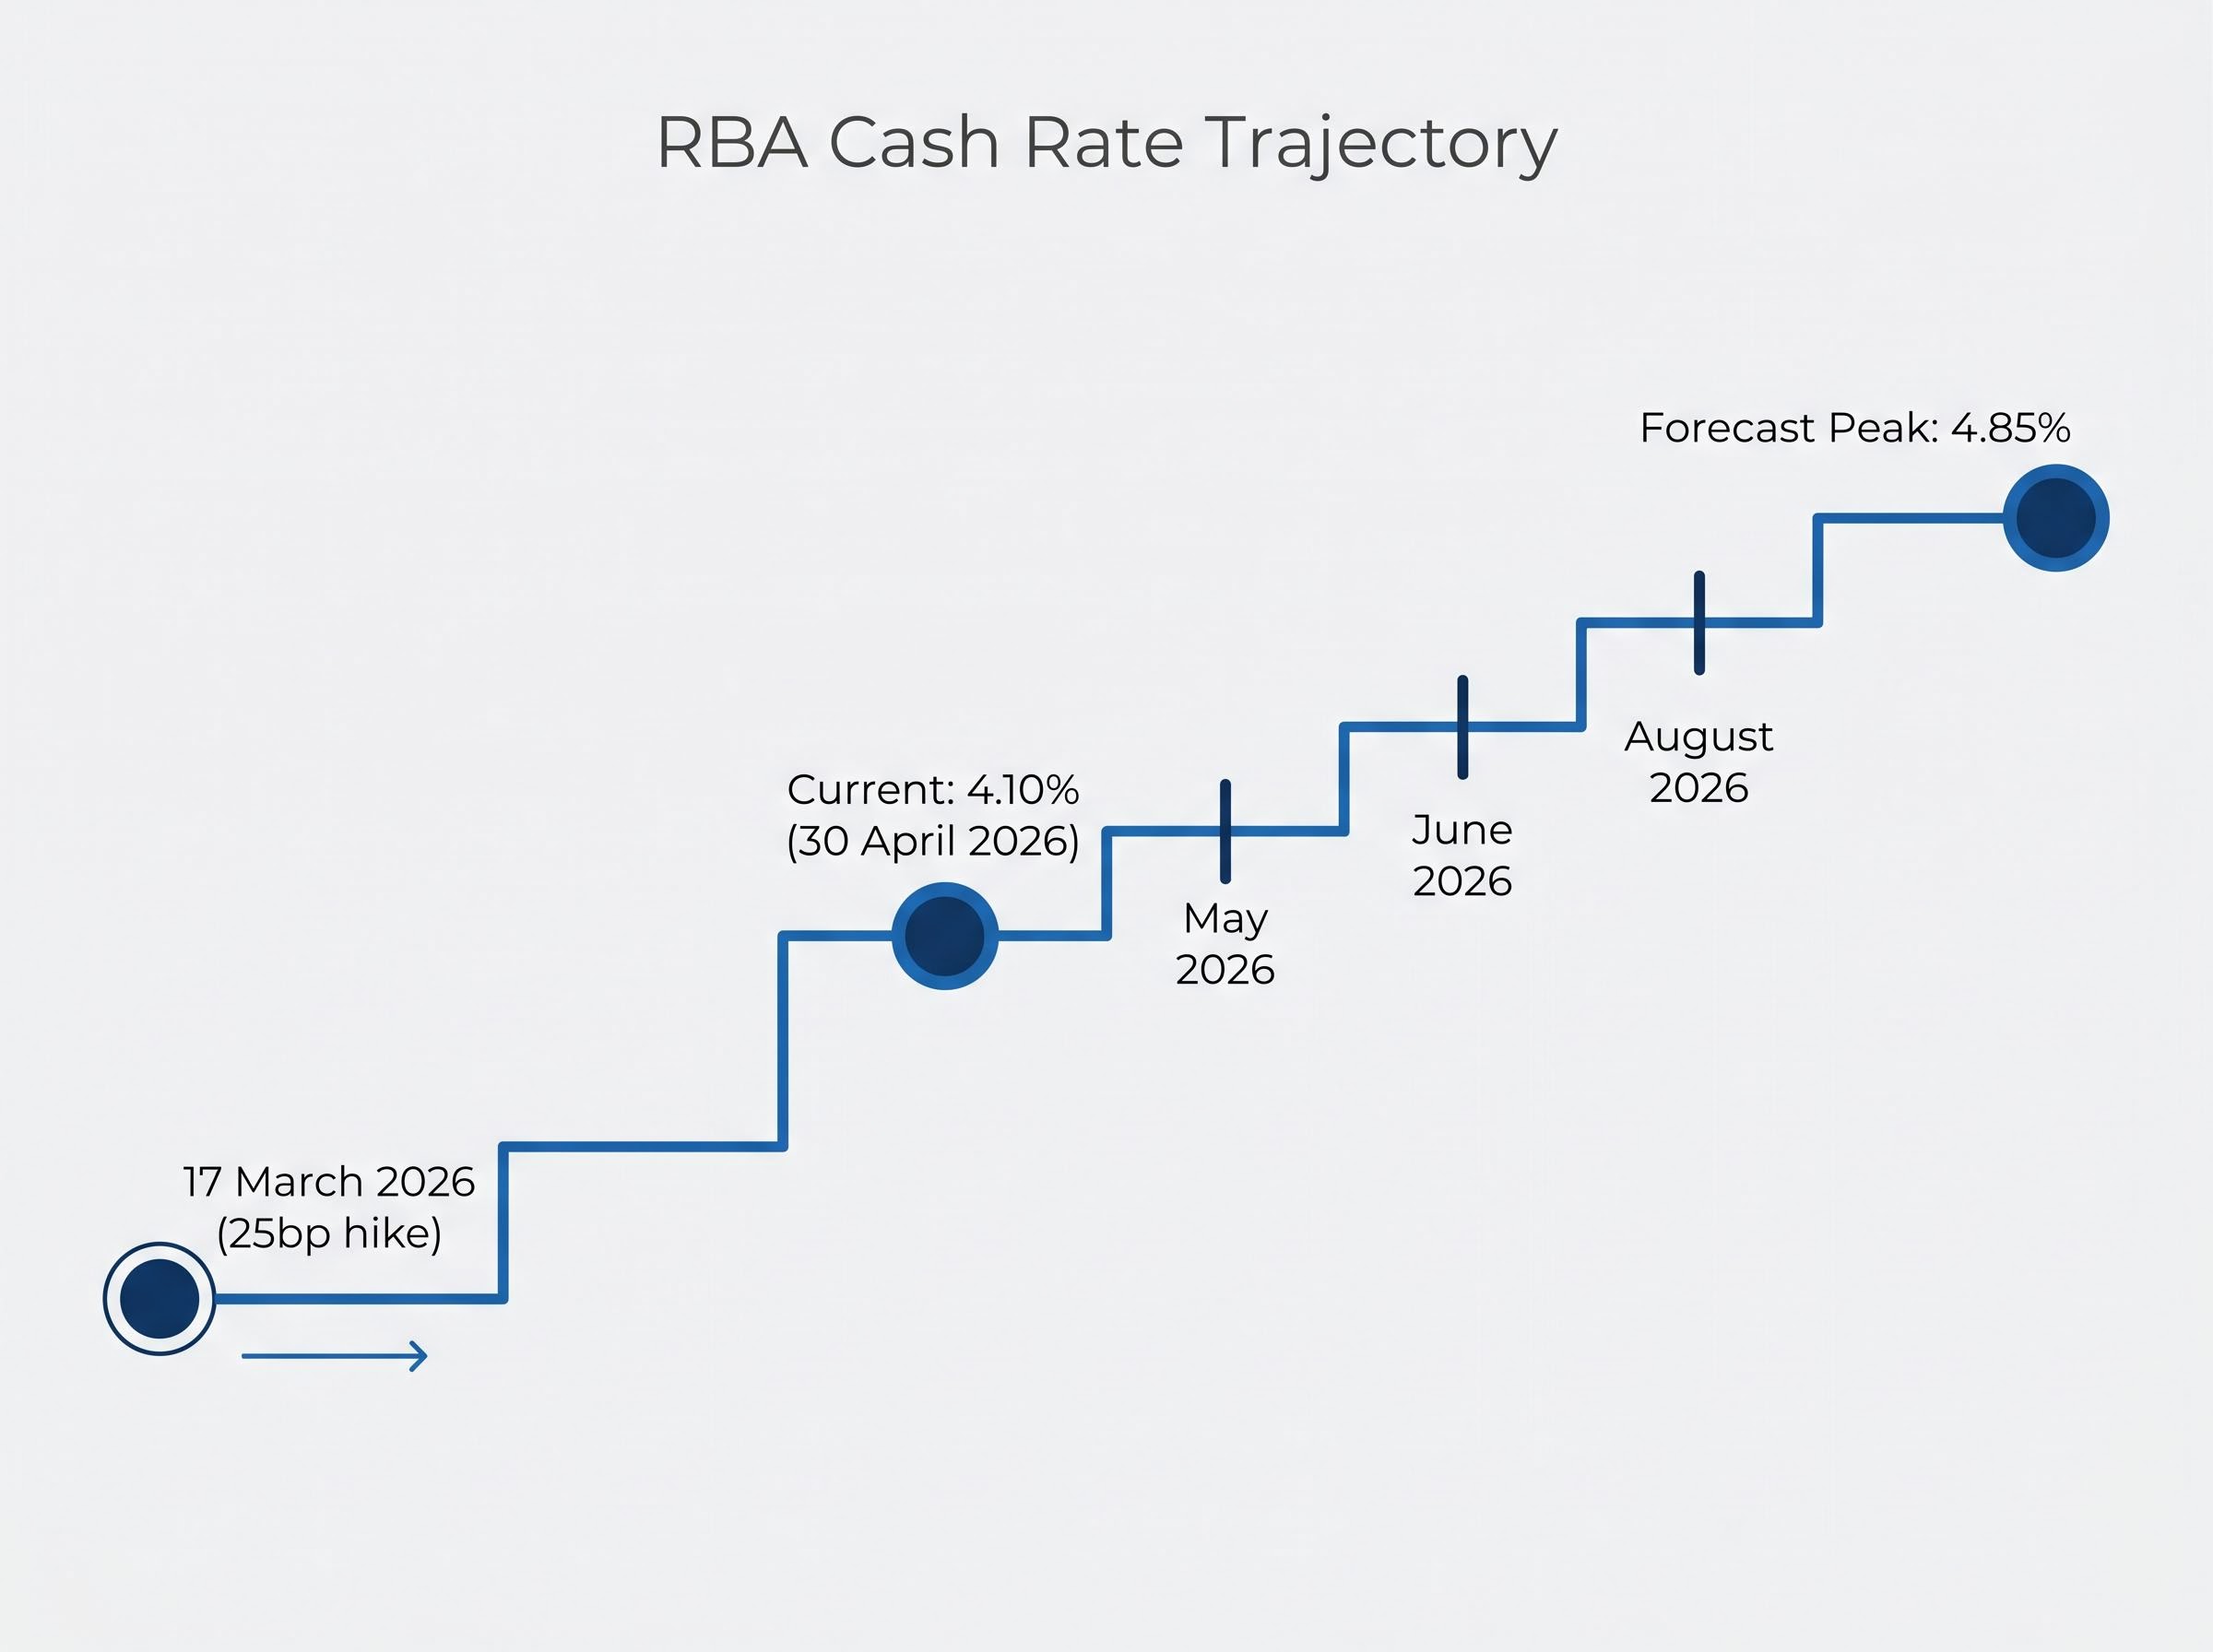
The Reserve Bank of Australia’s cash rate stands at 4.10% as of 30 April 2026, following a 25 basis point increase on 17 March 2026. That rate is not expected to stay where it is.
The RBA rate hike probability shifted materially in late April 2026 as Australia’s headline CPI surged to 4.6%, nearly double the top of the central bank’s 2-3% target band, lifting market pricing for a May move to 62% and reinforcing the trajectory toward the 4.85% forecast peak that sits at the centre of Westpac’s earnings outlook.
Forward forecasts point toward a potential peak of 4.85%, with further hikes anticipated across three upcoming decision dates:
The forecast peak of 4.85% would represent the highest RBA cash rate in over a decade, with direct implications for major bank earnings trajectories.
The mechanism cuts two ways for Westpac. Higher rates support net interest margins, the difference between what a bank earns on loans and what it pays on deposits. With $22 billion in lending growth added during Q1, an expanded loan book earns incrementally more income as rates rise.
The countervailing risk is equally direct. Sustained rate pressure intensifies cost-of-living stress on borrowers, particularly mortgage holders. If repayment strain worsens through Q2, Westpac’s credit quality metrics could deteriorate beyond the “stable” characterisation reported in Q1. Net interest margin (NIM), the spread between lending income and deposit costs, is the metric where this tension will show first, and it will be front and centre of the 5 May half-year disclosure.
Morgans analyst Damien Nguyen carries a Sell rating on Westpac, issued in April 2026. The concerns are specific: returns trailing those of big four peers, limited scope for revenue expansion in a mature Australian banking market, and ongoing execution risk as the bank works to close operational gaps.
Nguyen acknowledged that cost management and balance sheet resilience are partial offsets, but assessed them as insufficient to justify the current share price relative to peer valuations.
The broader consensus aligns with that caution. The analyst consensus rating is Underweight/Sell, with the average 12-month price target sitting at approximately $34.75-$34.87, roughly 9-10% below the 30 April close of $38.43.
| Metric | Value |
|---|---|
| Consensus Rating | Underweight / Sell |
| Average 12-Month Target | ~$34.75-$34.87 |
| High Target | $40.00 |
| Low Target | $29.32 |
| Median Target | ~$34.23 |
| Trailing Fully Franked Yield | 4.0% |
| Expected 1H FY2026 Interim Dividend | A$0.55 |
Even Nguyen conceded that Westpac’s dividend profile holds appeal for income-focused investors. The trailing fully franked dividend yield of 4.0% (based on $1.53 per share in total annual dividends) is a material draw in a rate environment where cash alternatives are competitive but lack franking credits.
The expected 1H FY2026 interim dividend of A$0.55, with an anticipated ex-dividend date of 8 May 2026 and payment date of 26 June 2026, gives income investors a near-term catalyst that sits independent of the growth or capital appreciation thesis.
Westpac reports half-year results on 5 May 2026. This is the moment when Q1’s $1.9 billion profit trajectory is either confirmed by a second quarter of comparable performance or complicated by deteriorating conditions.
Three variables warrant specific attention in the release:
The RAMS mortgage portfolio sale to a Pepper Money, KKR, and PIMCO consortium will register as a $75 million post-tax charge in the 1H26 reported result, separating the statutory profit figure from the underlying operating performance that analysts and income investors will focus on.
The interpretive lens for 5 May is the gap between Q1 management optimism, led by CEO Anthony Miller’s commentary on resilient credit demand, and the sell-side scepticism embodied by Morgans’ Sell rating. The result will narrow or widen that gap.
If the result reinforces Q1 momentum, a retest of the post-Q1 high around $42-$43 becomes a plausible near-term scenario. If credit quality or margin data surprises to the downside, the analyst consensus target range of $29.32-$40.00 becomes the more relevant frame for positioning.
The core tension is straightforward. Westpac is performing: profit up 5%, $22 billion in lending growth, credit quality stable, and a 4.0% fully franked yield on offer. Yet the analyst consensus places the average 12-month target approximately 10% below the current price of $38.43.
The peer comparison sharpens the point. CBA has gained approximately 7.79% year-to-date in 2026 (closing at $173.66 on 30 April), against Westpac’s approximate ~0.18% decline. The banking sector is not the problem. The question is Westpac’s relative position within it.
CBA’s credit rating upgrade to AA by Fitch in March 2026, with the Stable outlook signalling confidence in earnings quality, reinforces the divergence the article identifies: institutional analysts are differentiating within the big four on fundamentals, and CBA’s lower wholesale funding costs compound the competitive gap with Westpac that the 7.79% versus flat YTD comparison reflects.
CBA’s approximate 7.79% YTD gain versus Westpac’s approximate 1.3% YTD decline illustrates that investors are differentiating within the big four, not retreating from Australian banks as a category.
Two distinct investor profiles emerge from the data:
The bank is earning. The market is unconvinced the current price reflects fair value for what comes next. 5 May is where that argument gets resolved, or at least clarified.
This article is for informational purposes only and should not be considered financial advice. Investors should conduct their own research and consult with financial professionals before making investment decisions. Past performance does not guarantee future results. Financial projections are subject to market conditions and various risk factors.
Westpac closed at $38.43 on 30 April 2026, down approximately 1.3% year-to-date in 2026, despite reaching a cycle high of $43.32 earlier in the year and rallying to around $42.54 following its strong Q1 FY2026 results in February.
Analyst consensus is Underweight/Sell with an average 12-month price target of around $34.75-$34.87, roughly 9-10% below the 30 April close, due to concerns about returns trailing big four peers, limited revenue growth in a mature market, and ongoing execution risk.
The three key metrics to monitor are net interest margin direction following the March 2026 RBA rate hike, whether credit quality has remained stable or deteriorated, and whether the declared interim dividend meets the market expectation of A$0.55 per share.
Westpac is expected to declare a 1H FY2026 interim dividend of A$0.55 per share, with an anticipated ex-dividend date of 8 May 2026 and a payment date of 26 June 2026, offering a trailing fully franked yield of approximately 4.0%.
Higher RBA rates support Westpac's net interest margins on its expanded loan book, but also increase borrower repayment stress; with the cash rate at 4.10% and a forecast peak of 4.85%, credit quality deterioration is the key downside risk to monitor.