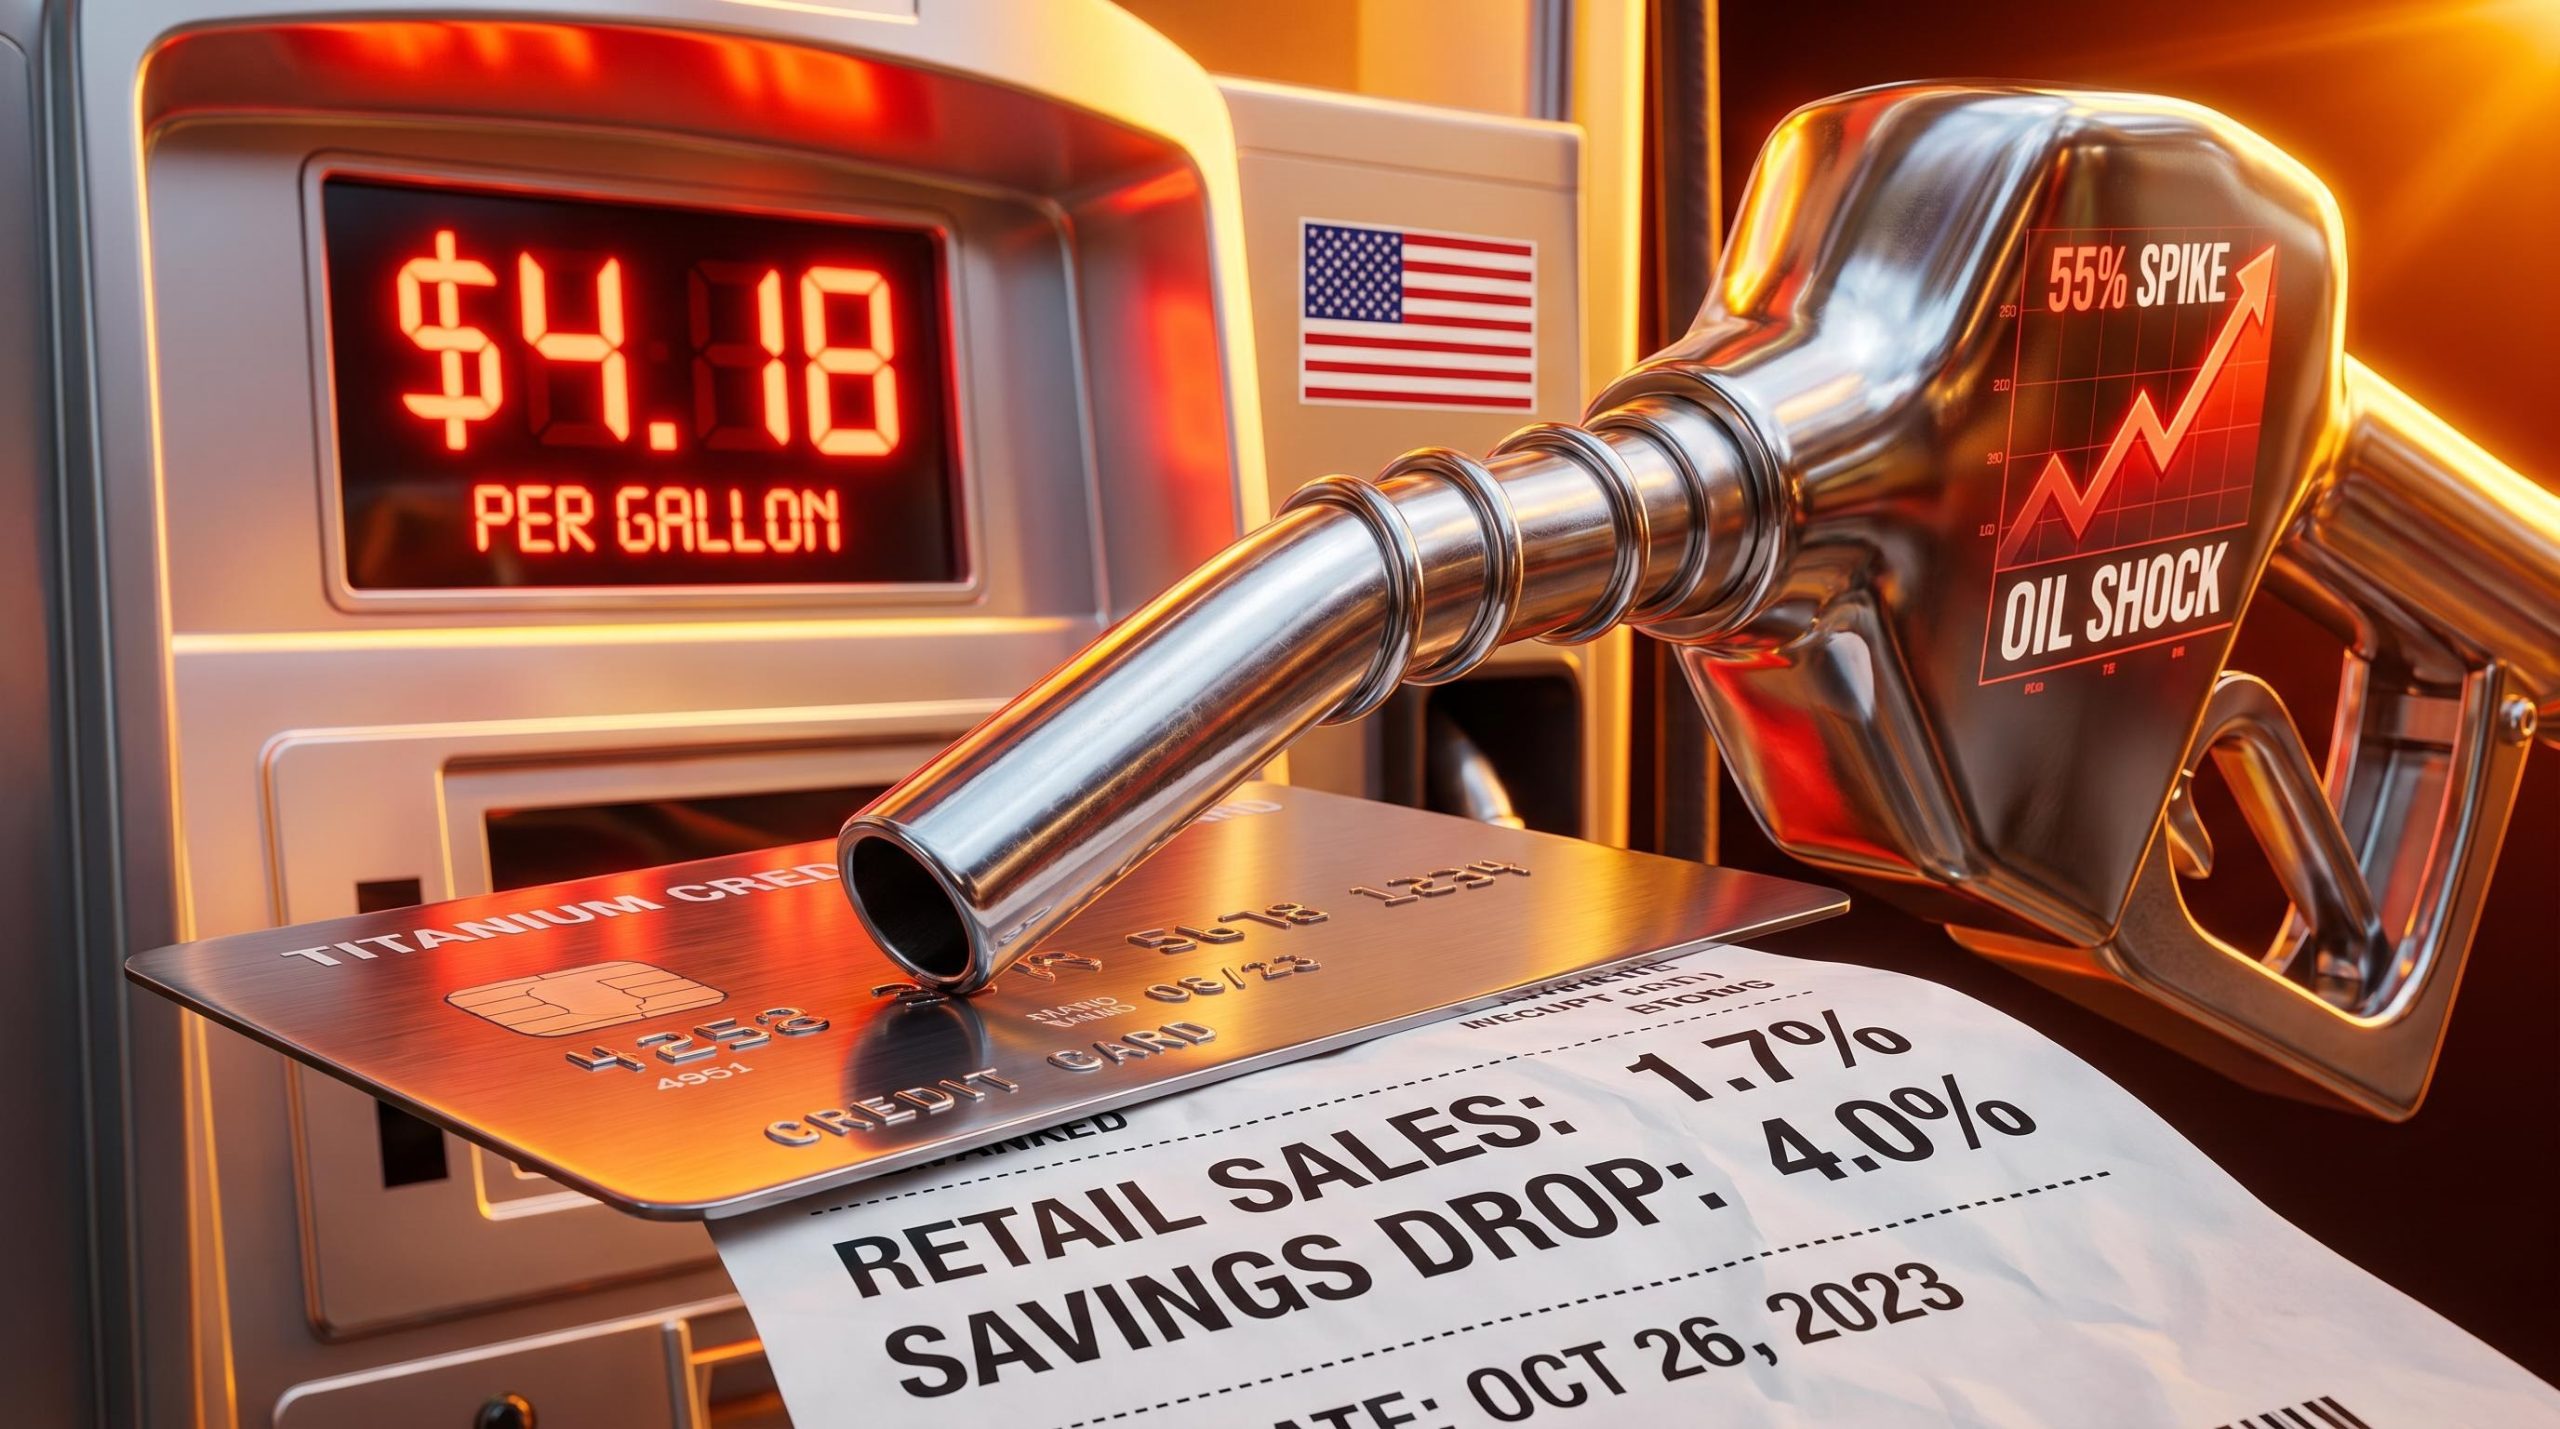
Crude oil has spiked 55% following the recent geopolitical energy shock, yet retail activity in the United States continues to surge. US retail sales unexpectedly jumped 1.7% in March 2026, creating a striking contradiction between soaring fuel costs and aggregate consumer spending.
UBS economist Paul Donovan recently warned that developed economies are operating on borrowed time. He cautions that financial markets are ignoring the true weight of the Iran conflict and the resulting Middle East supply disruptions.
This US economy outlook requires a clear look beneath the aggregate spending data to understand the underlying mechanics of consumer behaviour. The surface numbers suggest unshakeable resilience, but savings drawdowns and a K-shaped economic divide are temporarily masking a painful, inevitable correction in purchasing power. Investors relying solely on top-line retail data risk mispricing the most significant macroeconomic threat of the year.
The Surface Illusion of the Unbreakable American Consumer
The aggregate consumer spending metrics from early spring 2026 present a picture of an economy shrugging off international crises. Bank of America data shows total credit card spending per household increased 4.3% year-over-year in March 2026, marking the strongest performance since early 2023.
This momentum culminated in a 1.7% surge in US retail sales last month, representing the largest single-month increase in a year. Federal Reserve Vice Chair Michael Barr pointed to this exact data on 26 March 2026, noting that resilient consumer spending continues to support solid economic growth.
The advance US Census Bureau retail estimates for March 2026 confirm this unexpected spike, demonstrating an annual increase of 4.0 percent that initially appears to validate the narrative of an unbreakable consumer base.
However, this aggregate strength is deceptive and heavily reliant on specific, unsustainable consumer behaviours. The headline numbers aggregate the spending of all income tiers, obscuring the financial strain building underneath the surface.
| Economic Metric | Historical Baseline | Current 2026 Reality |
|---|---|---|
| Personal Savings Rate | 10-15% (1950s-1980s) | 4.0% (Feb 2026) |
| Retail Sales Growth | Moderate Growth | +1.7% (Mar 2026) |
| Credit Card Spending | Stable Baseline | +4.3% YoY (Mar 2026) |
Investors must look past the optimistic financial headlines they see daily. Understanding why strong retail data does not equal long-term market safety provides the analytical lens needed to navigate the coming quarter.
When big ASX news breaks, our subscribers know first
How Savings Depletion Masks True Economic Strain
Consumers use accumulated savings as a financial buffer to absorb sudden price shocks without immediately changing their lifestyle. When the cost of basic goods rises rapidly, households initially maintain their consumption habits by drawing down bank balances rather than cutting back on purchases.
The personal savings rate measures the percentage of disposable income that individuals save rather than spend. A sustained drop in this metric signals future vulnerability, as it indicates consumers are depleting their reserves to fund everyday expenses.
This mechanism explains why early 2026 US private demand growth has continued tracking at an expansionary 2-3% despite rising costs. The February 2026 US personal savings rate dropped to 4.0%, falling from 4.5% in January 2026.
The official BEA personal saving data confirms this downward trajectory, illustrating exactly how households are liquidating their remaining financial buffers to fund increasingly expensive daily necessities.
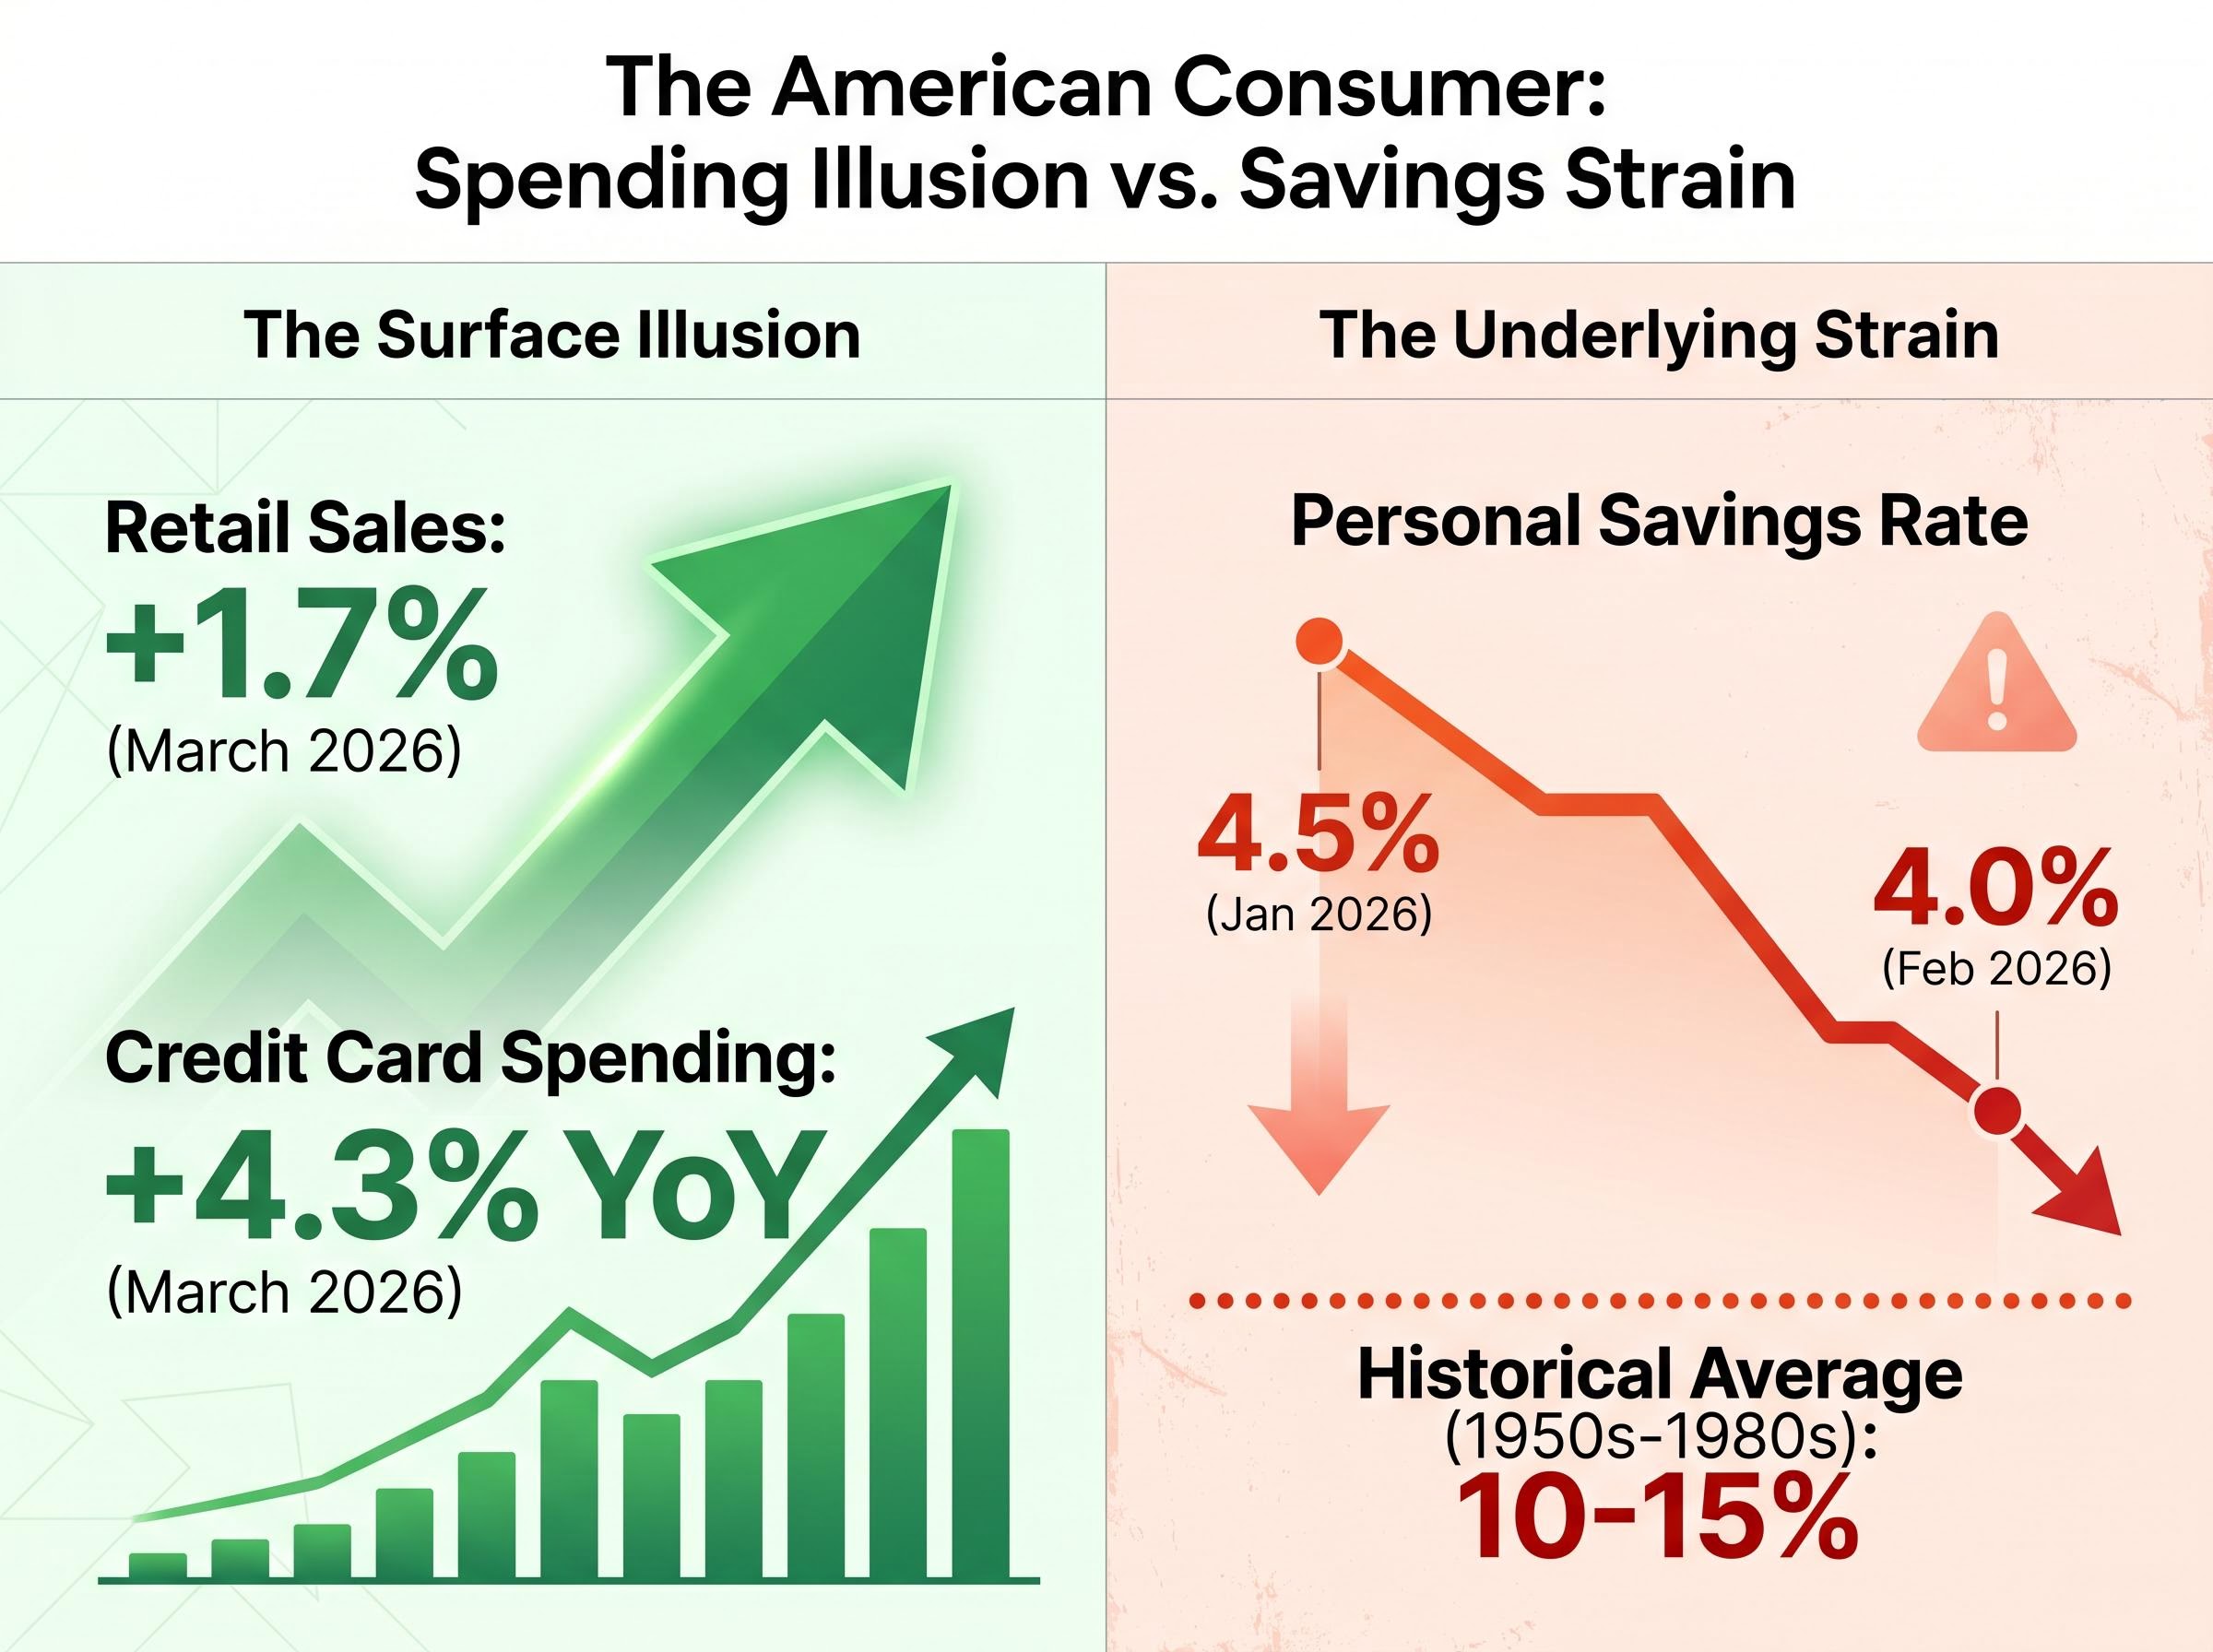
For historical context, savings rates averaged 10-15% from the 1950s through the 1980s. Donovan warns that current spending behaviour is a temporary illusion of economic health rather than a sign of true resilience.
When the savings buffer finally runs dry, the delayed adjustment in purchasing power hits the retail sector all at once. Clarifying savings rate data as a leading indicator of consumer exhaustion empowers investors to spot the cracks before they appear in corporate earnings reports.
The Diverging Reality of Fuel Burden Across Income Tiers
Dissecting the aggregate spending data reveals the distinctly K-shaped nature of current consumption. Higher-income earners, who spend a smaller fraction of their total budget on energy, are artificially inflating the overall retail numbers through continued discretionary spending.
Meanwhile, the rising cost of energy is placing a highly disproportionate burden on lower-income Americans. The national average for US retail gasoline prices reached $4.18 per gallon in late April 2026.
This price point creates vastly different economic realities depending on household income:
Top Income Quintile: Maintains high discretionary spending levels, absorbing fuel cost increases with minimal lifestyle adjustments or reliance on accumulated wealth. Middle Income Bracket: Experiencing steady margin compression as transportation costs eat into funds previously allocated for dining out and entertainment. * Bottom Income Quintile: Over 18 million US households are now spending an additional 5% of their post-tax income strictly on transportation fuel.
Federal Reserve Observations on Consumer Shifts
The Federal Reserve noted subtle changes in purchasing patterns in its April 2026 Beige Book. The central bank reported a noticeable consumer shift toward groceries and personal care amid rising concerns regarding the Middle East conflict.
These shifts toward basic necessities historically precede broader spending contractions across the wider economy. Demonstrating exactly where the economic foundation is cracking first gives investors insight into which retail sectors are most vulnerable to an impending pullback.
For investors exploring how these localized fuel burdens affect broader equity markets, our detailed coverage of historical gasoline price signals walks through the correlation between $4.00 breaches and subsequent S&P 500 declines over the last three decades.
The Strait of Hormuz Timeline and the Mathematical Breaking Point
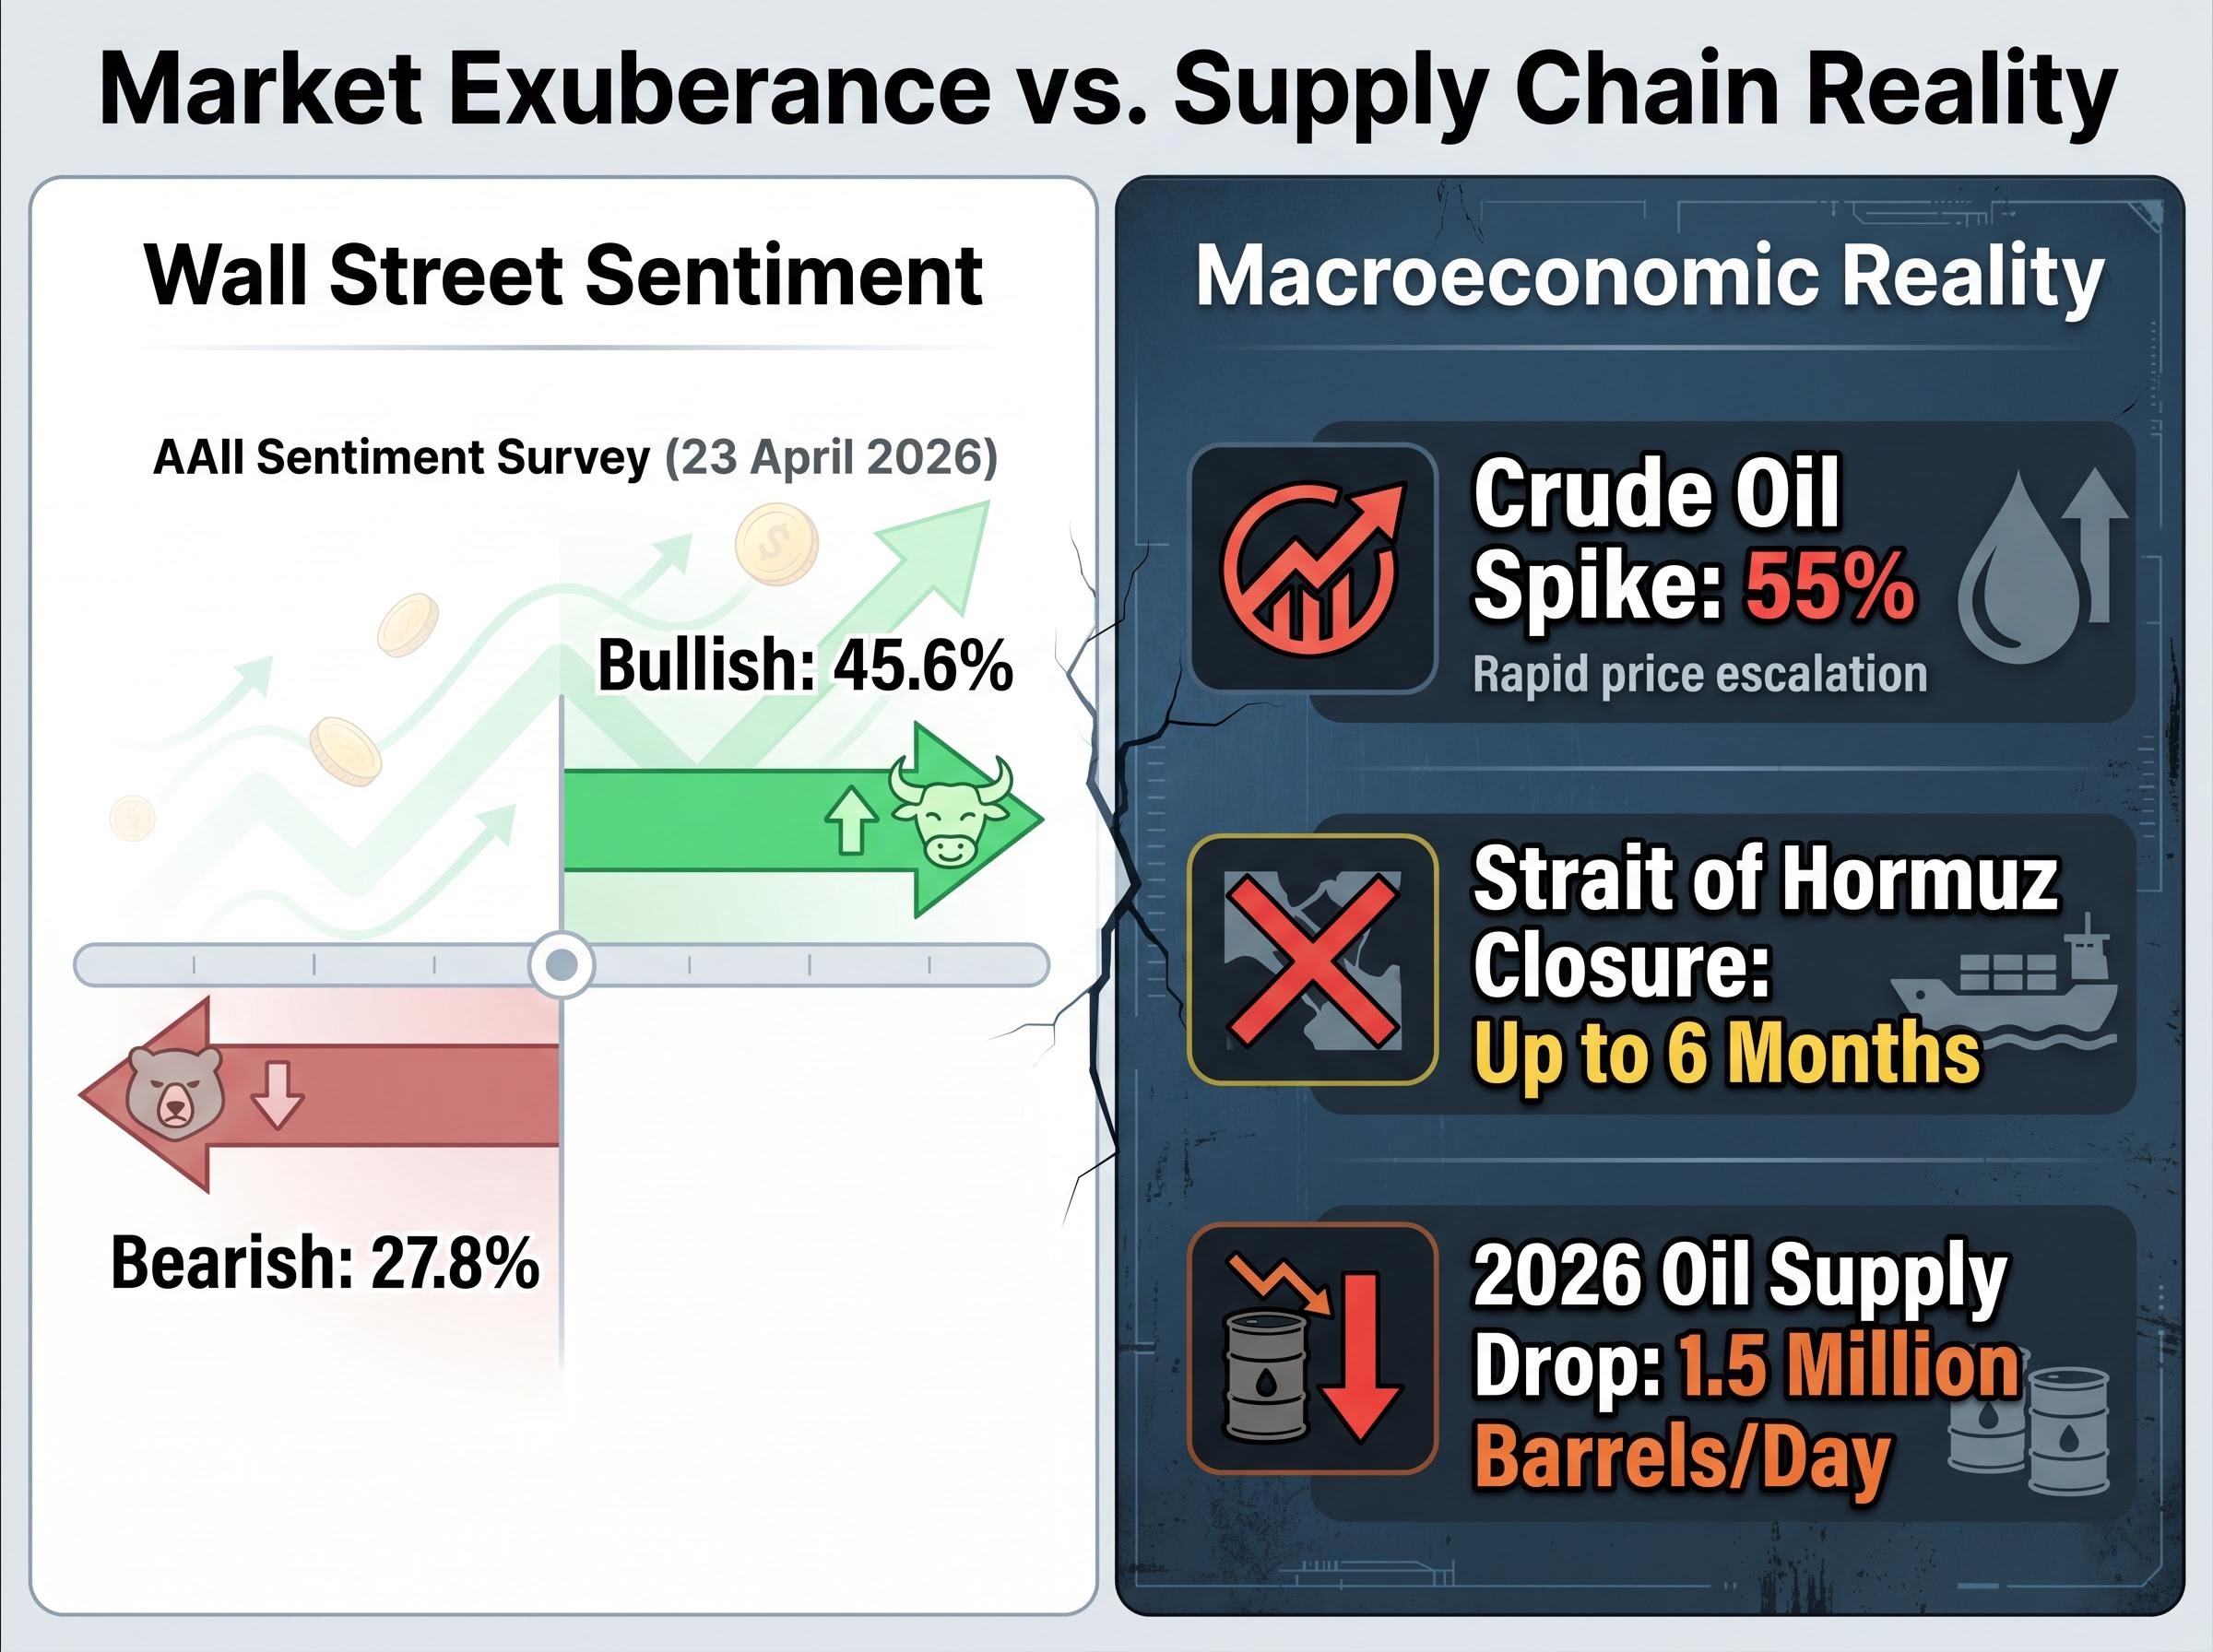
The physical realities of the Strait of Hormuz closure are enforcing a strict mathematical timeline on global supply chains. Shipping traffic is currently at a standstill, and industry estimates suggest it will take up to six months to safely reopen the major maritime chokepoint.
The geopolitical conflict has already triggered a 55% surge in oil prices and is projected to cause a global oil supply drop of 1.5 million barrels per day in 2026. Consumers can only absorb price shocks of this magnitude with savings for a finite period before structural inflation forces a hard adjustment.
Major institutions are already recalculating their macroeconomic outlooks based on this supply deficit, with some models now placing the 12-month US recession probability at nearly 50 percent if structural inflation remains elevated.
Past performance does not guarantee future results, and financial projections regarding commodity prices are subject to rapidly changing geopolitical conditions.
Prolonged shipping closures anchor inflation expectations in a way that temporary political shocks do not. Donovan highlighted the specific danger of this prolonged supply crisis in an April 2026 update.
Economist Commentary on Disruption “The longer the Strait of Hormuz is closed, the less market impact US President Trump’s early morning social media posts are likely to have. The war-related burden and affordability concerns are rising, and events in the Gulf will heavily influence US affordability perceptions primarily via gasoline prices,” Donovan said.
This commentary provides a concrete timeline for the macroeconomic risks ahead. It allows investors to project when the delayed consumer reckoning is most likely to materialise in corporate earnings calls over the next two quarters.
Wall Street Exuberance Versus Main Street Reality
A stark disconnect exists between accumulating geopolitical risks and the current exuberance in equity markets. Behavioural finance principles explain that investors often dismiss or underprice risks they cannot easily quantify in immediate earnings models.
This collective dismissal is visible in current market psychology metrics. The AAII Sentiment Survey for 23 April 2026 recorded bullish sentiment at 45.6%, while bearish sentiment sat at only 27.8%.
The eventual consumer spending collapse serves as the likely catalyst that will force markets to finally price in this geopolitical reality. Directly connecting the macroeconomic consumer analysis to immediate stock market positioning highlights the danger of blindly following the current bullish herd.
Readers interested in the disconnect between equity valuations and macroeconomic fundamentals will find value in our deep-dive into current S&P 500 warning signals, which examines how the market is mispricing historical correlations between major energy shocks and subsequent index declines.
The Inevitable Collision of Energy Shocks and Empty Wallets
The aggregate spending strength visible in current retail data is a mathematical mirage funded by finite household savings. The estimated six-month disruption in the Strait of Hormuz guarantees a prolonged period of elevated costs that will inevitably exhaust the remaining consumer buffer.
Investors must monitor credit card default rates, personal savings drawdowns, and retail sector downgrades to spot the exact turning point in consumer capitulation. The lowest-earning households are already flashing warning signs, and that financial pressure is steadily moving upward through the middle class.
Corporate leadership is already sounding the alarm on these margin pressures, as roughly two-thirds of major index companies have flagged rising energy costs during their first-quarter earnings calls.
This article is for informational purposes only and should not be considered financial advice. Investors should conduct their own research and consult with financial professionals before making investment decisions.