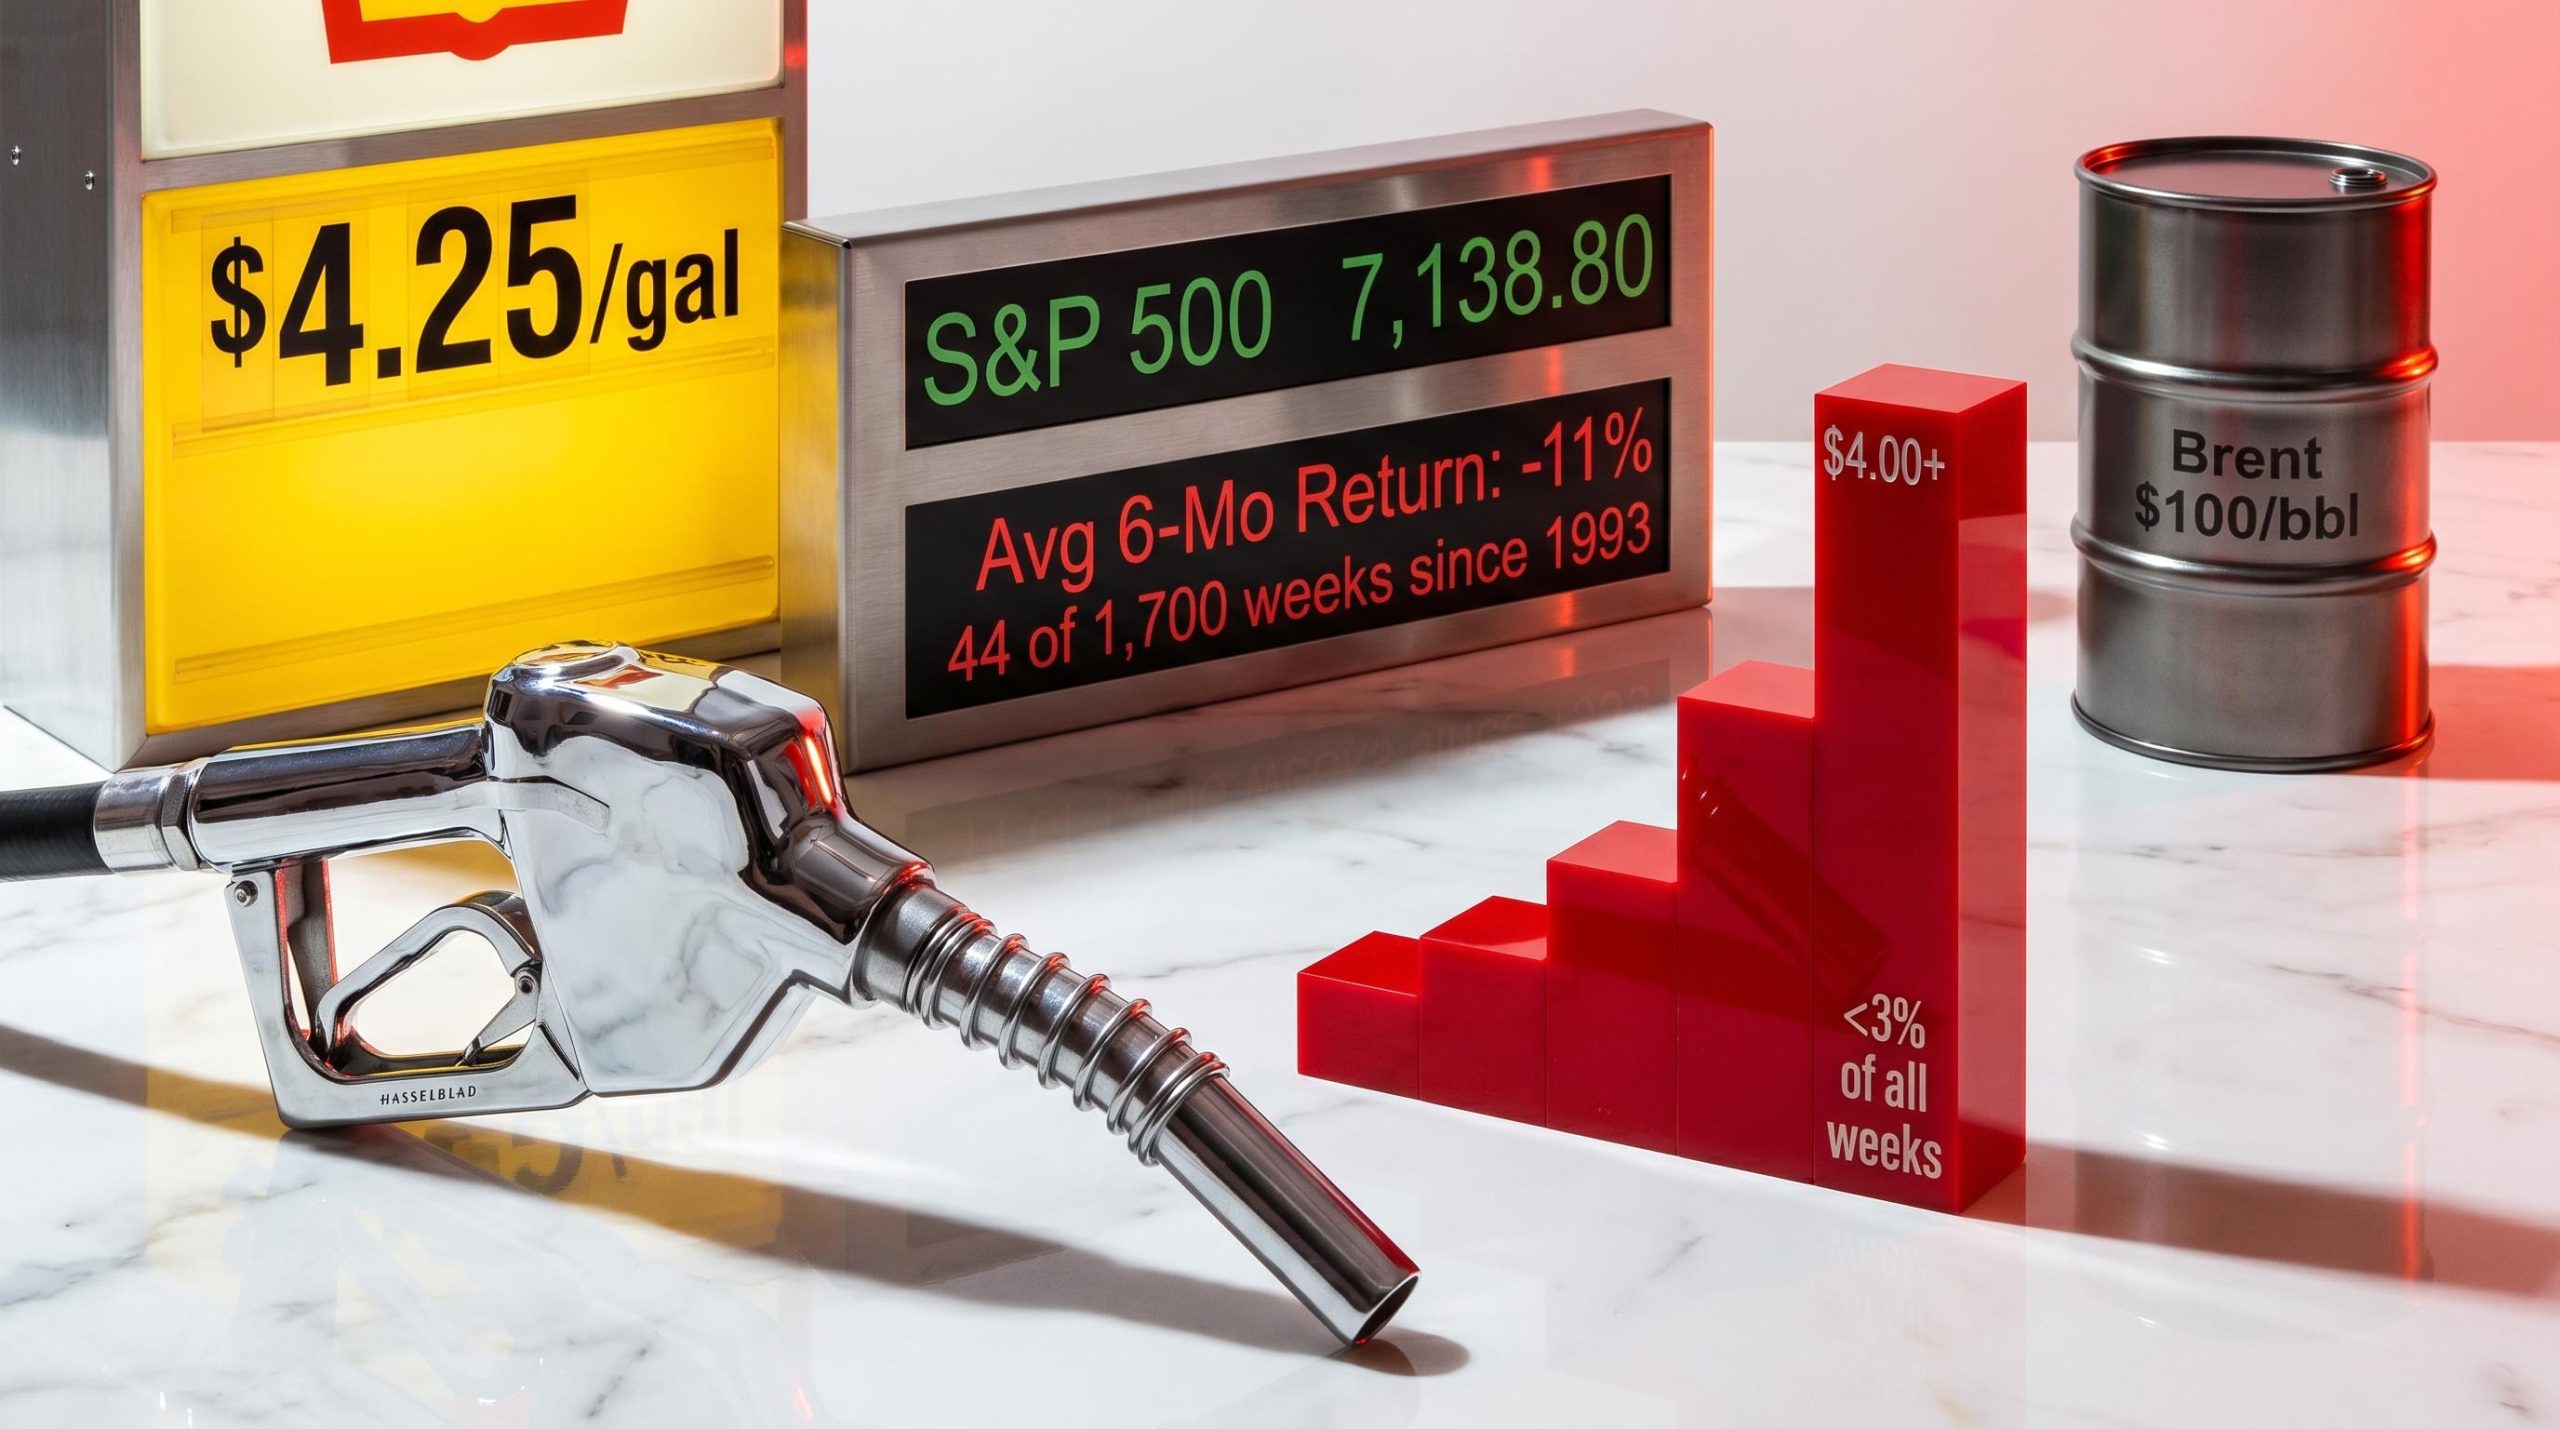
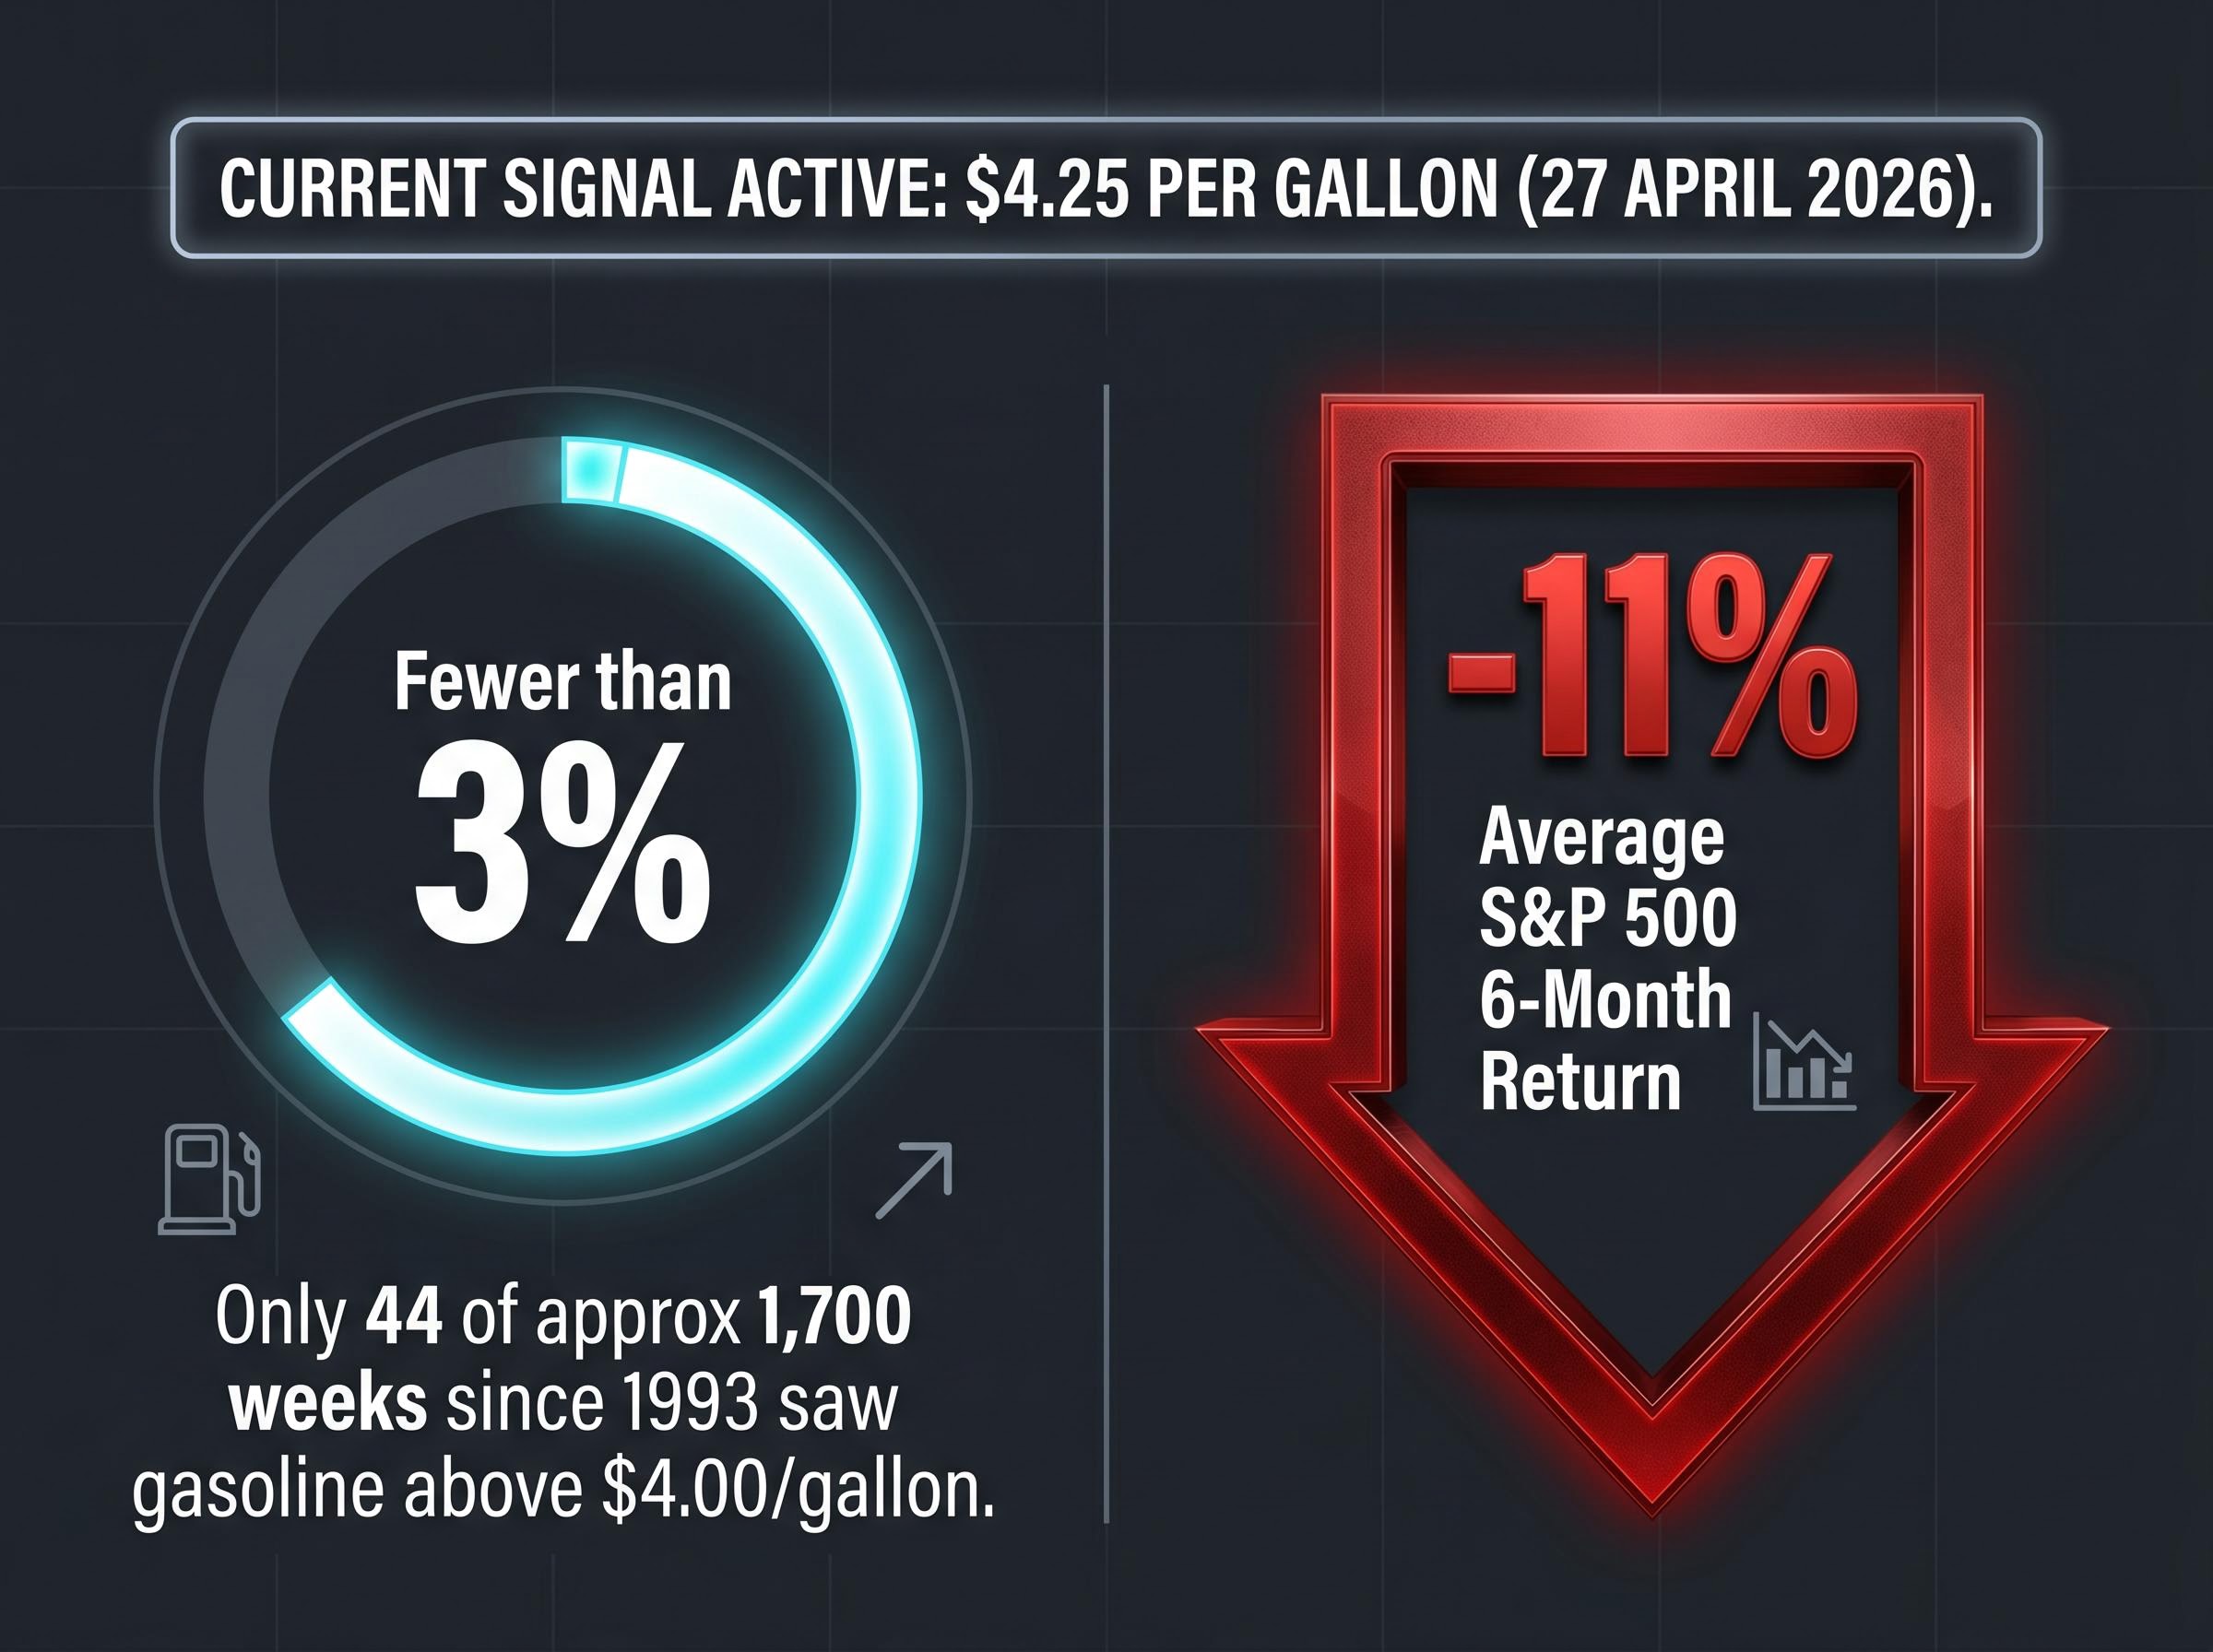
U.S. average gasoline prices hit $4.25 per gallon for the week ending 27 April 2026, according to the Energy Information Administration (EIA). That price level has been reached in fewer than 3% of all weeks since 1993. In every prior instance when prices cleared $4.00, the S&P 500 averaged an 11% decline over the following six months.
The S&P 500 has clawed back its entire March decline, returning to approximately 7,138.80 as of 28 April 2026, and most commentary frames that recovery as evidence the worst is behind markets. But the energy shock that triggered the original selloff has not simply persisted; it has deepened. Brent crude has surpassed $100 per barrel for the first time since 2022, gasoline is up roughly 45% year-to-date, and consumer confidence dropped to 49.80 in April from 53.30 in March.
What follows is a walk through the statistical record behind gasoline as a stock market warning signal, an explanation of how high fuel costs translate into equity losses, and an assessment of why the current recovery may be masking a historically unusual set of conditions rather than resolving them.
The S&P 500 looks recovered. The underlying picture is more complicated.
The headline number is encouraging. The S&P 500 fell roughly 9% from its March peak to a low of approximately 6,525.11, then rallied back to approximately 7,138.80 by 28 April 2026. On the surface, that is a complete round trip.
The complication is what happened underneath that rebound. The Iran conflict and Strait of Hormuz closure, the catalyst for the original selloff, have not reversed. Brent crude started 2026 near $65 per barrel and has since cleared $100. Gasoline is up approximately 45% year-to-date. Consumer confidence has deteriorated, not stabilised. The index recovered while the underlying energy shock was still expanding, not contracting, and that distinction matters.
Three conditions that drove the March decline remain unresolved:
- The Strait of Hormuz remains closed, restricting a significant share of global oil transit
- Brent crude sits above $100 per barrel, up more than 50% from its January level
- U.S. retail gasoline prices have reached multi-year highs, with the $4.25 per gallon reading exceeding the EIA’s own forecast peak of $3.70
A market returning to near-record levels feels reassuring. When the catalyst for the original decline is still actively worsening, that recovery becomes a data point worth interrogating rather than celebrating.
When big ASX news breaks, our subscribers know first
A historically rare gasoline signal with a poor track record for stocks
The EIA’s weekly data for the period ending 27 April 2026 placed the U.S. average price across all grades at $4.25 per gallon. The last time prices reached comparable levels was August 2022.
What makes this reading analytically significant is its rarity. Since 1993, when the EIA began tracking weekly average prices in its current format, gasoline has exceeded $4.00 per gallon in only 44 of approximately 1,700 weeks. That is fewer than 3% of all weeks in a dataset spanning more than three decades.
The forward return data associated with those 44 weeks is stark.
Following the 44 weeks since 1993 in which U.S. average gasoline prices exceeded $4.00 per gallon, the S&P 500 averaged an 11% decline over the subsequent six months.
| Gasoline Price Level | Weeks Above This Level (Since 1993) | Approximate % of All Weeks | S&P 500 Average 6-Month Return |
|---|---|---|---|
| Above $4.00/gallon | 44 | Fewer than 3% | Approximately -11% |
When an indicator fires this infrequently and has historically pointed in the same direction with this consistency, it warrants serious attention, particularly when the prevailing market narrative is optimistic. The current print of $4.25 does not sit at the threshold of this signal; it sits well above it.
How high gasoline prices travel from the pump into stock prices
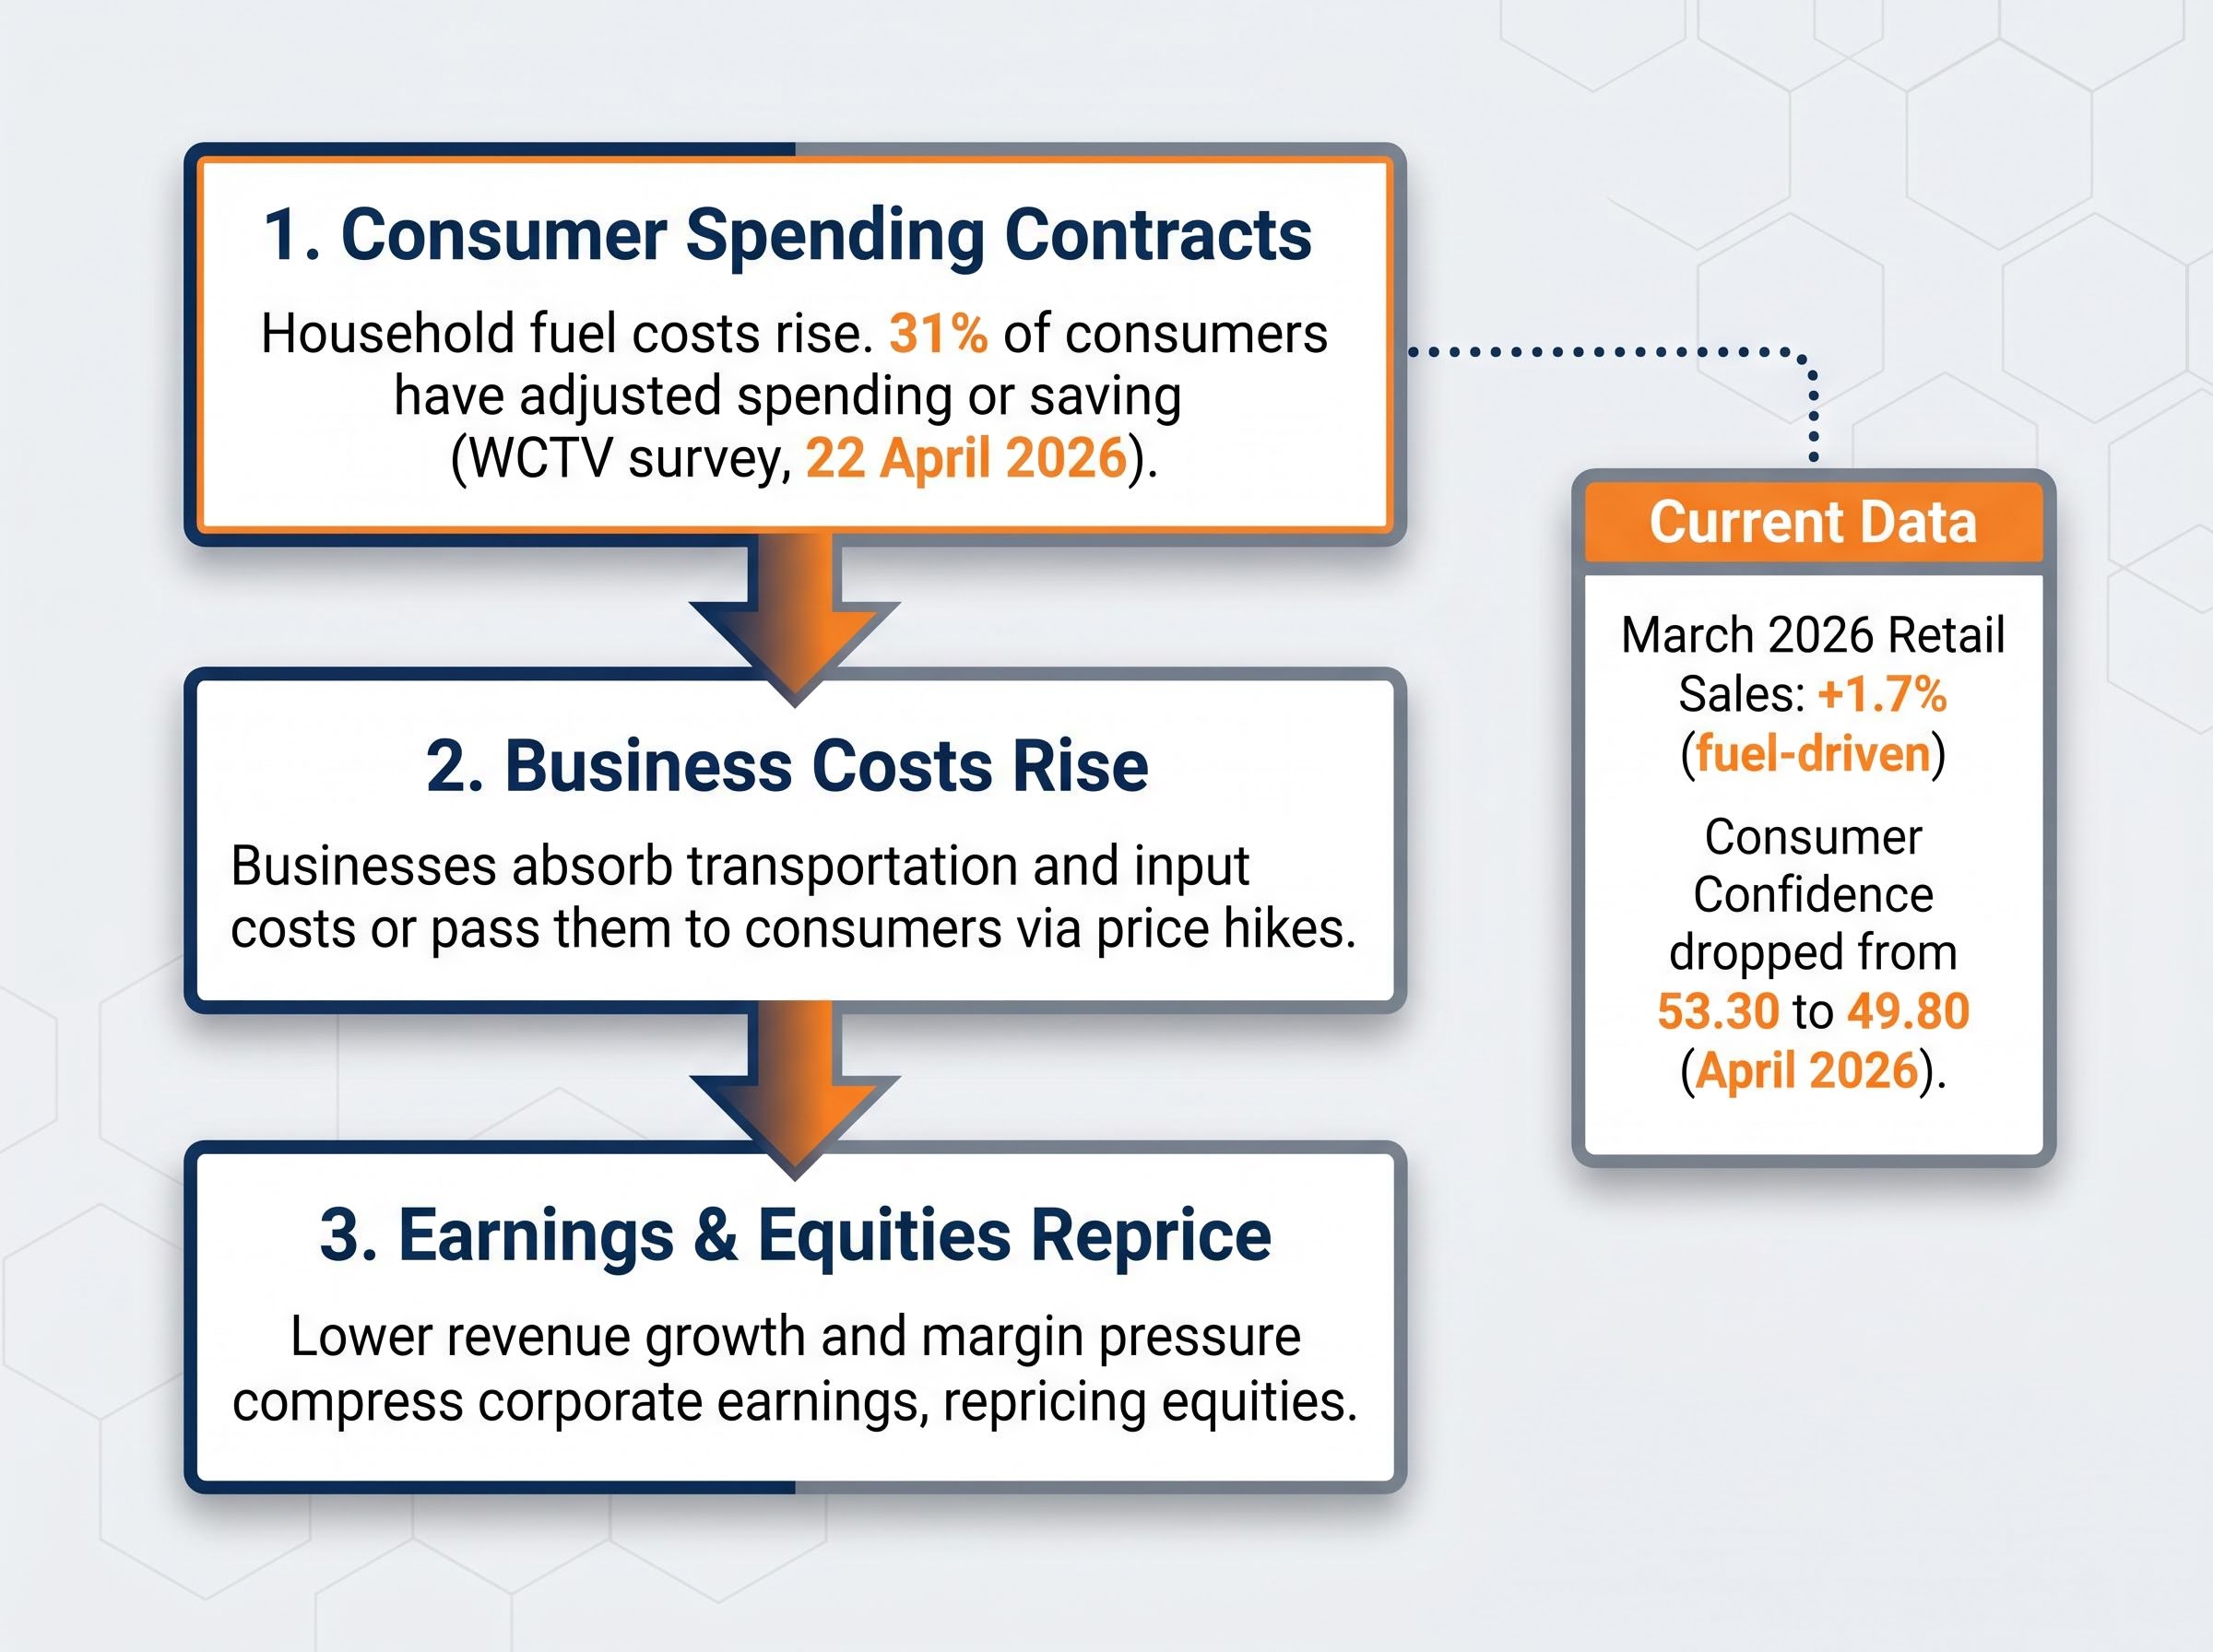
The connection between fuel costs and equity prices is not immediately intuitive for investors focused on earnings reports and Federal Reserve commentary. The transmission runs through three steps, each amplifying the last.
- Household fuel costs rise, reducing discretionary spending. Consumer spending represents the dominant engine of U.S. economic growth. When fuel absorbs a larger share of household budgets, spending on goods and services outside of energy contracts. A survey cited by WCTV on 22 April 2026 found that 31% of consumers have already adjusted their spending or saving behaviour specifically due to rising fuel costs.
- Businesses absorb higher transportation and input costs, or pass them to consumers. The price impact extends well beyond the pump. Higher diesel and jet fuel costs flow through to freight, logistics, and retail pricing. Companies face a choice between margin compression and price increases that further reduce consumer demand.
- Lower revenue growth and margin pressure compress corporate earnings, which reprices equities. When both the demand side (consumers spending less) and the cost side (businesses paying more) are under simultaneous pressure, the resulting earnings compression is what ultimately moves stock prices lower.
The current data already reflects this mechanism in motion
Retail sales grew 1.7% in March 2026, but that figure was heavily fuel-driven rather than reflecting genuine discretionary expansion. Consumer confidence fell to 49.80 in April 2026, down from 53.30 the prior month, a reading consistent with households feeling the squeeze in real time. The transmission is not theoretical at this stage; it is already producing measurable effects in spending and sentiment data.
The recession risk layer that makes this signal harder to dismiss
The 11% average decline following historical gasoline spikes was drawn from a range of economic environments, some of which avoided recession entirely. The current backdrop may not be so fortunate.
Mark Zandi, Chief Economist at Moody’s, has offered one of the more sobering assessments of the present situation. Even a swift resolution of the Iran conflict and a rapid decline in oil prices, Zandi indicated, would still result in no GDP growth and no job creation for the remainder of 2026.
Mark Zandi, Moody’s Chief Economist, has stated that even under a rapid-resolution scenario, the U.S. economy faces near-zero GDP growth and no meaningful job creation for the rest of 2026.
That assessment describes the optimistic outcome. If the Strait of Hormuz closure persists for several months, Morgan Stanley has modelled a worst-case oil scenario of $150 to $180 per barrel, a level that would intensify every link in the transmission chain described above.
For context, the S&P 500’s average decline during recessionary periods since 1957 is approximately 32%, nearly three times the 11% average decline associated with the gasoline signal alone. Four risk factors are now converging simultaneously:
- The Shiller CAPE ratio reached 39.7 in January 2026, a historically elevated valuation that reduces the buffer available to absorb an earnings shock
- Geopolitical uncertainty around the Strait of Hormuz remains unresolved
- Consumer confidence is declining and spending adjustments are already underway
- Oil supply disruption continues to place upward pressure on energy costs across the economy
The 11% average decline represents the statistical centre of the historical distribution. A recession would place the market in the more severe portion of that range.
What the next six months may look like, and what investors should hold onto
The 11% figure is a statistical central tendency across 44 historical instances, not a guaranteed outcome. Some of those instances saw smaller declines; others saw larger ones. The purpose of identifying this pattern is not to predict a specific drawdown with certainty, but to ensure investors weigh it rather than dismiss it during a period of headline-driven optimism.
Three conditions would meaningfully reduce the downside signal:
- A reopening of the Strait of Hormuz, which would relieve the supply pressure currently holding oil above $100 per barrel
- Gasoline prices falling back below $4.00 per gallon, removing the statistical trigger
- Consumer confidence stabilising or recovering, which would indicate the transmission mechanism is not progressing toward earnings compression
Morgan Stanley’s base case for oil in 2026 sits at $80 to $90 per barrel under the most favourable scenario, a level that would require meaningful de-escalation from current conditions. The EIA’s own forecast for retail gasoline, a peak of $3.70 per gallon in April, has already been exceeded by the actual 27 April print of $4.25, signalling ongoing upside surprise in energy costs.
One additional consideration: analysis of post-selloff rebounds since 2000 indicates that durable recoveries have typically required broad market participation within the first two weeks of the rebound. Whether the current rally has met that condition remains uncertain.
The market has recovered. The warning signal has not.
The S&P 500’s return to near-record levels occurred while the gasoline warning signal was hitting its highest activation point in years, not retreating from it. The recovery and the risk are moving in opposite directions.
The analytical case rests on three layers. The statistical gasoline pattern, which has preceded an average 11% decline across 44 historical instances. The economic transmission mechanism, already visible in consumer behaviour and fuel-driven retail figures. And the recession amplifier, where the historical average loss of approximately 32% represents what happens when energy shocks tip the broader economy into contraction.
Since 1993, the S&P 500 has averaged an 11% decline in the six months following weeks when U.S. gasoline exceeded $4.00 per gallon. That signal is active now.
Morgan Stanley’s 14-16% EPS growth forecast for 2026 was constructed before the Strait of Hormuz closure intensified; that consensus faces meaningful downside revision risk if current energy conditions persist. The appropriate response to this convergence of signals is not panic, but it is also not complacency. It is informed vigilance about what the next six months of data reveal.
This article is for informational purposes only and should not be considered financial advice. Investors should conduct their own research and consult with financial professionals before making investment decisions. Past performance does not guarantee future results. Financial projections are subject to market conditions and various risk factors.