
At 13:45 GMT today, one data release lands into one of the most consequential macro setups of 2026: a Dollar under active pressure from Treasury buyback expansion, a jobs report that already disappointed, and gold at its highest level since early June. Today’s S&P Global flash US PMI data is not routine.
PMI releases usually trade as background noise when everything else is calm. They are not background noise today. The consensus expects manufacturing to come in at 53.8 and services at 54.0, both slightly below July’s strong readings but still comfortably in expansion. The question is not whether the US economy is growing. The question is whether it is growing convincingly enough to push back against the narratives that have been selling the Dollar and buying gold all week.
Here is a clear framework for reading today’s numbers the moment they drop: what to watch first, what the sub-indices actually mean, and how a beat or a miss is likely to move currencies, gold, and crypto over the next few hours.
What the PMI actually measures, and why today’s flash release hits differently
The Purchasing Managers’ Index (PMI) is a monthly gauge drawn from surveys of senior executives across the private sector, compiled by S&P Global to reflect current business conditions in both manufacturing and services. It produces readings on a scale where 50 is the dividing line: above 50 signals expansion, below 50 signals contraction, and the distance from 50 tells you the strength of the trend. The flash release, which is what drops today, arrives well before most official economic data, making it one of the earliest reads on business conditions each month and a leading signal for GDP, jobs, and inflation expectations.
PMI flash releases earn their market-moving status precisely because they arrive weeks before official output data: leading indicators versus lagging data is the core distinction, with equity markets typically having already priced GDP outcomes that are still weeks away from publication, meaning the PMI’s surprise content carries more forward-looking signal than the GDP headline itself.
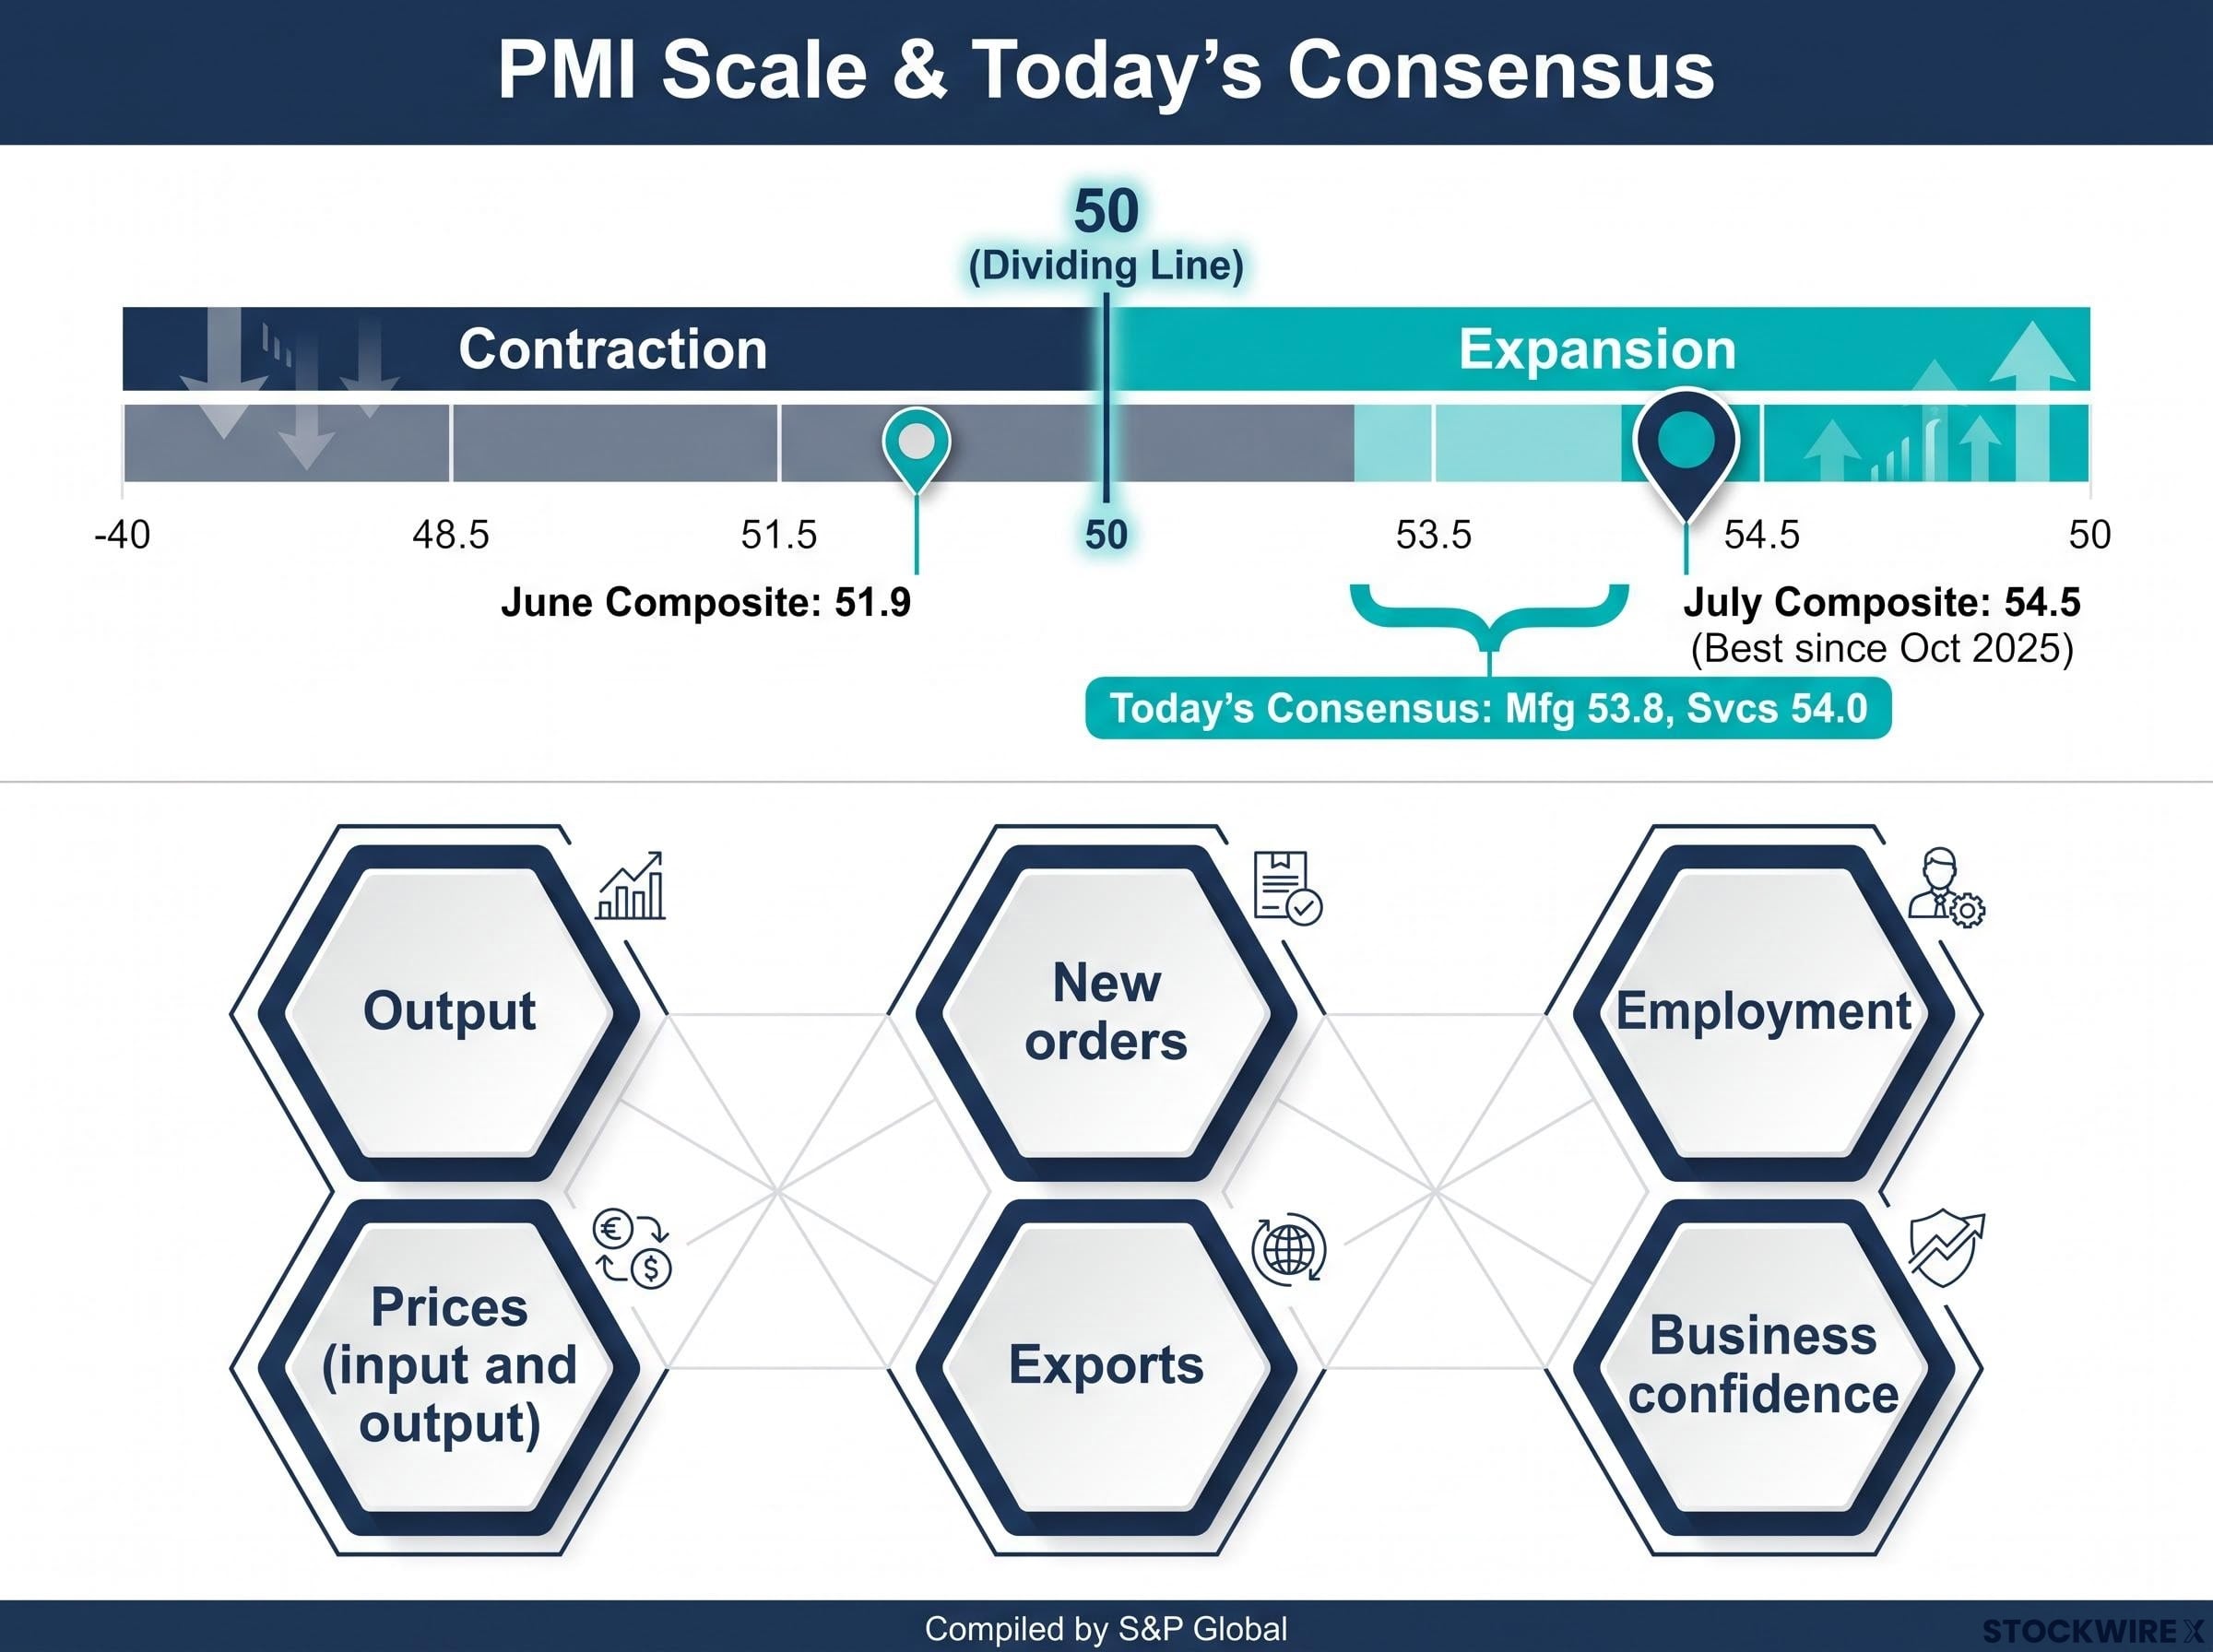
The survey covers six components that matter:
- Output
- New orders
- Employment
- Prices (input and output)
- Exports
- Business confidence
The S&P Global Composite PMI rose to 54.5 in July, climbing sharply from 51.9 in June and recording its best result since October 2025, comfortably beating market expectations at the time.
That backdrop is why today’s release hits differently. It drops into a context already shaped by Treasury market stress, a softer Nonfarm Payrolls (NFP) print, and fading Fed hike pricing. Traders will not be reading this number in isolation. They will be using it to update their Fed expectations in real time, which means the market’s reaction function is unusually sensitive to even small deviations from consensus.
When big ASX news breaks, our subscribers know first
The macro setup that puts today’s numbers under a magnifying glass
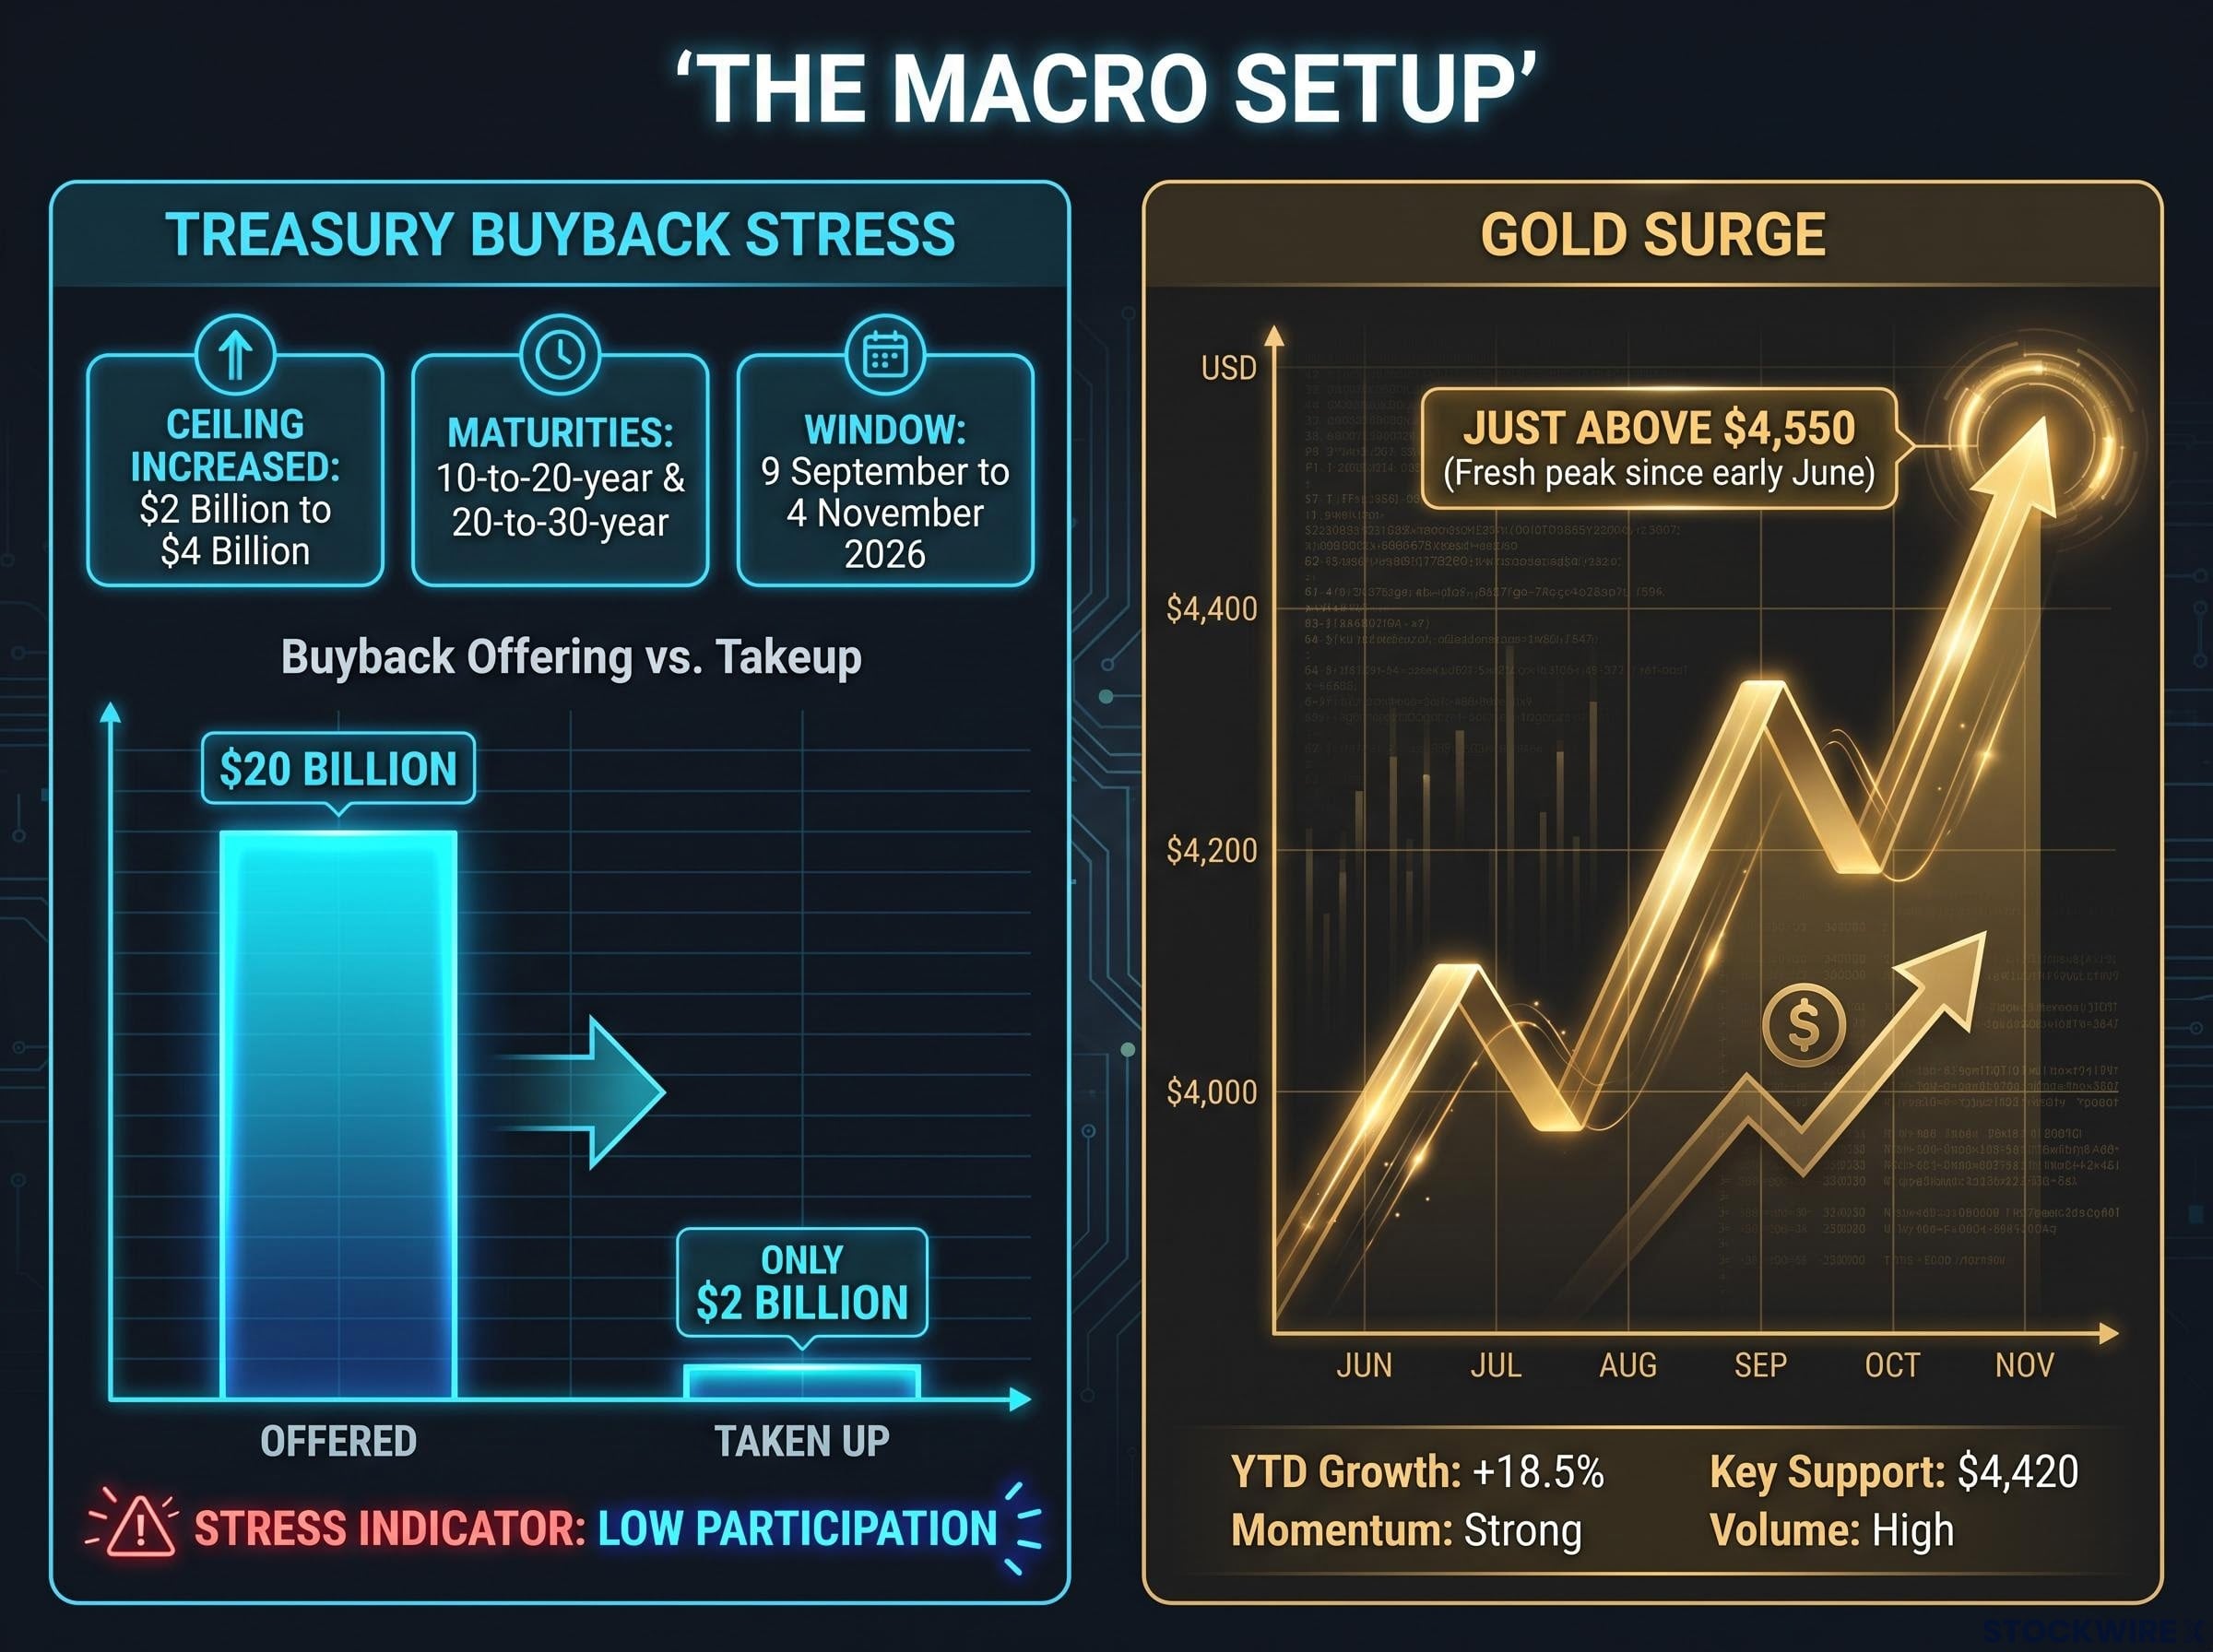
Start with the Dollar. The US Treasury announced this week that it would raise the per-operation buyback ceiling to at least $4 billion, up from the previous $2 billion cap, covering 10-to-20-year and 20-to-30-year maturities, with the change taking effect from 9 September and running to 4 November 2026. That alone signals stress. But the detail that sharpened the market’s concern was the uptake: of the $20 billion offered in buyback operations, only $2 billion was taken up by market participants. That gap between supply and demand in the long end dents confidence in US assets and, by extension, the currency.
Layer in the jobs data. Earlier this month, NFP came in weaker than expected, adding to concerns that the US economy may be cooling faster than assumed. A strong PMI today would help challenge that story. A weak one would compound it.
Then consider what has happened to Fed expectations. Cooling inflation data has reduced market conviction in further near-term rate hikes, compressing the Dollar’s rate advantage versus other major currencies. That compression is already visible in the price action.
Fed hike pricing has already been through several sharp reversals in 2026, with CME-implied odds jumping from roughly 10% to 36% in a two-week window ahead of the July FOMC meeting before cooling data pulled them back, illustrating how quickly a single PMI or payrolls print can reprice the rate path.
The four factors amplifying today’s release:
- Treasury buyback expansion and weak long-end demand
- NFP miss reinforcing the “US cooling” narrative
- Fading Fed hike pricing and compressed rate advantage
- Gold at multi-month highs on USD selling
Gold is trading just above $4,550, holding near a fresh peak not seen since early June, with the move fuelled by a combination of Dollar weakness and scaled-back expectations for an imminent Fed rate hike.
The structural argument for gold at multi-month highs extends beyond short-term USD weakness: the Treasury buyback expansion fits a pattern of financial repression, where a heavily indebted sovereign uses institutional tools to hold borrowing costs below market-clearing levels, eroding real returns on sovereign debt and raising the relative appeal of zero-yield hard assets.
For anyone holding Dollar, gold, or rate-sensitive equity exposure, the point is straightforward: today’s PMI does not land in neutral conditions. It lands as a deciding factor in an argument the market is already having about whether US growth can hold up.
Beat, miss, or in-line: how each outcome moves the Dollar, gold, and crypto
Having a pre-defined framework before the number drops prevents reactive decision-making in the first sixty seconds, which is when most retail positioning mistakes happen.
| Scenario | Threshold signal | Dollar direction | Gold and crypto direction |
|---|---|---|---|
| Bullish surprise | Manufacturing materially above 53.8; services approaching 54.6 or higher; composite at or above mid-54s | USD rebound expected, but constrained unless services or composite push toward 55+ | Gold likely to face profit-taking pressure; crypto mixed between growth optimism and reduced liquidity-easing tailwind |
| Bearish surprise | Manufacturing dropping toward 52-53; services slipping toward 52-53 or below 54.0; composite retreating toward low-50s | Dollar selling likely to accelerate, reinforcing existing weakness | Safe-haven flows expected to extend gold’s rally; crypto reaction split between growth fear and liquidity hope |
| In-line print | Manufacturing near 53.8; services near 54.0; composite close to July’s level | Headline move modest; attention shifts immediately to sub-index details | Direction determined by employment, prices, and orders sub-components rather than headline |
The practical read is that a miss reinforces every bearish Dollar narrative already in play, while a beat challenges them but does not automatically reverse them unless the surprise is large.
Separate the “first move” from the “true move.” The initial algorithmic reaction is headline-driven and can reverse within minutes once traders digest the sub-index details and economist commentary. The second move is frequently the more durable one.
The sub-indices that will drive the second move after the headline
Experienced traders often ignore the headline and wait for the internals before committing to a position. Here is why, and what to watch, in order of market sensitivity:
- Employment: Given the NFP miss, any sign of hiring slowdown in the PMI employment component would deepen concern about the labour-market cooling trajectory. Conversely, resilient hiring would support the view that the labour market is softening gradually, not breaking.
- Input and output prices: Rising price pressures inside the PMI would challenge the current “inflation is cooling” narrative and could re-ignite talk of further Fed tightening. The July report had already drawn attention to building supply disruptions and rising input costs occurring in parallel with solid output growth, making this a genuine risk to watch rather than a remote scenario.
Why price pressures matter most if the headline is a beat
A strong headline PMI combined with rising price sub-indices would be the most complex outcome for markets. It would be positive for the Dollar on growth grounds, but it would simultaneously reintroduce hike risk that complicates equity and gold positioning. The July data already demonstrated that strong expansion and renewed price pressure are not mutually exclusive, and if today’s figures repeat that combination, the Fed’s next move becomes considerably harder to call. That ambiguity, rather than a clean directional signal, is what would keep positioning uncertain through the session.
- New orders: Strong orders point to continued momentum into Q4; weak orders hint at a future slowdown even if current output remains solid.
- Business confidence and supply-side indicators: Upbeat sentiment supports the soft-landing narrative. A cautious tone leans toward late-cycle slowdown. The July release drew attention to worsening supply chain delays, so any further deterioration in this component will be closely watched.
If the headline print lands close to consensus, the employment and prices sub-indices are where the real information lives. They will tell you whether the Fed’s next move is genuinely off the table or merely delayed.
What happens between 09:45 ET and the close: a practical framework for the hours ahead
Markets trade the surprise versus expectations, not the absolute print. Anchor everything to today’s consensus baselines:
Consensus: manufacturing 53.8, services 54.0. These are the reference points for interpreting whether the release is genuinely strong or weak.
The reaction unfolds in three phases:
- Immediate headline algorithmic move (seconds to two minutes). This is the fastest-money reaction and trades on the headline number alone. It can be large and is frequently misleading.
- Sub-index digestion (five to fifteen minutes). Traders read through employment, prices, and orders. Reversals of the initial move often begin here.
- Economist commentary and second derivative (fifteen to thirty minutes). Chris Williamson, who serves as Chief Business Economist at S&P Global Market Intelligence, provides the written commentary that accompanies each release. His language on price trends and employment conditions often drives the second-leg move, because it frames how the market should interpret the data in context.
Key level thresholds worth holding in mind: above approximately 55 on services or composite signals clear growth strength; the 52-53 range signals moderation; approaching 50 raises a genuine slowdown-risk narrative.
The actionable read for a retail investor is to wait for the sub-index details before drawing conclusions. The headline alone cannot tell you whether a beat is genuinely hawkish or simply a noisy positive surprise in a structurally dovish environment.
What today’s release will confirm, challenge, or leave unresolved
A single PMI print is unlikely to resolve the three macro questions the market is bringing into the 13:45 GMT release. It is more likely to land in the “partial evidence” zone than deliver a clean verdict. The three unresolved questions:
- Is US growth momentum durable enough to sustain current equity valuations, or is the July rebound fading?
- Is the Dollar’s recent weakness structurally justified by long-end Treasury stress, or is it a positioning overshoot that a strong data print can reverse?
- Does the Fed have genuine room to pause without reigniting inflation, or will today’s price sub-indices complicate that assumption?
Watch the full release sub-indices, Williamson’s commentary, and the Dollar and gold reaction in the thirty minutes after the print. That window, not the first algorithmic spike, is where the market reveals its true conviction.
For investors wanting to understand how today’s PMI result fits into the broader positioning debate, our deep-dive into the gold price outlook for H2 2026 examines the institutional forecasts, central bank demand data, and Fed rate scenarios that determine whether current levels near $4,550 represent a recovery or a ceiling.
This article is for informational purposes only and should not be considered financial advice. Investors should conduct their own research and consult with financial professionals before making investment decisions. These statements are speculative and subject to change based on market developments and company performance.
—