
How Many Westpac Shares You Need for $10,000 in Income
11 hrs ago
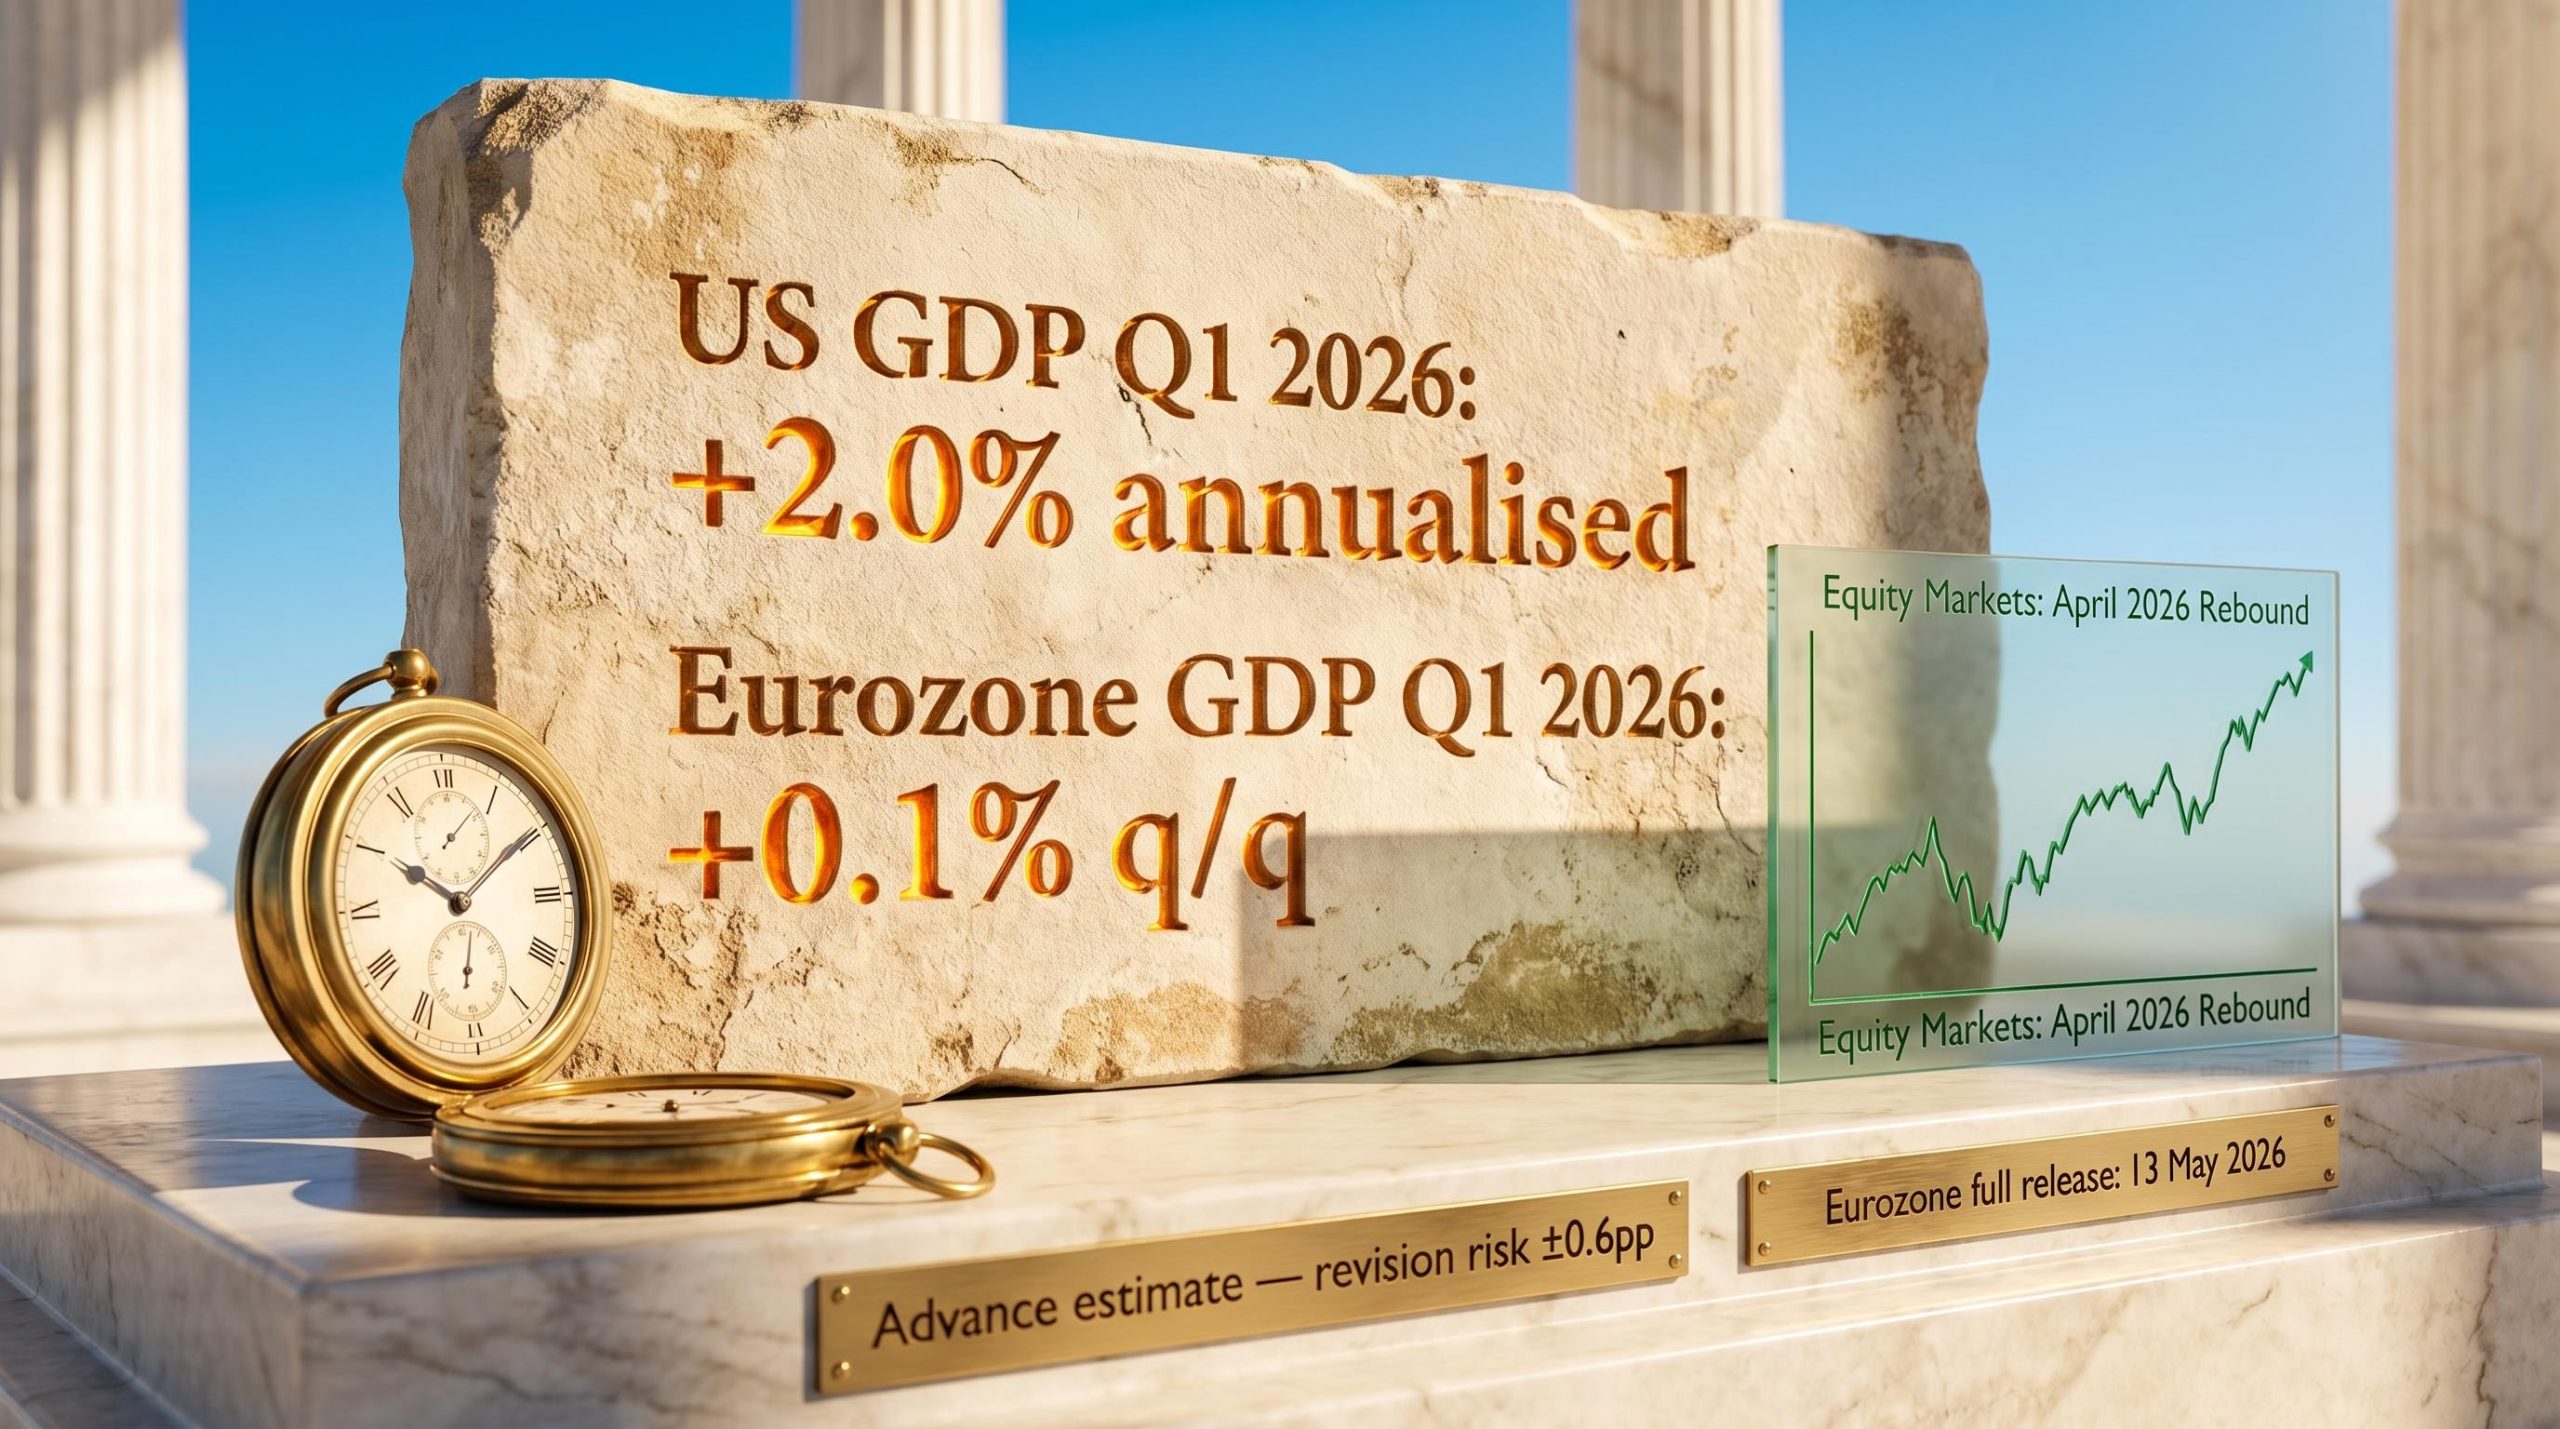
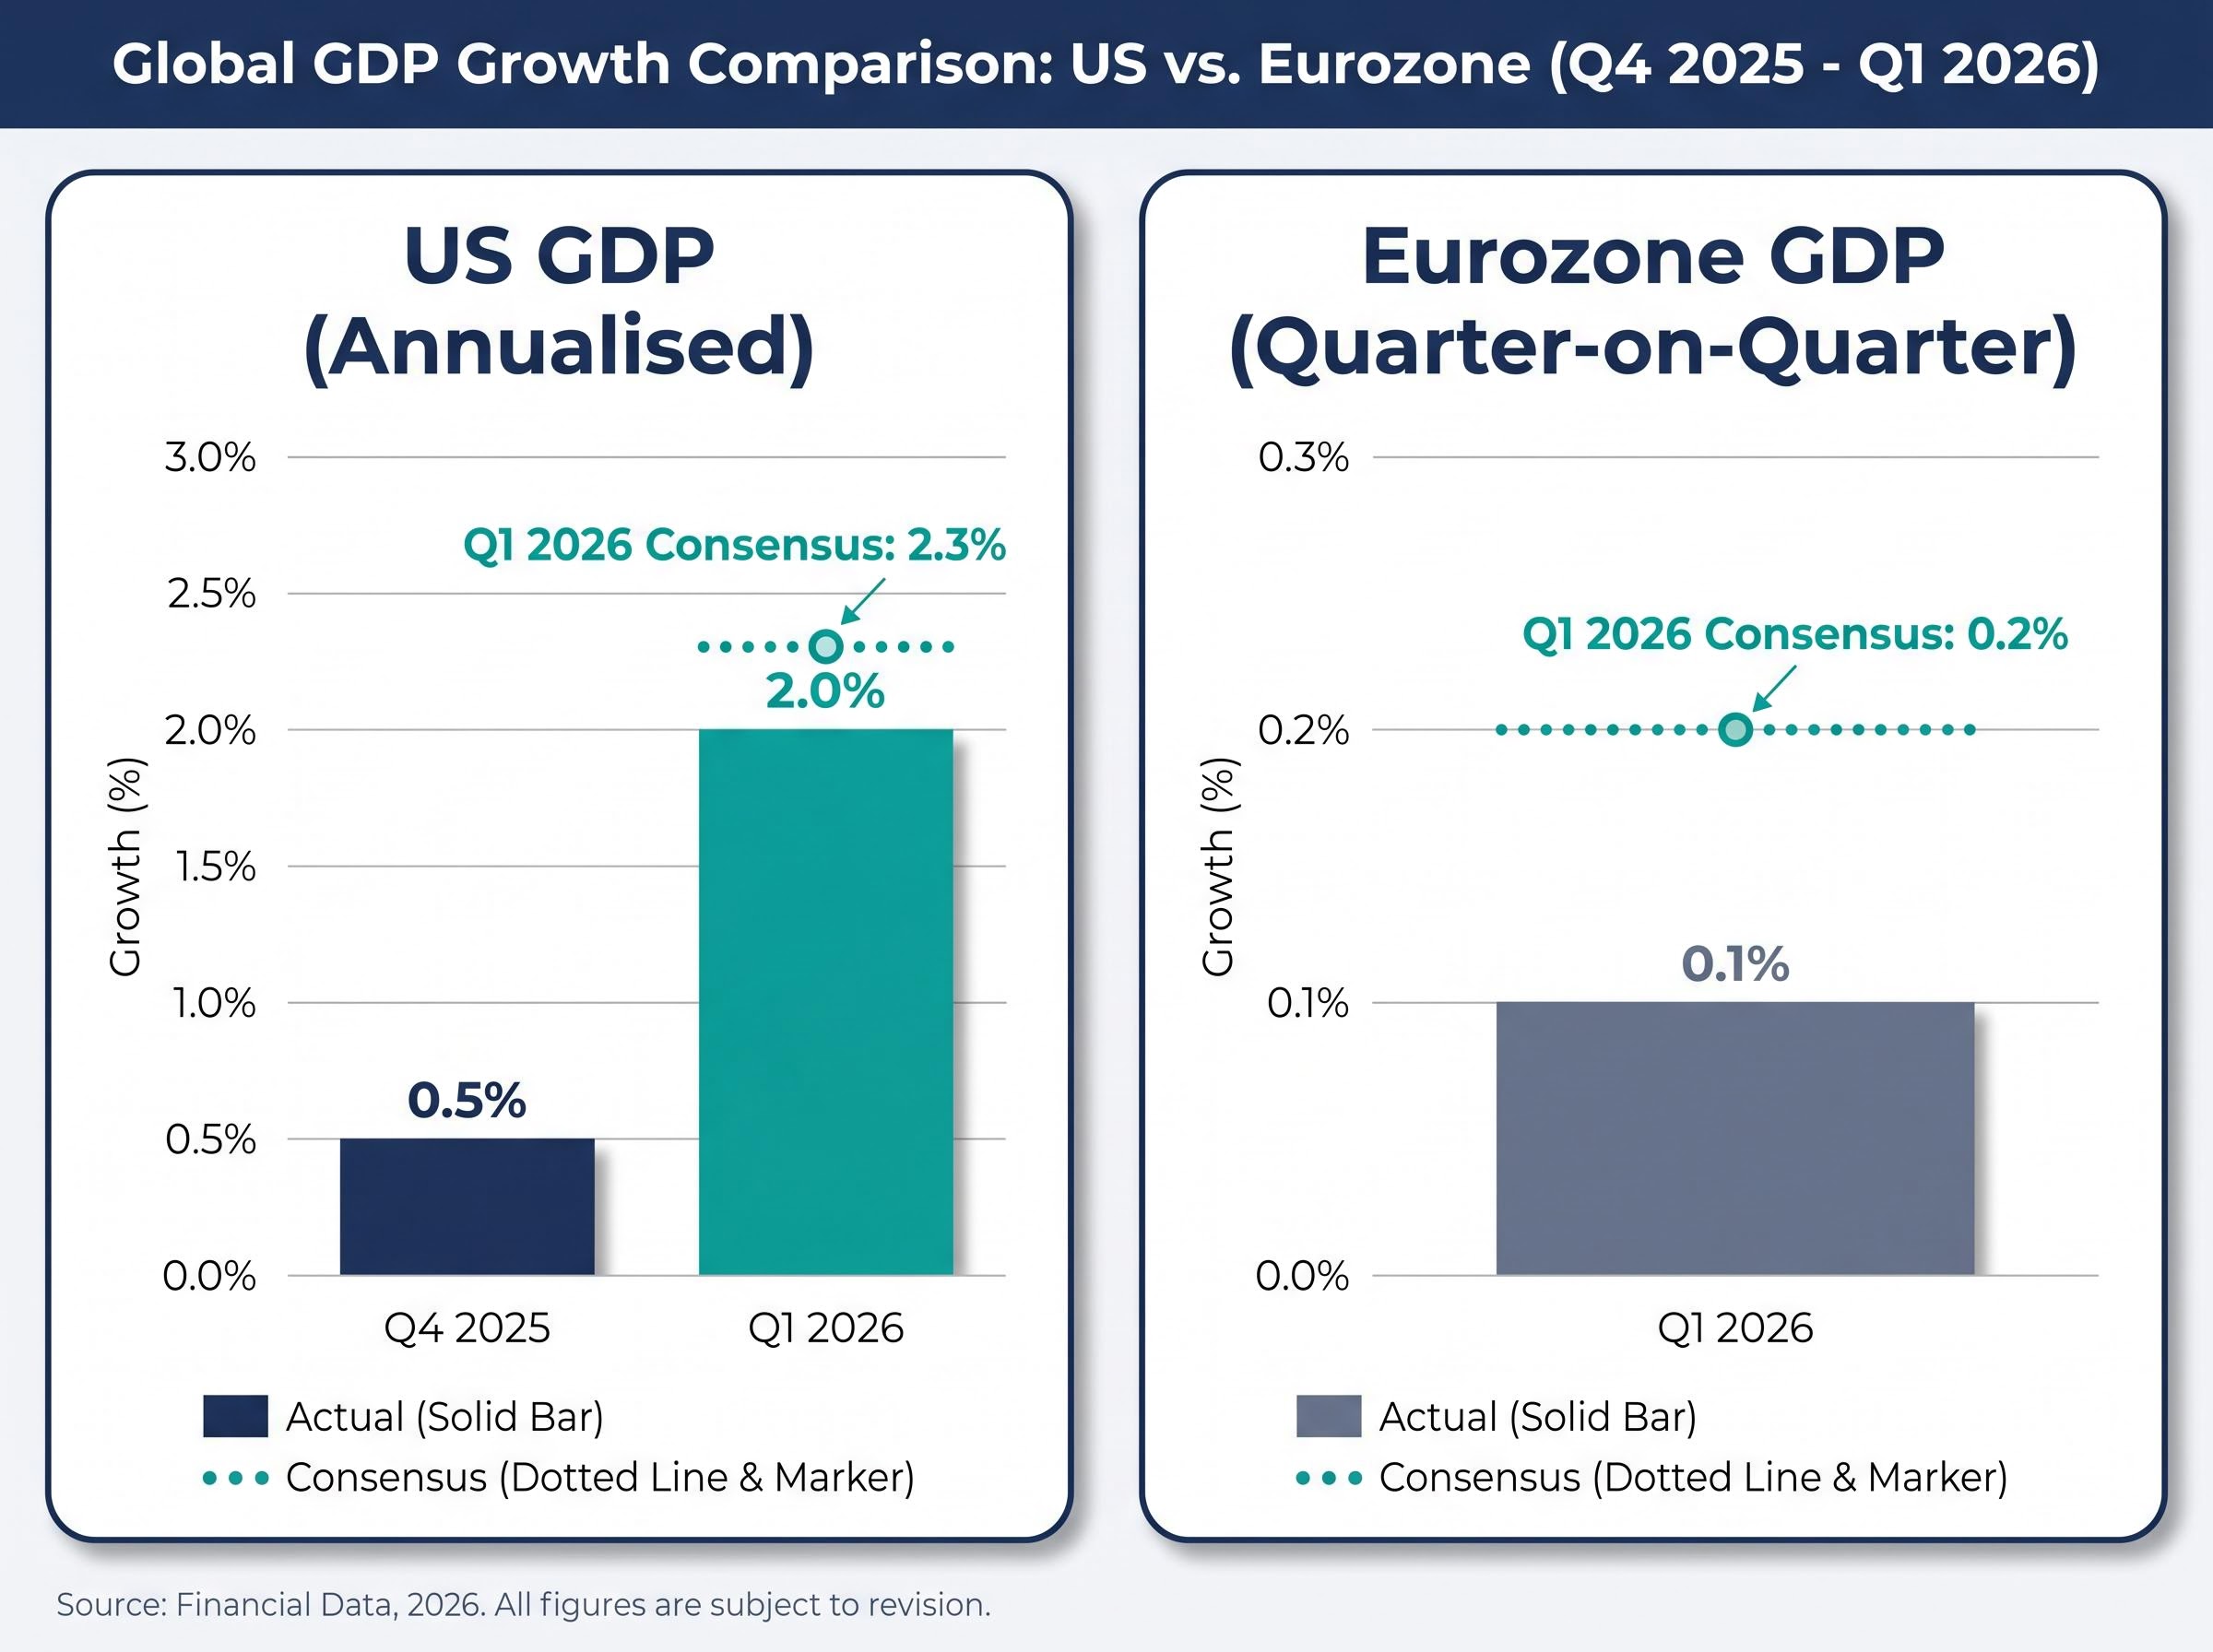
Both the United States and the eurozone released Q1 2026 GDP figures on 30 April 2026, and both came in below expectations. The US economy grew at 2.0% annualised, missing a consensus forecast of roughly 2.3%. The eurozone expanded just 0.1% quarter-on-quarter, undershooting a 0.2% consensus. Within hours, recession commentary was circulating across financial media. Within days, that commentary had likely told readers far less about their portfolios than the headline urgency suggested.
GDP releases remain among the most widely watched economic data points globally, yet they follow a predictable misinterpretation cycle: a below-consensus print triggers recession fears, which triggers portfolio anxiety, which triggers reactive decisions grounded in information that financial markets processed weeks earlier. The Q1 2026 figures offer a near-perfect case study in why that cycle is worth understanding before it repeats.
What follows is a framework for reading any GDP release without overreacting to the headline number. It covers what GDP actually measures, why preliminary figures carry meaningful uncertainty, why equity markets had already priced in this information before the data crossed a single retail investor’s screen, and which indicators genuinely carry forward-looking signal.
Gross Domestic Product is the total monetary value of all goods and services produced within a country over a given period. It is calculated using three approaches:
All three should, in theory, produce the same figure. In practice, statistical discrepancies arise, and the expenditure method dominates public reporting.
One distinction matters immediately: the GDP growth figures reported in news coverage refer to real GDP, meaning output adjusted for inflation, not nominal GDP measured in current prices. A second distinction matters just as much, and it is the one most frequently missed.
The US Bureau of Economic Analysis (BEA) reports quarterly GDP as an annualised figure: the quarterly growth rate is multiplied by four to express it as an annual rate. The eurozone’s Eurostat reports a straight quarter-on-quarter percentage change.
This convention amplifies both growth and contraction signals in US data relative to eurozone reporting. The eurozone’s 0.1% q/q figure is broadly comparable to roughly 0.4% annualised, making the two economies’ Q1 performances less divergent than they appear on screen. The US 2.0% annualised rate also represents a significant acceleration from Q4 2025’s 0.5% annualised figure, a directional shift that the headline miss obscures.
By the time a GDP figure is published, the quarter it describes ended weeks ago and the economic conditions that produced it may have already changed. The BEA’s advance estimate for Q1 2026, released on 30 April, describes economic activity from January through March. It is a historical record, not a forecast.
The lag is compounded by a revision cycle that makes the advance figure provisional. The BEA publishes three sequential estimates:
The average absolute revision between a US advance GDP estimate and its final reading is approximately 0.6 percentage points. A miss of 0.3 points relative to consensus can evaporate entirely.
The BEA’s explanation of GDP revision methodology details why advance estimates are constructed from incomplete source data, with subsequent releases incorporating more comprehensive surveys of business activity, trade, and income that were not yet available at the initial release date.
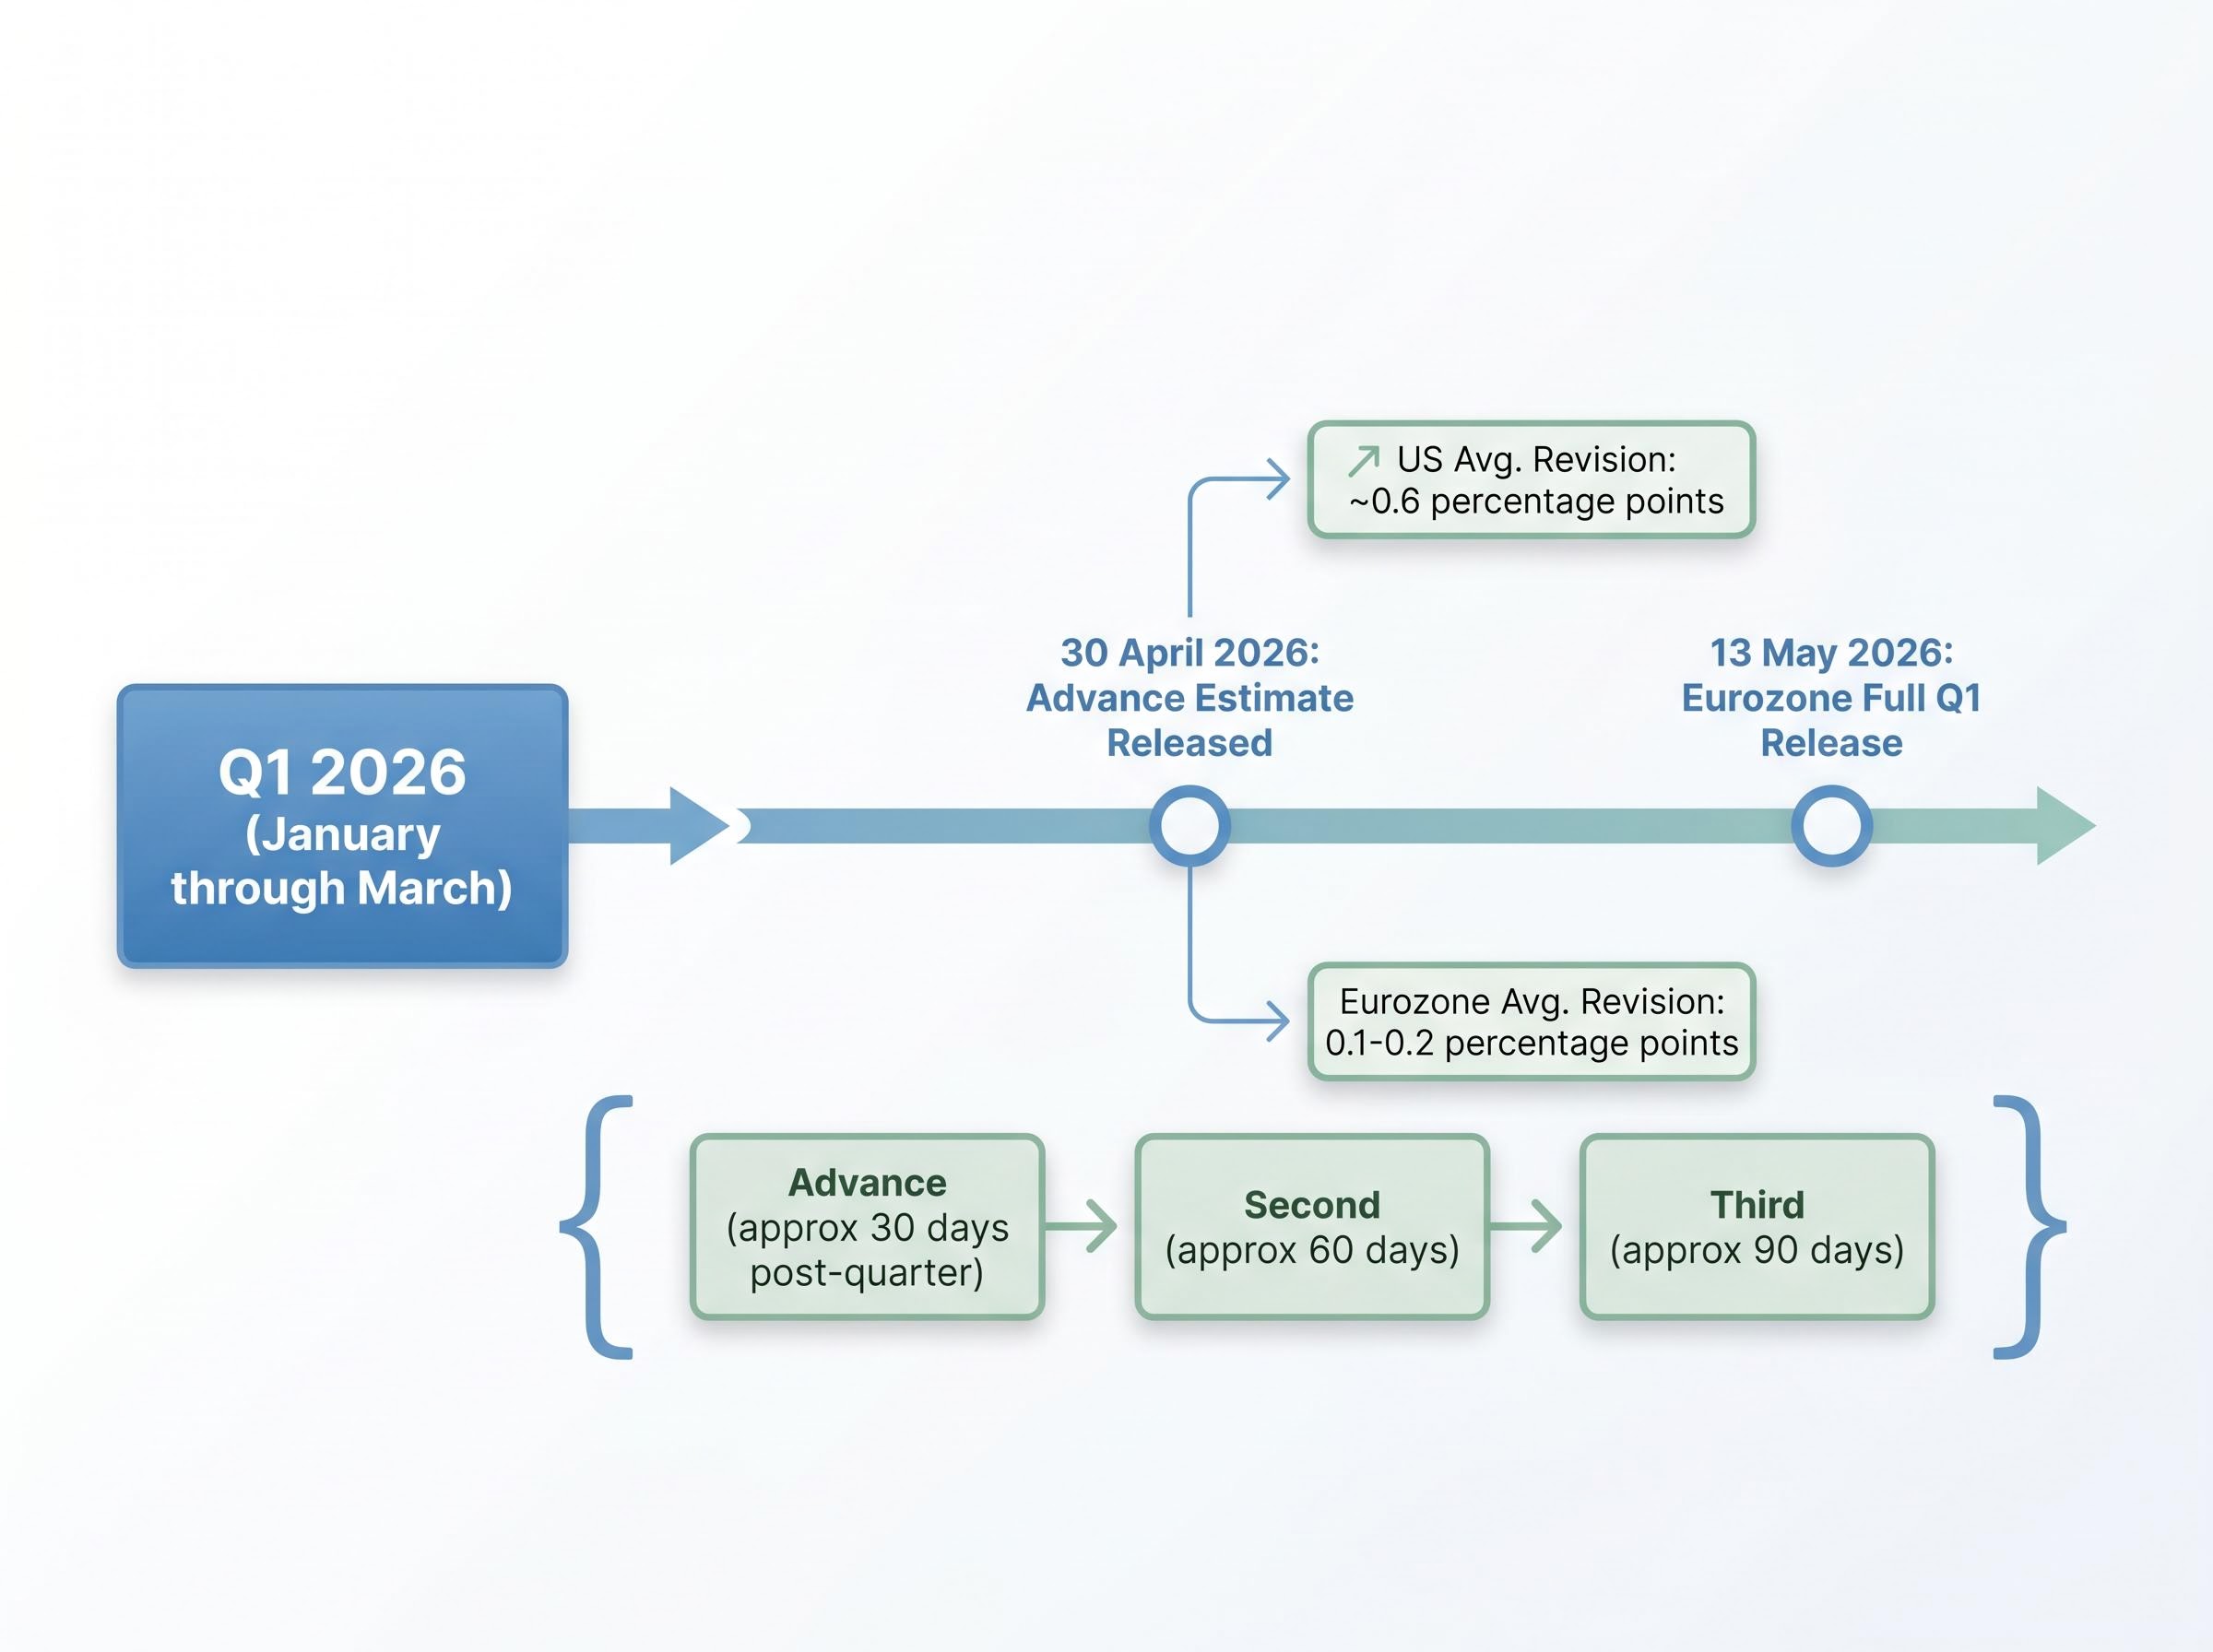
The eurozone flash estimate follows a similar pattern. Eurostat’s flash reading typically revises by 0.1-0.2 percentage points, and the full Q1 2026 release is scheduled for 13 May 2026. The figure that generated recession commentary last week may look materially different in a fortnight.
Treating an advance estimate as a definitive verdict on the economy introduces unnecessary noise into investment thinking. A small miss relative to consensus can, and regularly does, reverse in subsequent releases.
The instinct is straightforward: a weak GDP number should mean weak stock markets. The mechanism is not that simple.
Equity prices reflect the aggregated expectations of millions of participants about future earnings, policy responses, and economic conditions. They do not respond one-for-one to backward-looking data that was already anticipated. Professional forecasters, institutional traders, and algorithmic models build GDP expectations well before release day using Purchasing Managers’ Index (PMI) data, payrolls, trade figures, and nowcast models.
The recurring gap between geopolitical risk and market behaviour follows a consistent structural logic: equity prices process events as probability-adjusted inputs to future earnings rather than proportional headline shocks, which is why markets absorb supply disruptions, conflict escalations, and political shocks far faster than post-event commentary typically acknowledges.
The BNP Paribas GDP Growth Nowcast, published on 21 April 2026, estimated eurozone Q1 growth at 0.4% q/q, already signalling that the official figure could disappoint relative to earlier expectations. By the time consensus converged to 0.2% closer to release, and the actual came in at 0.1%, the magnitude of the surprise was small, measured in basis points rather than the percentage points that recession framing implies.
Global equities declined roughly 9% during Q1 2026, a period shaped by the Iran conflict and its supply chain disruptions. By April, markets had rebounded to record highs.
The timing is instructive. Equity markets reached those highs despite the GDP period under review being one of subdued output. Corporate earnings forecasts for US, European, and global companies rose following the onset of the Iran conflict, reflecting how businesses adapted faster than quarterly GDP data could capture. The market was pricing forward earnings recovery while the Q1 GDP figure was still being compiled.
Reacting to a GDP release by adjusting a portfolio is, in most cases, responding to information the market has already digested. The press release confirmed what prices had already absorbed.
A technical recession is conventionally defined as two consecutive quarters of negative GDP growth. A single below-consensus quarter does not meet that threshold, particularly when the prior quarter was positive and the current one remains in positive territory.
The Q1 2026 data environment illustrates why recession risk assessment requires a composite reading of indicators rather than a reaction to one lagging data point.
| Indicator | Q1/Early Q2 2026 Status | Direction | What It Signals |
|---|---|---|---|
| Eurozone unemployment | 6.2% (March 2026) | Declining (from 6.3% in February 2025) | Labour market tightening; inconsistent with recession |
| Manufacturing PMI | Improving in Q1 2026 | Positive | Industrial activity stabilising |
| Yield curve | Steep | Positive | Healthy monetary transmission; credit expansion |
| Lending growth | Positive | Stable | Credit flowing; not contracting |
| ECB growth forecast (2026) | 1.0% | Cut from prior expectations | Below prior outlook, but positive, not recessionary |
Eurozone unemployment fell to 6.2% in March 2026, according to Eurostat, down from 6.3% a year earlier. Recessions typically feature rising unemployment. This one does not fit that pattern.
Professional forecasters cut the eurozone growth outlook to 1.0% for 2026, below prior expectations, but firmly positive, not recessionary.
The complication is real, however. The ECB’s Survey of Professional Forecasters (May 2026) simultaneously raised 2026 inflation expectations to 2.7%, creating a stagflationary risk profile that simple recession framing does not capture. Capital Economics noted that Q2 business surveys pointed to stagnation at the start of the quarter. The picture is more nuanced than either “recession incoming” or “nothing to worry about.”
The following four-step sequence applies to any GDP release, not just Q1 2026:
Common errors to avoid:
The Fisher Investments analytical framework offers a useful reminder here: ECB consumer surveys showing deteriorating growth expectations can function as a contrarian signal. When consensus pessimism is already priced into expectations, economic reality needs only to be less bad than feared to deliver a positive surprise.
Consumer confidence surveys function as a contrarian signal precisely because they measure sentiment that has already been formed in response to events markets have digested: the University of Michigan’s April 2026 reading hit a record low of 49.8 while the S&P 500 sat near all-time highs, a divergence consistent with historical patterns where sentiment troughs have tended to coincide with market bottoms rather than the beginning of sustained declines.
Holding the Q1 2026 numbers against the interpretive framework yields a specific, bounded reading.
What the data says:
Stripping out government spending swings and import volatility reveals private sector momentum running at 2.2% annualised, materially stronger than the headline figure, with business fixed investment growing at 10.4% annualised, its fastest pace since Q2 2023, a sub-component picture that headline recession commentary consistently failed to surface.
What the data does not say:
The genuine complication remains the ECB’s inflation revision to 2.7% for 2026. Stagflationary dynamics, where growth slows while inflation persists, represent a different risk profile from simple recession, and honest interpretation should not dismiss that tension.
For readers wanting to trace the policy implications of the stagflation risk profile identified in the Q1 data, our full explainer on the Fed rate hold and stagflation risk covers the specific valuation dislocations created by five consecutive holds at 3.50%-3.75%, the JPMorgan 35% stagflation probability estimate, and which equity sectors are trading at historically rare discounts as a result.
GDP is a backward-looking measure. Preliminary estimates carry meaningful revision risk. Equity markets price economic expectations well in advance of official data releases. None of these facts are new, yet the cycle of headline reaction repeats with every quarterly print.
The Q1 2026 episode is a template, not an anomaly. The forward-looking indicator toolkit, PMI trends, yield curve slope, labour market direction, lending growth, and professional forecaster surveys, provides more actionable inputs for economic assessment than the GDP headline alone.
The next GDP release will arrive with the same pattern: a number, a consensus comparison, and a wave of commentary calibrated to the gap between the two. A reader equipped with a specific, repeatable interpretive framework can evaluate that commentary critically rather than absorbing its tone as fact. Calibrated interpretation is a learnable skill, and the data rewards those who practise it.
This article is for informational purposes only and should not be considered financial advice. Investors should conduct their own research and consult with financial professionals before making investment decisions. Past performance does not guarantee future results. Financial projections are subject to market conditions and various risk factors.
GDP measures the total monetary value of goods and services produced within a country over a given period, but because it describes activity from a quarter that has already ended, it is a historical record rather than a forecast, meaning markets have typically priced in expectations well before the official figure is released.
The US reports GDP as an annualised rate by multiplying the quarterly growth rate by four, while the eurozone reports a straight quarter-on-quarter percentage change, meaning the two figures are not directly comparable and the US number amplifies both growth and contraction signals relative to eurozone reporting.
US advance GDP estimates carry an average absolute revision of approximately 0.6 percentage points between the initial release and the final reading, meaning a small consensus miss can easily reverse in the second or third estimate published in subsequent months.
PMI trends, yield curve slope, labour market direction, lending growth, and professional forecaster surveys all carry more forward-looking signal than a backward-looking GDP print, and should be assessed together rather than relying on a single quarterly output figure.
Investors should check whether the figure remains in positive territory, assess revision risk before anchoring to the advance estimate, compare the print against leading indicators, and evaluate whether media commentary accurately reflects what the data actually shows rather than reacting to the headline gap alone.