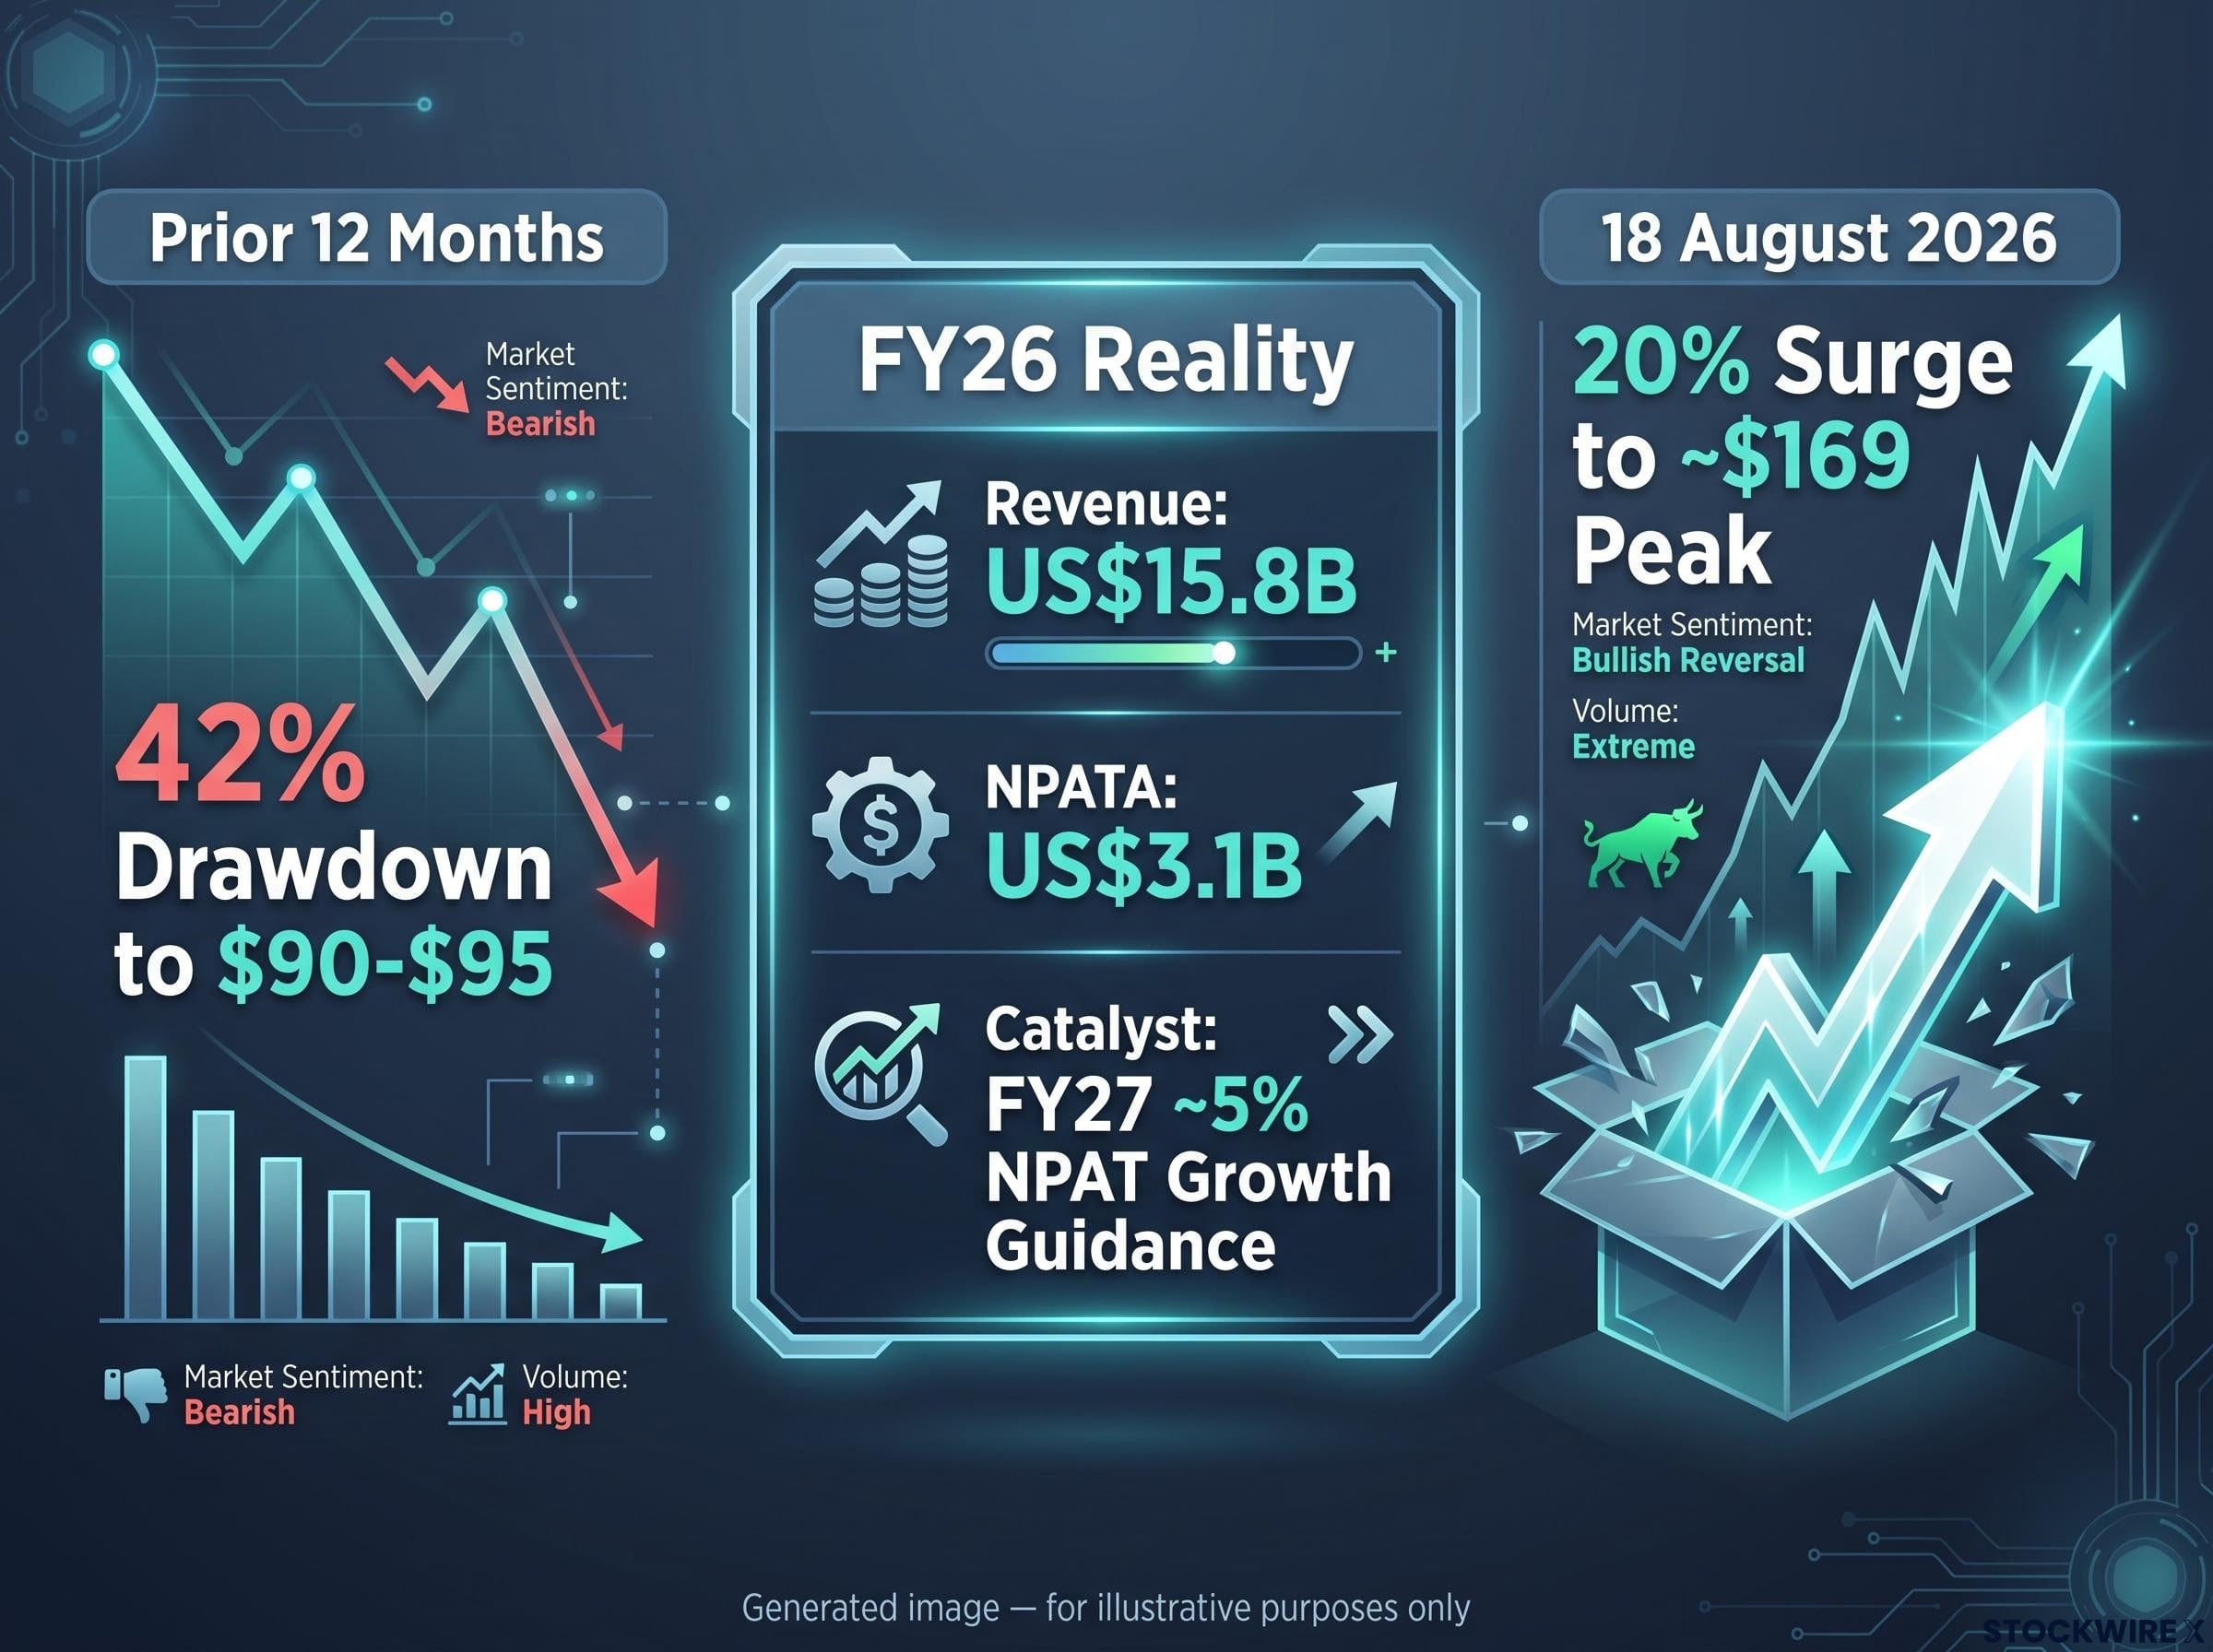
CSL’s share price rose approximately 20% in a single session on 18 August 2026, its best day since June 2001. That is not a normal result beat. That is a market repricing an entire narrative.
The August 2026 ASX reporting season has produced no shortage of results, but two stand apart for what they reveal about investor sentiment, structural earnings shifts, and the speed at which markets can reverse deeply entrenched positions. CSL’s relief rally and BHP’s copper-driven earnings surge are not just headline events. They are diagnostic signals about where the market’s mispricing currently sits and what that means for investors still evaluating positions with one week of results remaining.
Here is what these two results tell you about how to read the rest of the season, and whether either stock still makes sense at current levels. The framework that emerges from both moves applies well beyond these two names.
How CSL fell so far that a recovery looked like a surge
The 20% single-day move did not come from nowhere. It came from a 42% drawdown over the prior 12 months that had pushed CSL’s share price to multi-year lows of approximately $90-$95. Understanding the collapse is the only way to understand the rally.
The headwinds had accumulated steadily:
- Persistent scepticism around the Vifor acquisition, which many analysts considered overpriced
- Generic pharmaceutical competition in the iron deficiency treatment segment
- No permanent CEO, with Gordon Naylor appointed CEO and Managing Director in February 2026 in what was initially seen as a stabilising move
- Uncertainty around the US vaccine regulatory environment under Robert Kennedy Jr.
- The apparent shelving of the previously discussed Aquarius demerger, with no formal announcement made
Each of these individually was manageable. Together, they created a sentiment spiral that pushed the stock well below where even bearish institutional opinion thought it belonged. Prior analyst consensus price targets sat in the $110-$120 range, meaning a stock trading at $90 was not just below fair value estimates; it was trading below the bear case.
The headwinds accumulated across multiple earnings cycles, with four guidance downgrades over approximately two years each compressing the multiple further, pushing CSL to a nine-year low of A$100.75 in May 2026 and erasing A$9.48 billion in market capitalisation in a single session.
A stock sitting 42% below broker consensus targets is not a stock with a pricing problem. It is a stock with a sentiment problem, and sentiment problems resolve violently when the feared outcome does not arrive.
When big ASX news breaks, our subscribers know first
What the FY26 numbers actually showed, and why the market cared
The temptation is to call this a strong result. It was not. It was an adequate result that detonated a major rally precisely because it dismantled the worst-case scenario, not because it confirmed a new growth era.
The FY26 financials were modest: revenue of US$15.8 billion (down 1% at constant currency), underlying NPATA of US$3.1 billion (down 2%), and a maintained dividend. None of those numbers, in isolation, would move a stock 20% in a session.
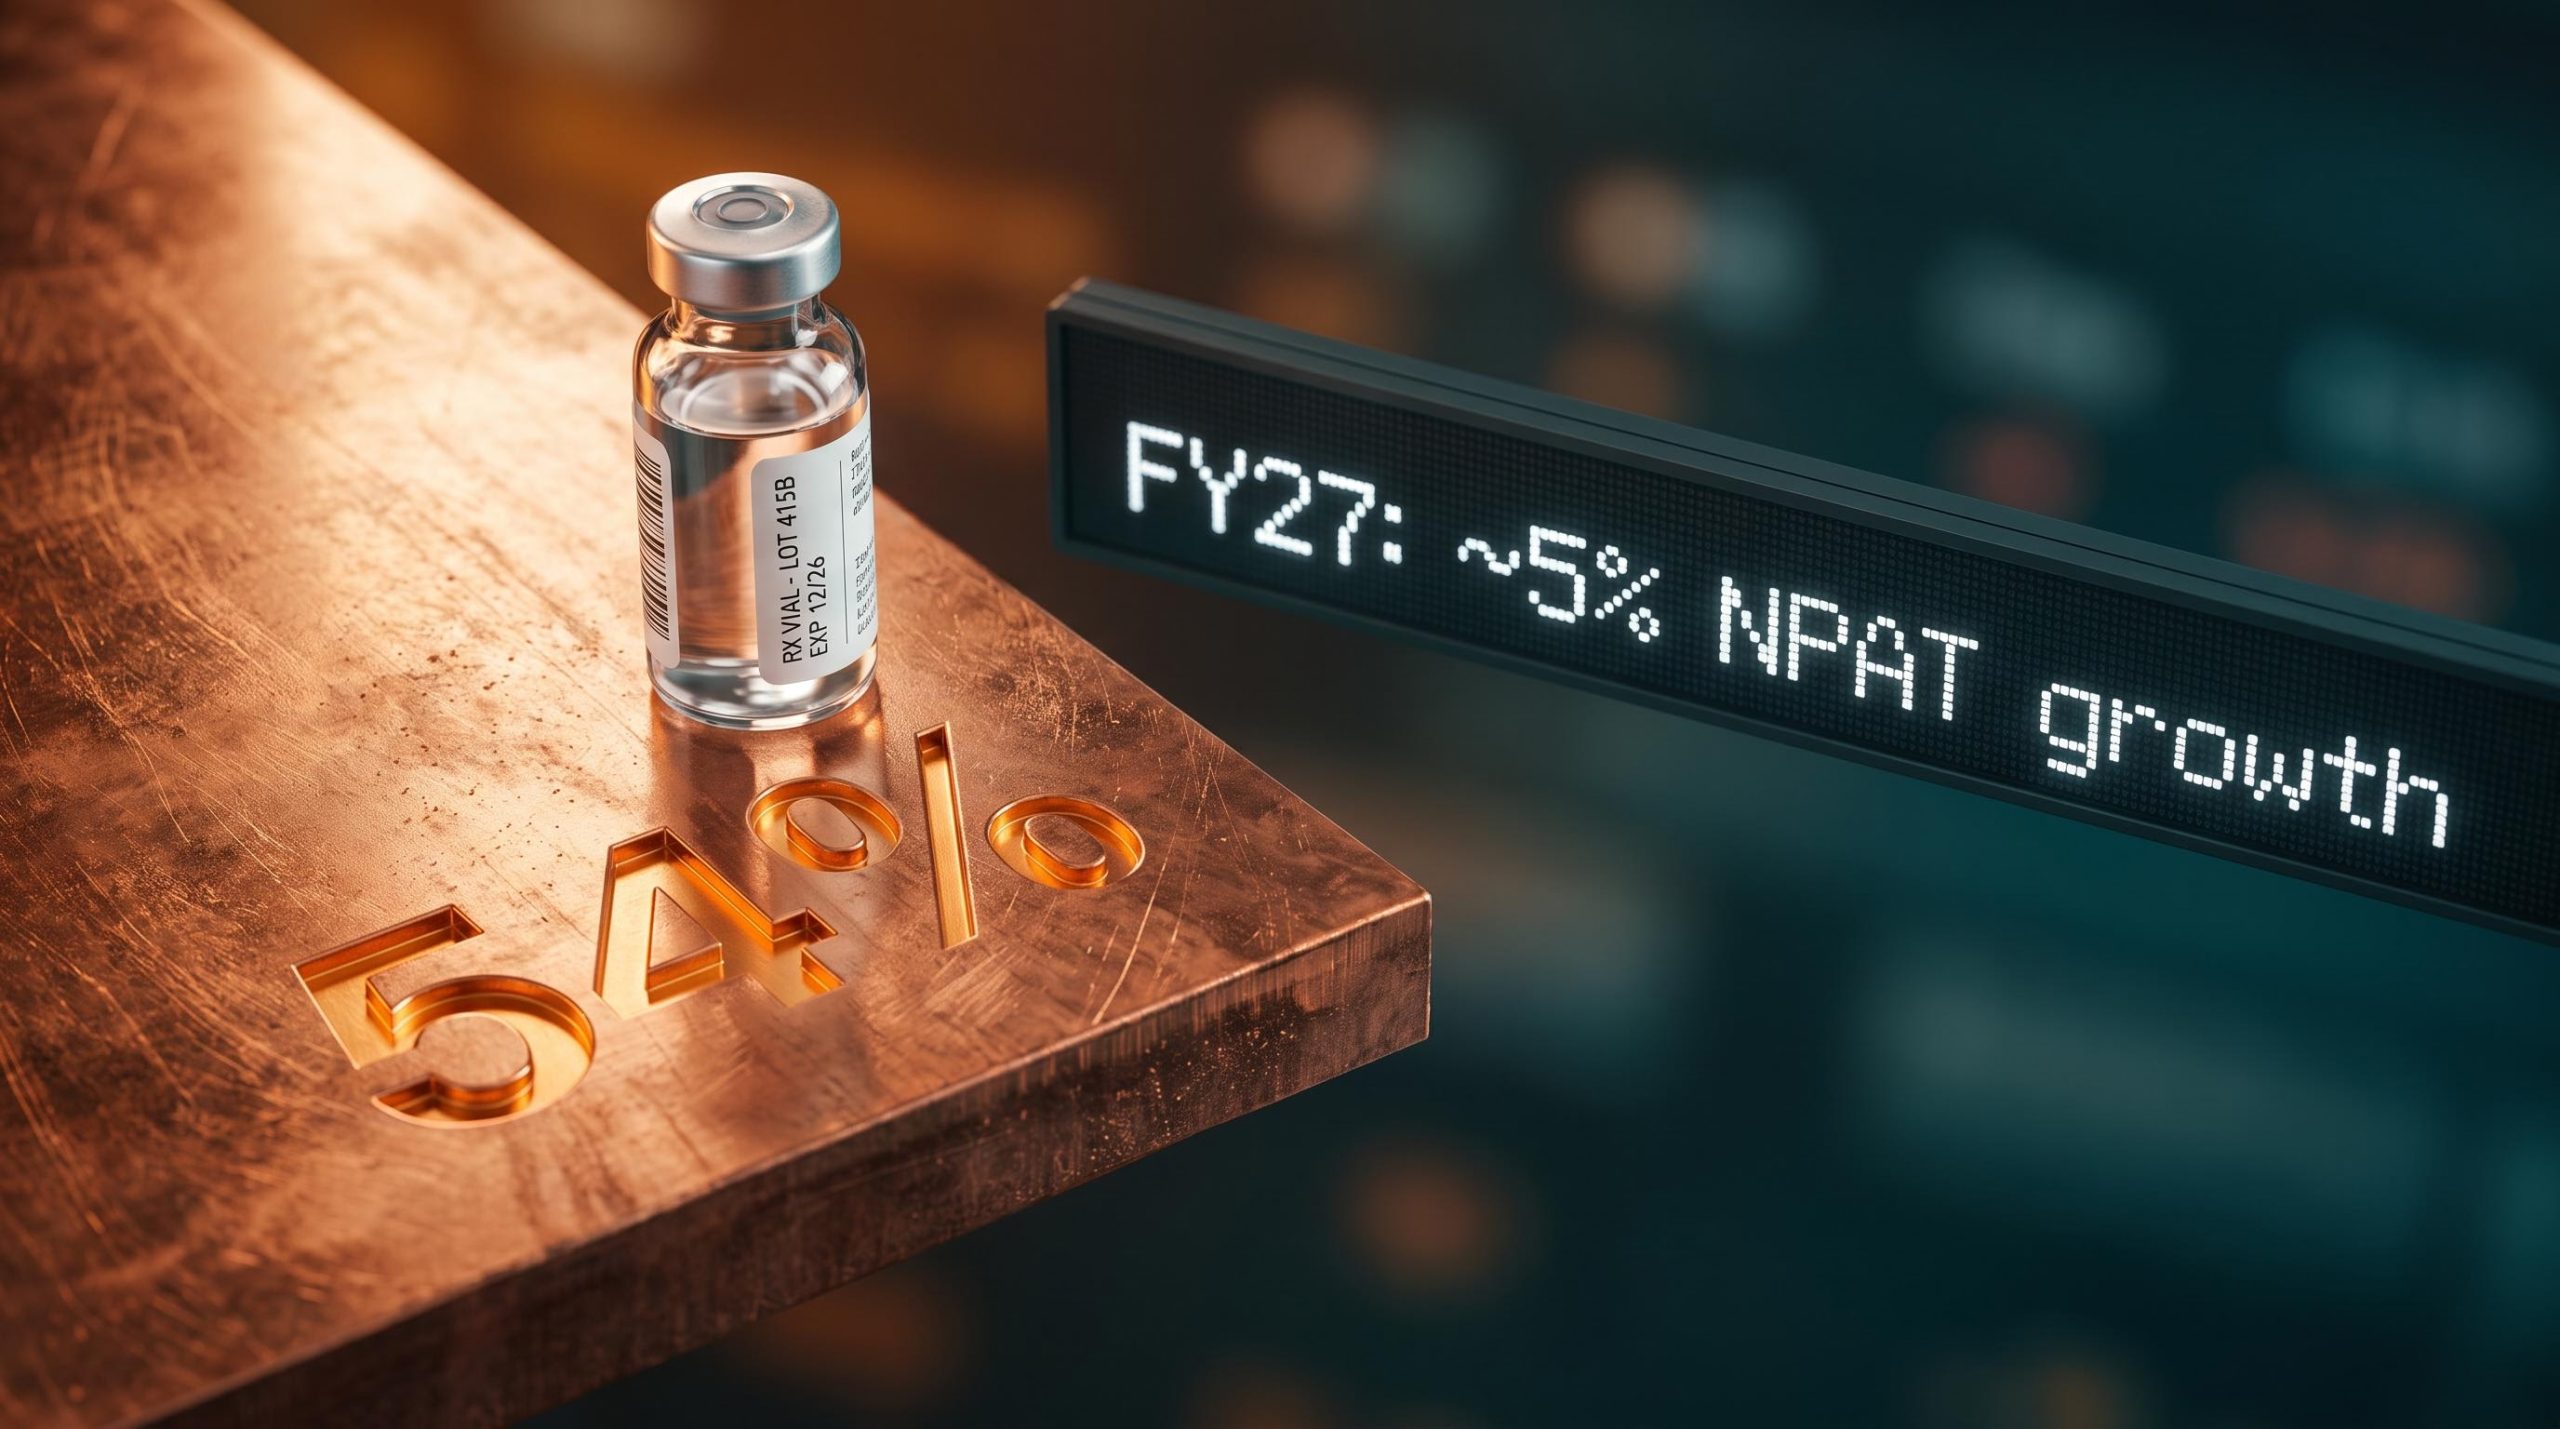
The line that mattered was FY27 guidance of approximately 5% underlying NPAT growth, which reframed FY26 as a transition year rather than the beginning of structural decline.
That guidance figure turned the narrative. For a company that had faced persistent downgrades, the signal that profits would grow next year, underpinned by the core plasma division, removed the immediate case for further selling.
Then came the short squeeze. CSL had attracted significant bearish interest during its extended drawdown. Once the numbers landed and the worst case evaporated, short sellers were forced to cover into a rising market, amplifying the move well beyond what the fundamentals alone would have produced. Shares rose approximately 18-20% intraday to around $158-$159, extended to roughly 24% over the week, and reached approximately $169, a rebound of approximately 75-80% from the multi-year low.
SMU research on short selling and post-earnings price discovery finds that elevated short interest compresses post-earnings drift for negative surprises, which helps explain why the removal of CSL’s worst-case scenario was enough to trigger covering pressure well beyond what the underlying numbers justified.
| Metric | FY26 Actual | Prior Year Context |
|---|---|---|
| Revenue | US$15.8 billion | Down 1% at constant currency |
| Underlying NPATA | US$3.1 billion | Down 2% |
| Dividend | Maintained | Viewed positively by market |
| Share price (low to post-result) | ~$90-$95 to ~$169 | Rebound of approximately 75-80% |
The market was not rewarding CSL’s performance. It was punishing those who had priced in catastrophe. For investors watching from the sidelines, that distinction matters when deciding whether the move has further to run or is already largely complete.
BHP’s copper transformation: what a 54% EBITDA share actually means
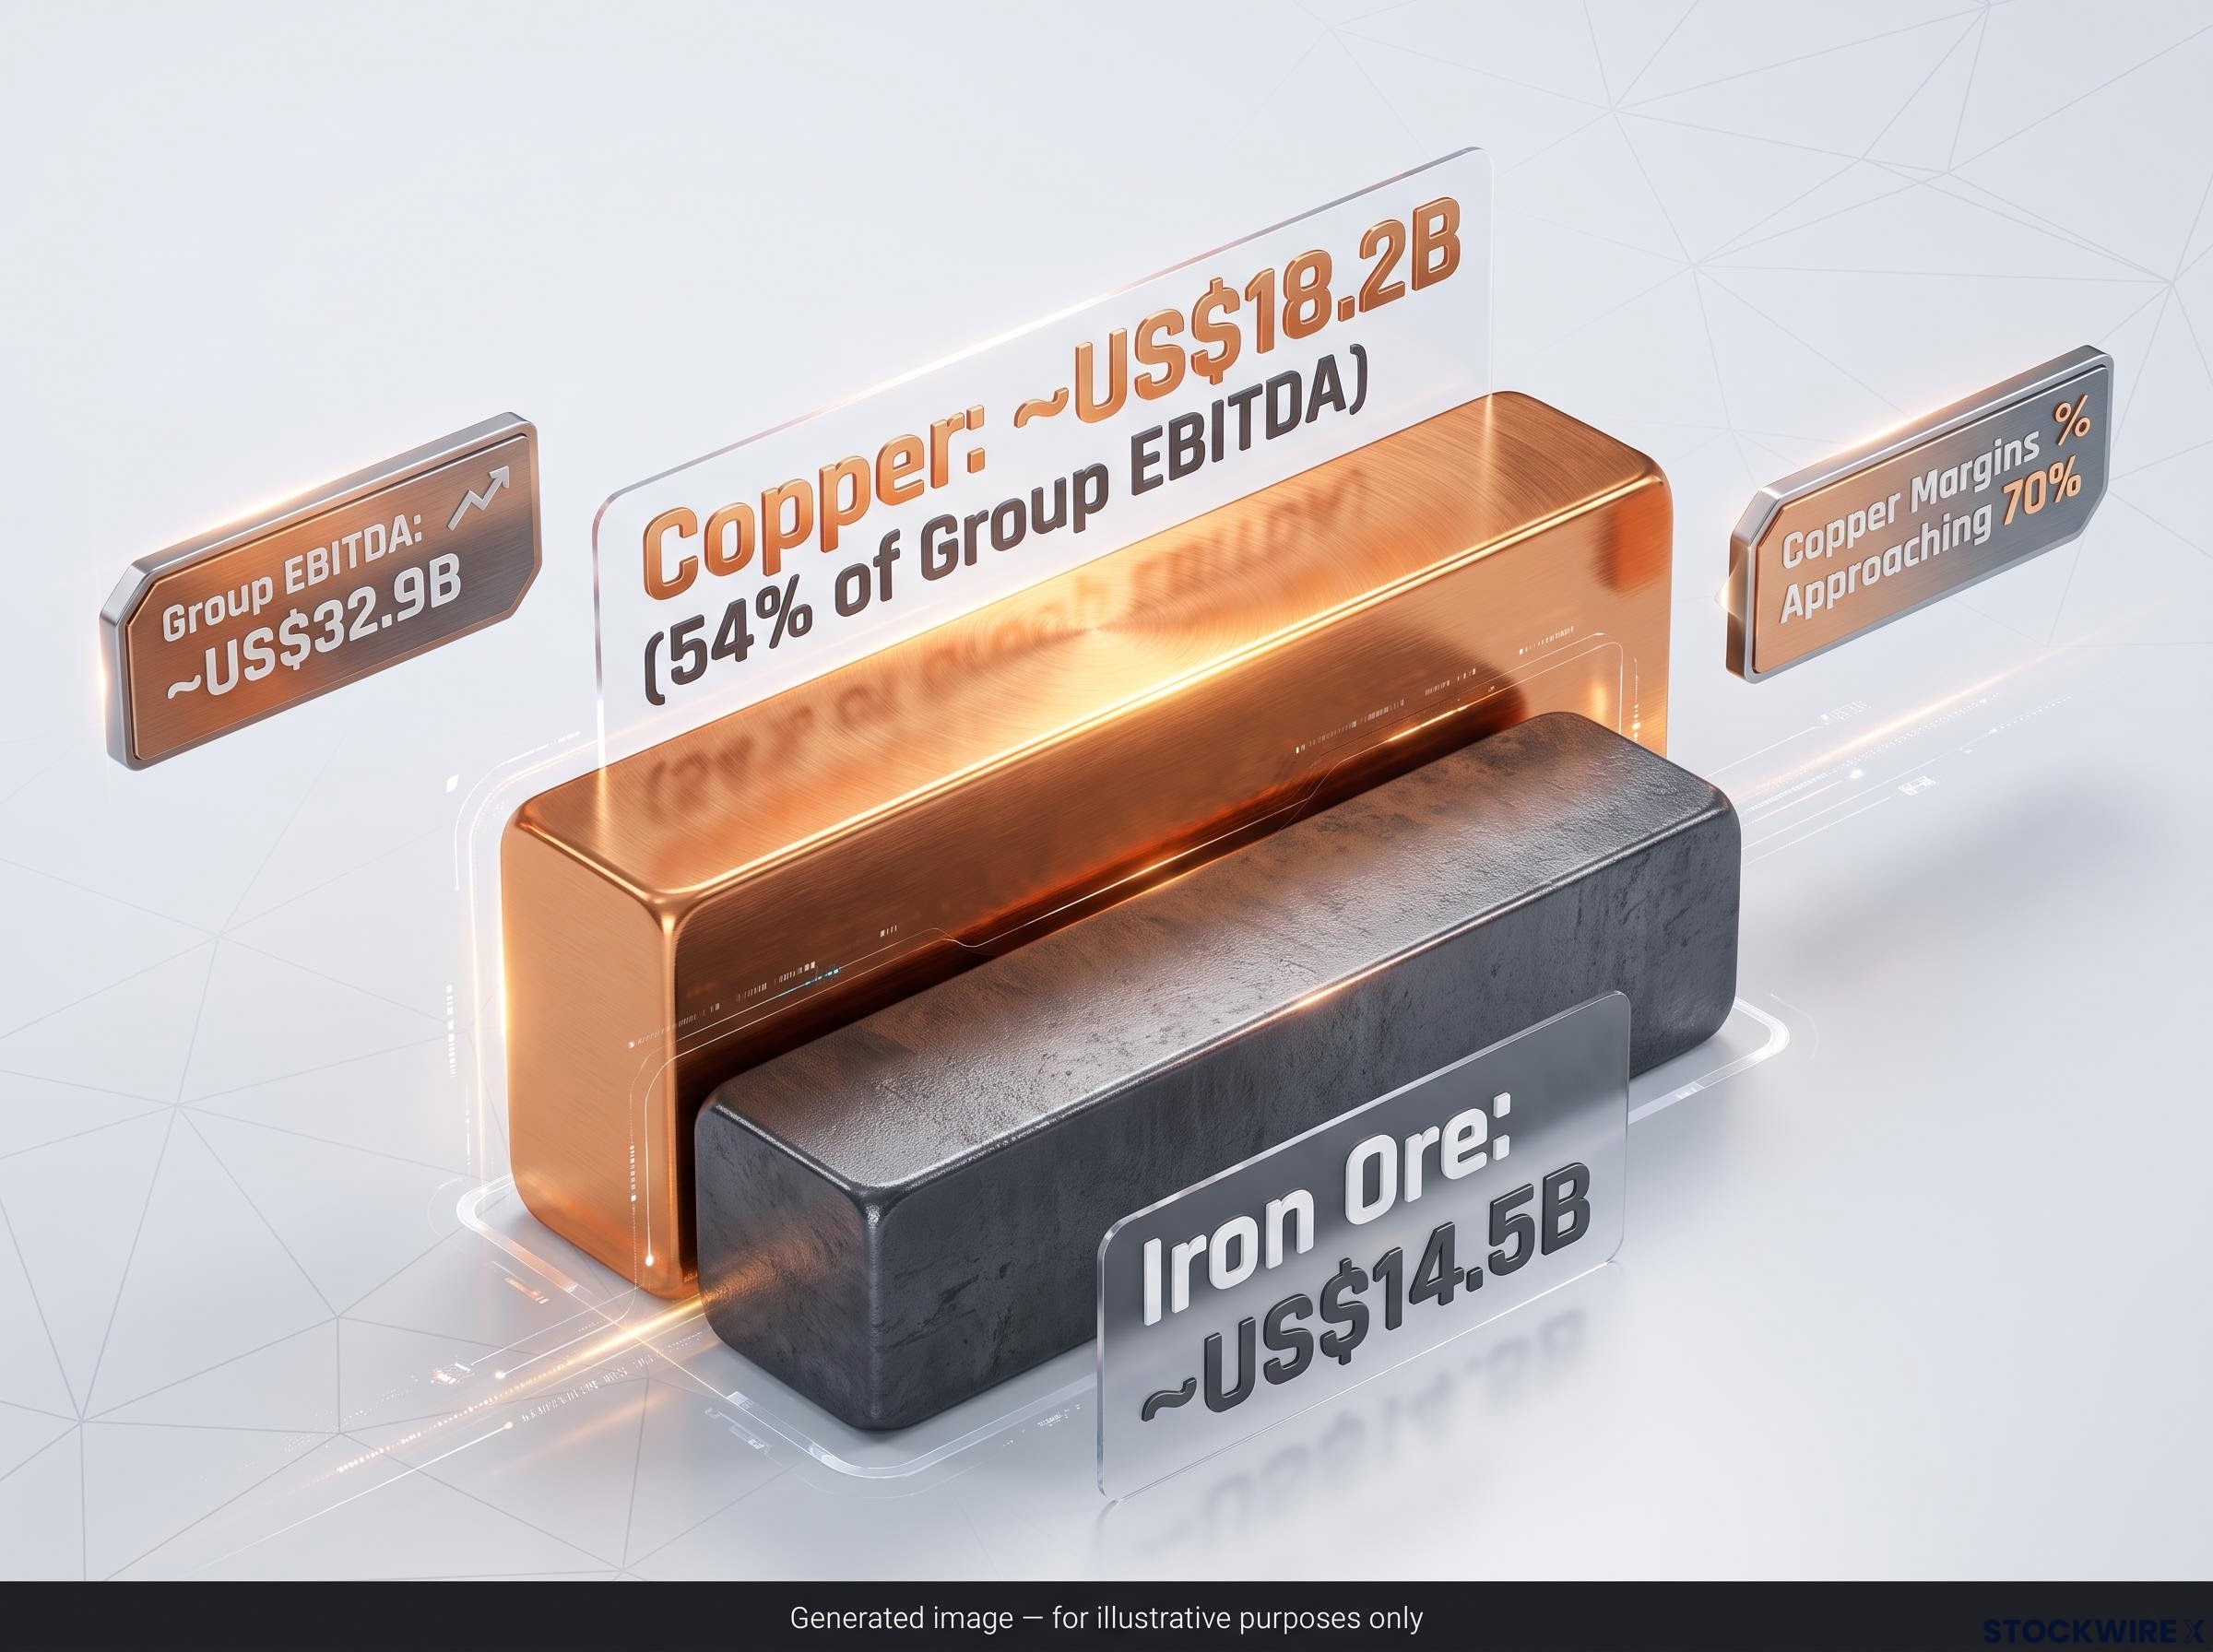
BHP’s FY26 headline numbers were strong by any measure. Underlying EBITDA came in at approximately US$32.9 billion, up 27% year-on-year. Underlying attributable profit reached approximately US$13.2 billion, up roughly 30%. The company declared its highest annual dividend in four years, with a payout ratio of 66%.
Those are impressive numbers. But the real story sits in the divisional breakdown.
Copper division underlying EBITDA rose from approximately US$12.3 billion to around US$18.2 billion. Iron ore came in at approximately US$14.5 billion. For the first time, copper surpassed iron ore as BHP’s primary earnings driver.
Copper contributed roughly 54% of group EBITDA, the first time it has accounted for more than half of BHP’s earnings mix.
| Division | FY26 EBITDA (US$ billion) | FY25 EBITDA (US$ billion) | Share of Group EBITDA |
|---|---|---|---|
| Copper | ~US$18.2 | ~US$12.3 | ~54% |
| Iron Ore | ~US$14.5 | — | Below 50% |
| Group Total | ~US$32.9 | Up 27% YoY | 100% |
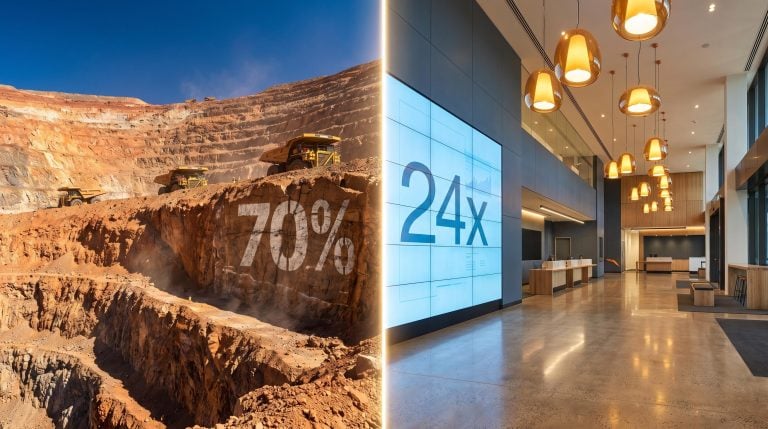
Two forces drove the copper result: approximately 3% production growth to nearly 2 million tonnes, and a roughly mid-30% copper price rise over the fiscal year, supported in part by elevated US import volumes as buyers moved to secure supply before prospective tariff changes took effect. Copper segment EBITDA margins (a measure of how much profit is generated per dollar of revenue) moved toward 70%, significantly above other divisions.
The copper supply deficit underpinning BHP’s margin expansion is projected to more than double in 2026, reaching approximately 520,000 metric tonnes against a 203,000 tonne shortfall in 2025, driven by three simultaneous supply failures including China’s sulphuric acid export halt and Freeport-McMoRan’s Grasberg force majeure.
BHP shares rose approximately 4% on results day. That is a more restrained reaction than CSL’s, but it reflects a different kind of repricing. The 54% copper EBITDA share signals that BHP’s earnings are now more exposed to electrification demand than to the China construction cycle, which changes how investors should model the stock’s risk profile going forward.
Understanding why copper and plasma became this season’s dominant earnings themes
Step back from the two specific results and a structural pattern becomes visible. These were not coincidental beats. They were the product of forces that have been building for years and are now showing up in the earnings.
The copper demand case is structural, not cyclical:
The reclassification of copper as a structural infrastructure input, rather than a cyclical commodity, is what separates the current demand cycle from prior commodity booms; AI hyperscale data centres alone consume 15,000 or more tonnes of copper per facility, a demand stream locked into multi-year capex cycles that does not respond to short-term price signals.
- Electrification infrastructure buildout across major economies
- Electric vehicle adoption requiring significant copper per unit
- Data centre construction consuming large volumes of copper wiring and components
- Grid investment programmes needed to support all of the above
These demand drivers are not going away in the next quarter. They support a prolonged period of elevated prices and strong margins for low-cost producers like BHP, which helps explain why copper segment margins are approaching 70%.
On the healthcare side, CSL’s recovery pillars are similarly durable:
- The plasma franchise remains the core earnings engine underpinning FY27 guidance
- A broader market rotation away from crowded AI and technology exposures has created receptive conditions for re-entry into quality healthcare names
- Credible FY27 guidance of approximately 5% NPAT growth provided the catalyst that sidelined capital needed
If copper demand is structurally elevated by electrification and CSL’s plasma franchise is structurally intact, then both results reflect durable earnings power rather than one-off conditions. That is the single most important judgment for investors deciding whether to act at current valuations: are you buying a cyclical bounce, where the move is largely done, or a structural re-rating, where further upside is available?
How CSL and BHP compare at current valuations, and what the risks are
Two stocks that have already moved significantly still need to be evaluated on what you are actually paying for today, not what the move looked like on results day.
CSL is trading in the mid-to-high $160s following the rally, having recovered approximately 75-80% from its multi-year lows. That is a substantial move, but the stock still trades below some broker target ranges, suggesting further upside is available if the recovery narrative is confirmed by subsequent execution.
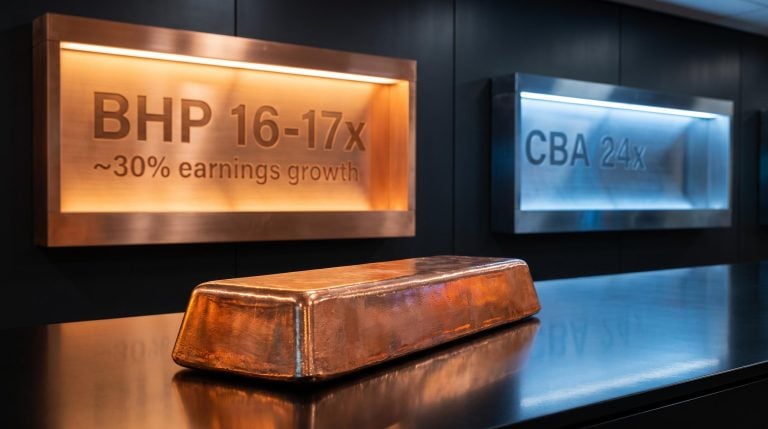
BHP is priced at roughly 16-17 times earnings, while CBA sits at around 24 times. On a percentage basis, BHP’s dividend yield is also superior to CBA’s. A miner with double-digit earnings growth and a four-year-high dividend trading at a 35-40% P/E discount to Australia’s largest bank is the kind of valuation gap that tends to attract attention.
| Metric | CSL (Post-Result) | BHP (Post-Result) | CBA (Benchmark) |
|---|---|---|---|
| P/E Multiple | Recovering; below some broker targets | ~16-17x | ~24x |
| Dividend Yield | Maintained | Higher than CBA (% basis) | Lower than BHP |
| Earnings Growth Direction | FY27 guidance: ~5% NPAT growth | ~30% profit growth in FY26 | Slower growth profile |
| Key Risk Factor | No permanent CEO; generic competition | Copper price sensitivity | — |
But valuation discounts are not free lunches. Both stocks carry specific risks that investors need to price in before acting.
CSL risk factors at current levels
- Leadership continuity remains unresolved, with Gordon Naylor continuing in the CEO role without a permanent appointment confirmed
- Generic competition in the iron deficiency treatment segment (from the Vifor portfolio) continues to pressure that revenue line
- The US vaccine regulatory environment under Robert Kennedy Jr. creates ongoing uncertainty for that division
- The Aquarius demerger has been shelved without formal announcement, removing a potential value-unlocking catalyst
Four observable CSL turnaround checkpoints will determine whether the August rally marks a genuine re-rating or a sentiment bounce: consecutive NPATA and margin improvement, Vifor gross margin stabilisation, a permanent CEO appointment, and Seqirus strategic clarity, each of which remains unresolved as of the result date.
BHP risk factors at current levels
- Samarco dam disaster exceptional charges totalled approximately $3.4 billion after tax in FY26, an ongoing legal and financial overhang separate from operating performance
- Copper price sensitivity is real: a mid-30% price rise underpinned FY26 results, and any material reversal would compress segment EBITDA disproportionately given operating leverage
- The Jansen potash project requires significant upfront capital and carries execution risk on timeline and cost
The BHP valuation discount to CBA is compelling on paper, but investors should understand whether they are comfortable with copper price risk before treating it as a mispricing.
This article is for informational purposes only and should not be considered financial advice. Investors should conduct their own research and consult with financial professionals before making investment decisions. Past performance does not guarantee future results.
What the season’s two biggest moves tell investors about the weeks ahead
Both rallies shared a common setup, and that setup is the most useful thing to take from this reporting season. Three conditions created the potential for outsized moves:
- Stocks significantly sold down relative to fundamentals, creating compressed valuations where even adequate results could trigger re-ratings
- Elevated short interest acting as a potential amplifier, forcing covering into rising markets once the bear case weakened
- Sectors with improving structural narratives (electrification for copper, healthcare rotation for plasma) providing the receptive backdrop for long-only capital to re-enter
Not every beaten-down stock with short interest recovers on results day. CSL required the result to not confirm the worst. BHP required actual earnings delivery, not just the absence of bad news. The distinction matters.
“Not every beaten-down stock with short interest recovers. The setup requires the result to not confirm the worst, not necessarily to exceed the best.”
With one week of reporting season remaining, these conditions exist in other names, particularly across healthcare and critical minerals. The framework is not about predicting which stock moves next. It is about understanding the setup variables that turn an adequate result into a large price move, so you can evaluate positions and exposure before results land, not after.
One week of reporting season left: what the two standout results change
Two themes now sit at the centre of this ASX reporting season. First, sentiment unwinding creates disproportionate moves, and the speed of CSL’s repricing shows how violently that can happen when results remove the bear case. Second, structural earnings shifts (copper majority, plasma recovery) justify re-rating rather than regression to the prior price.
CSL has recovered substantially but remains below some broker targets. BHP’s copper transformation is now visible in the earnings mix, but the stock still trades at a meaningful discount to other ASX heavyweights.
The practical question for the final week is straightforward. Do the setup conditions that drove these two moves, sold-down valuations, short interest, and structural tailwinds, apply to any existing holdings or watchlist names? And do current valuations in CSL and BHP reflect the full recovery, or leave room to participate? Those are the two calls that matter most before the season closes.