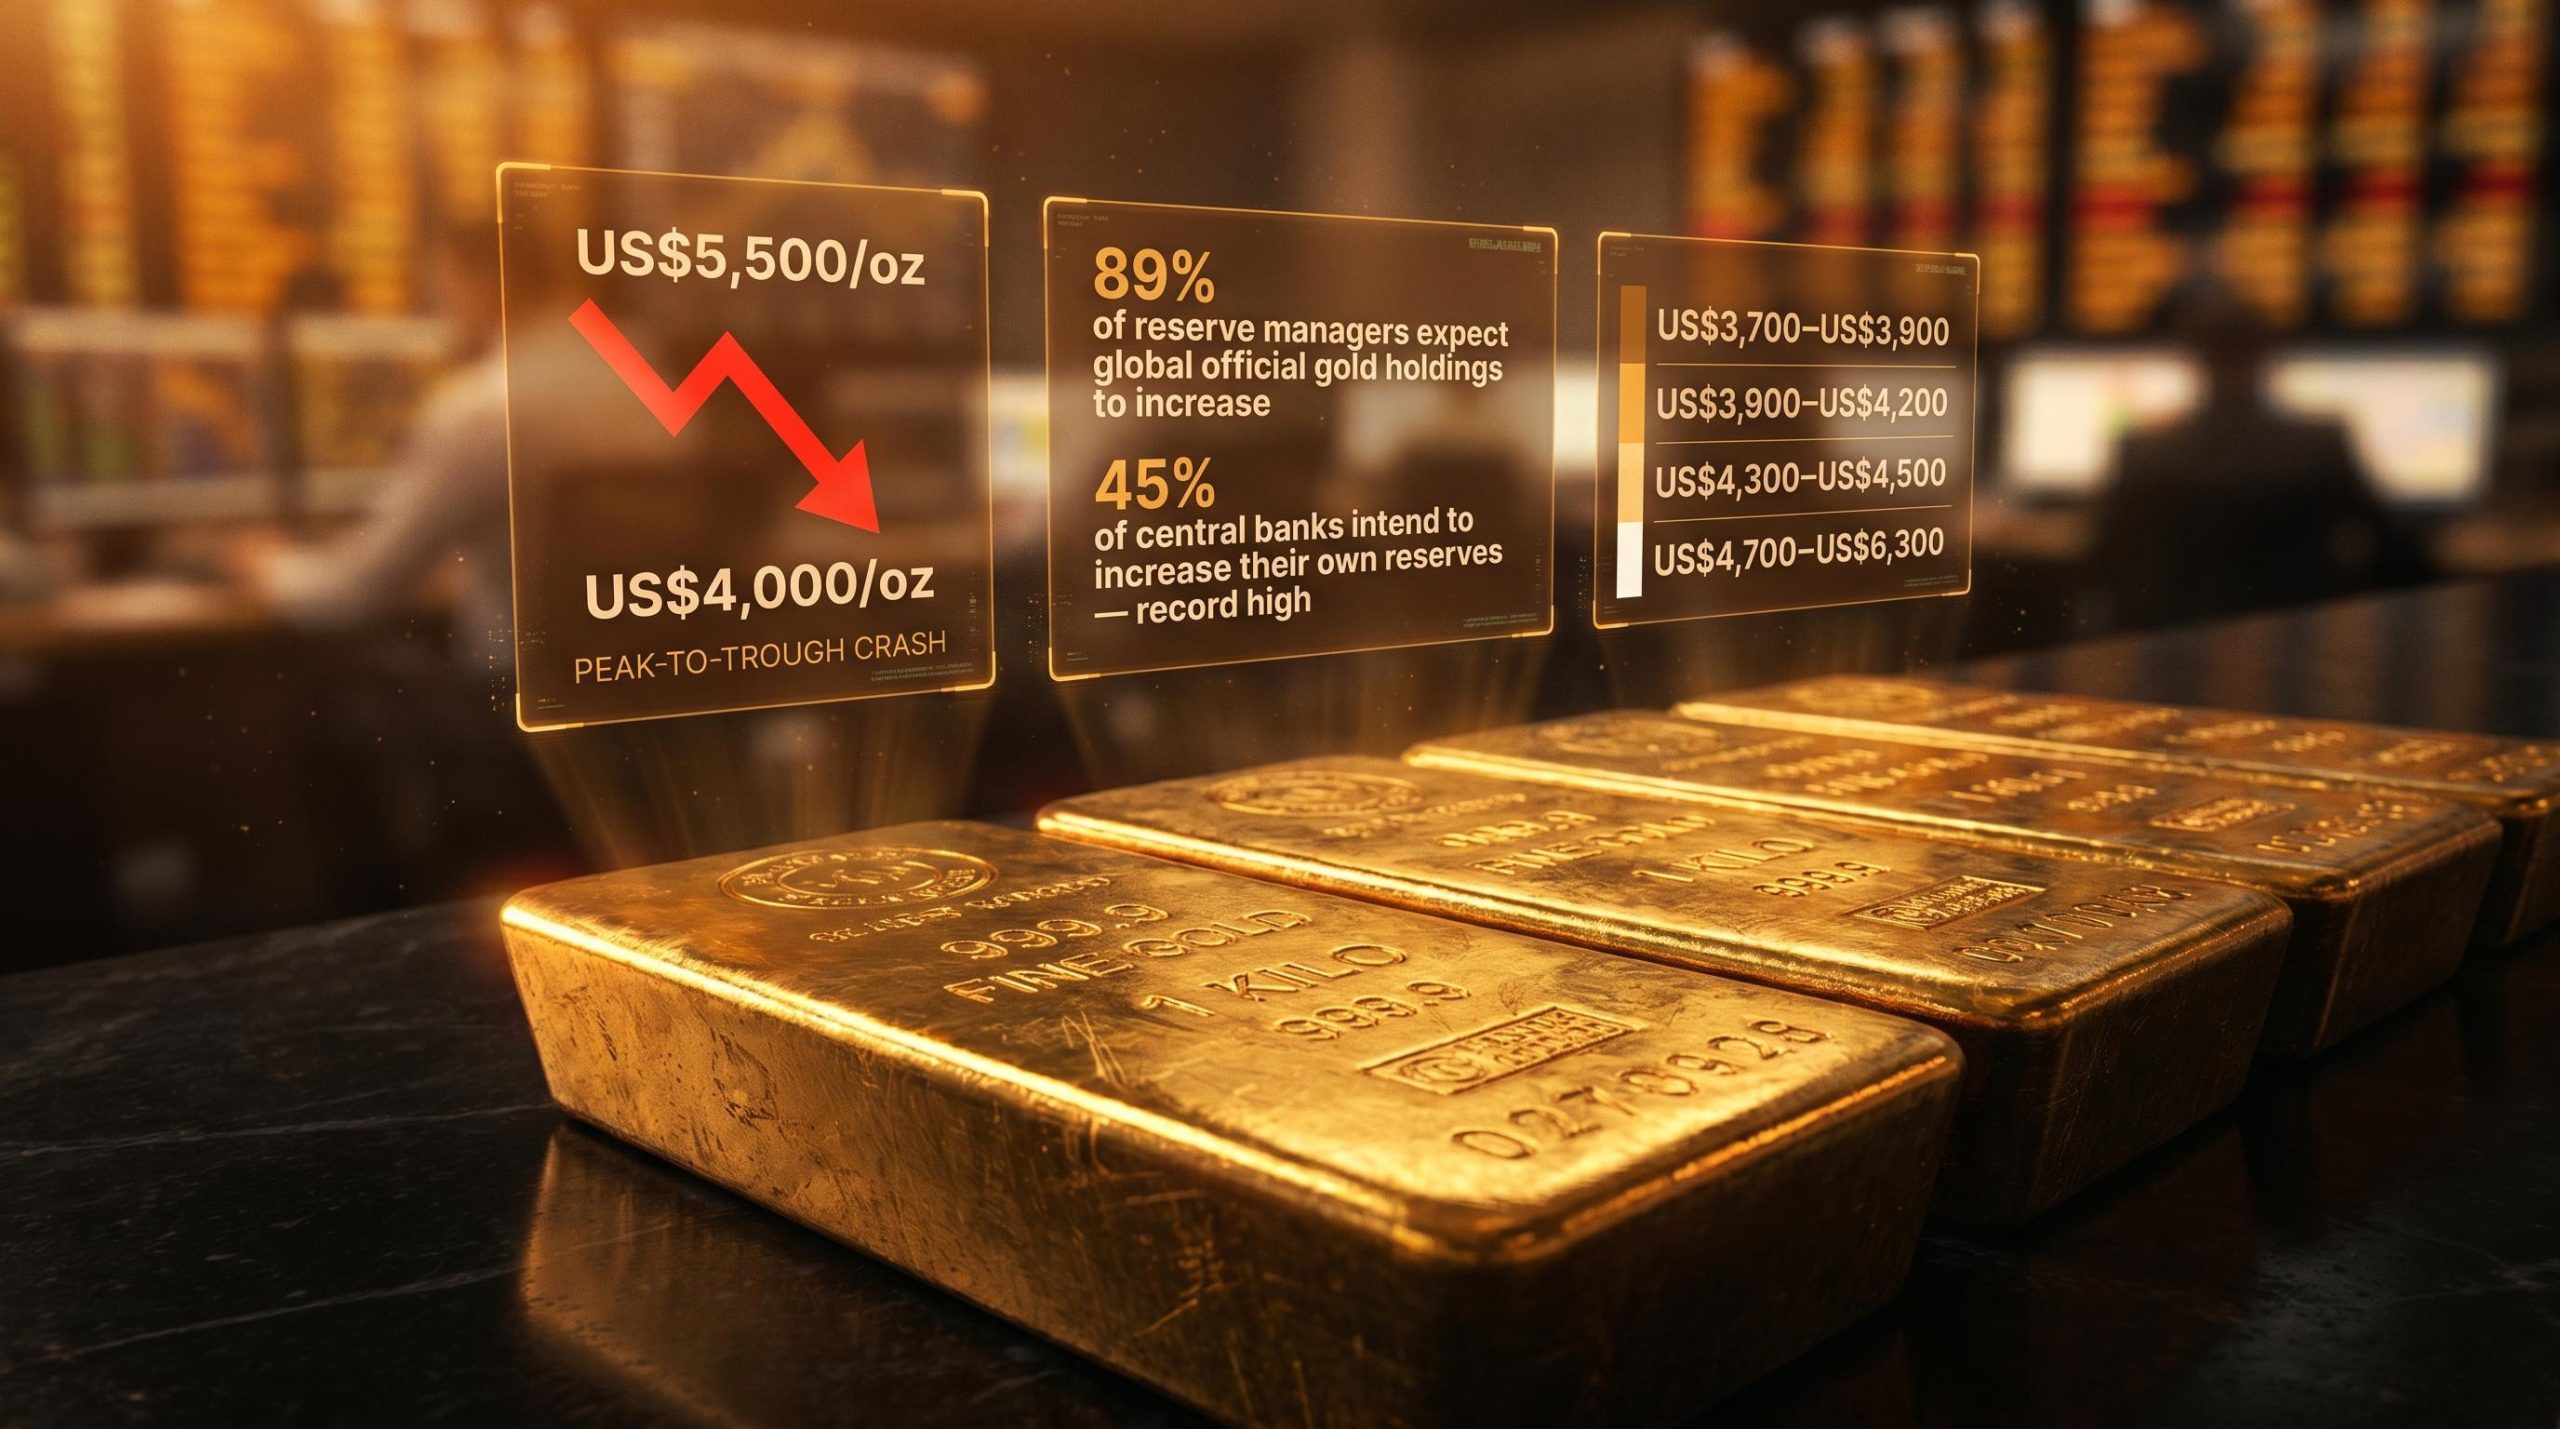
Gold ran from a peak above US$5,500/oz in late January 2026 to near US$4,000/oz by June 2026. That is a decline of more than US$1,500/oz in under six months, making it one of the most dramatic first-half reversals in recent memory for any major asset class.
The same metal has produced wildly different results depending on when investors entered. Someone who bought in December 2025 is sitting on significant losses. Someone who waited until June may be looking at a generational entry point. The question is not whether gold fell hard; it did. The question is whether the selloff represents structural damage to the bull case or a corrective washout that resets the next leg higher.
Here is what matters heading into the second half of 2026: the specific price zones where risk and opportunity shift, what the Federal Reserve’s next move means for your gold position, and why central banks are still buying aggressively even as retail traders have retreated. Each of those threads points somewhere specific, and by the time you finish this, you will know how to read them together.
What actually happened to gold in the first half of 2026
The first half of 2026 packed an entire market cycle into just six months. Prices surged above US$5,500/oz in late January, driven by the escalation of the US-Iran conflict and a rush of speculative capital chasing momentum. Realised volatility, which measures the actual magnitude of daily price swings, exceeded 50% during the conflict’s most acute phase, amplifying positioning in both directions.
Then the panic faded. As geopolitical tensions eased, the same momentum capital that had driven the surge reversed course. Gold retreated steadily toward US$4,000/oz by June, shedding more than US$1,500/oz from its peak.
The gold bear market mechanics that drove the H1 decline were well-documented before the year began: the World Gold Council’s own 2026 outlook had modelled a 5-20% correction under adverse rate or dollar conditions, meaning the eventual drawdown was a known tail risk rather than an unpredictable shock.
What drove the exit
The data confirms the selling was overwhelmingly speculative and institutional momentum money, not long-term conviction capital:
- Gold peaked above US$5,500/oz in late January 2026 before retreating toward US$4,000/oz by June 2026
- Realised volatility exceeded 50% during the US-Iran conflict phase
- Global gold ETFs recorded net outflows of US$8.9 billion in June 2026 alone
- North American institutional gold fund allocations hit their lowest first-half level since 2013
That distinction matters for how you read the correction. The capital that left was primarily short-term momentum money, the kind that piles in during a crisis and exits once the acute fear dissipates. The longer-term buyers whose presence signals structural conviction have not disappeared. What happened in H1 was a speculative washout, not a fundamental breakdown, and the type of capital driving the selloff tells you which interpretation carries more weight.
When big ASX news breaks, our subscribers know first
Why central banks are still buying at these prices
If gold fell this hard, why is anyone still buying? The answer is that the category of buyer with the longest time horizon and the deepest pockets never stopped.
Official sector purchasing has continued through the correction without meaningful hesitation. Unlike ETF investors or retail traders, central banks are guided by an entirely different set of priorities. Rather than chasing price momentum, they are building gold positions as a long-term strategic reserve asset, and that sustained commitment acts as a structural price floor with a character quite unlike speculative buying support.
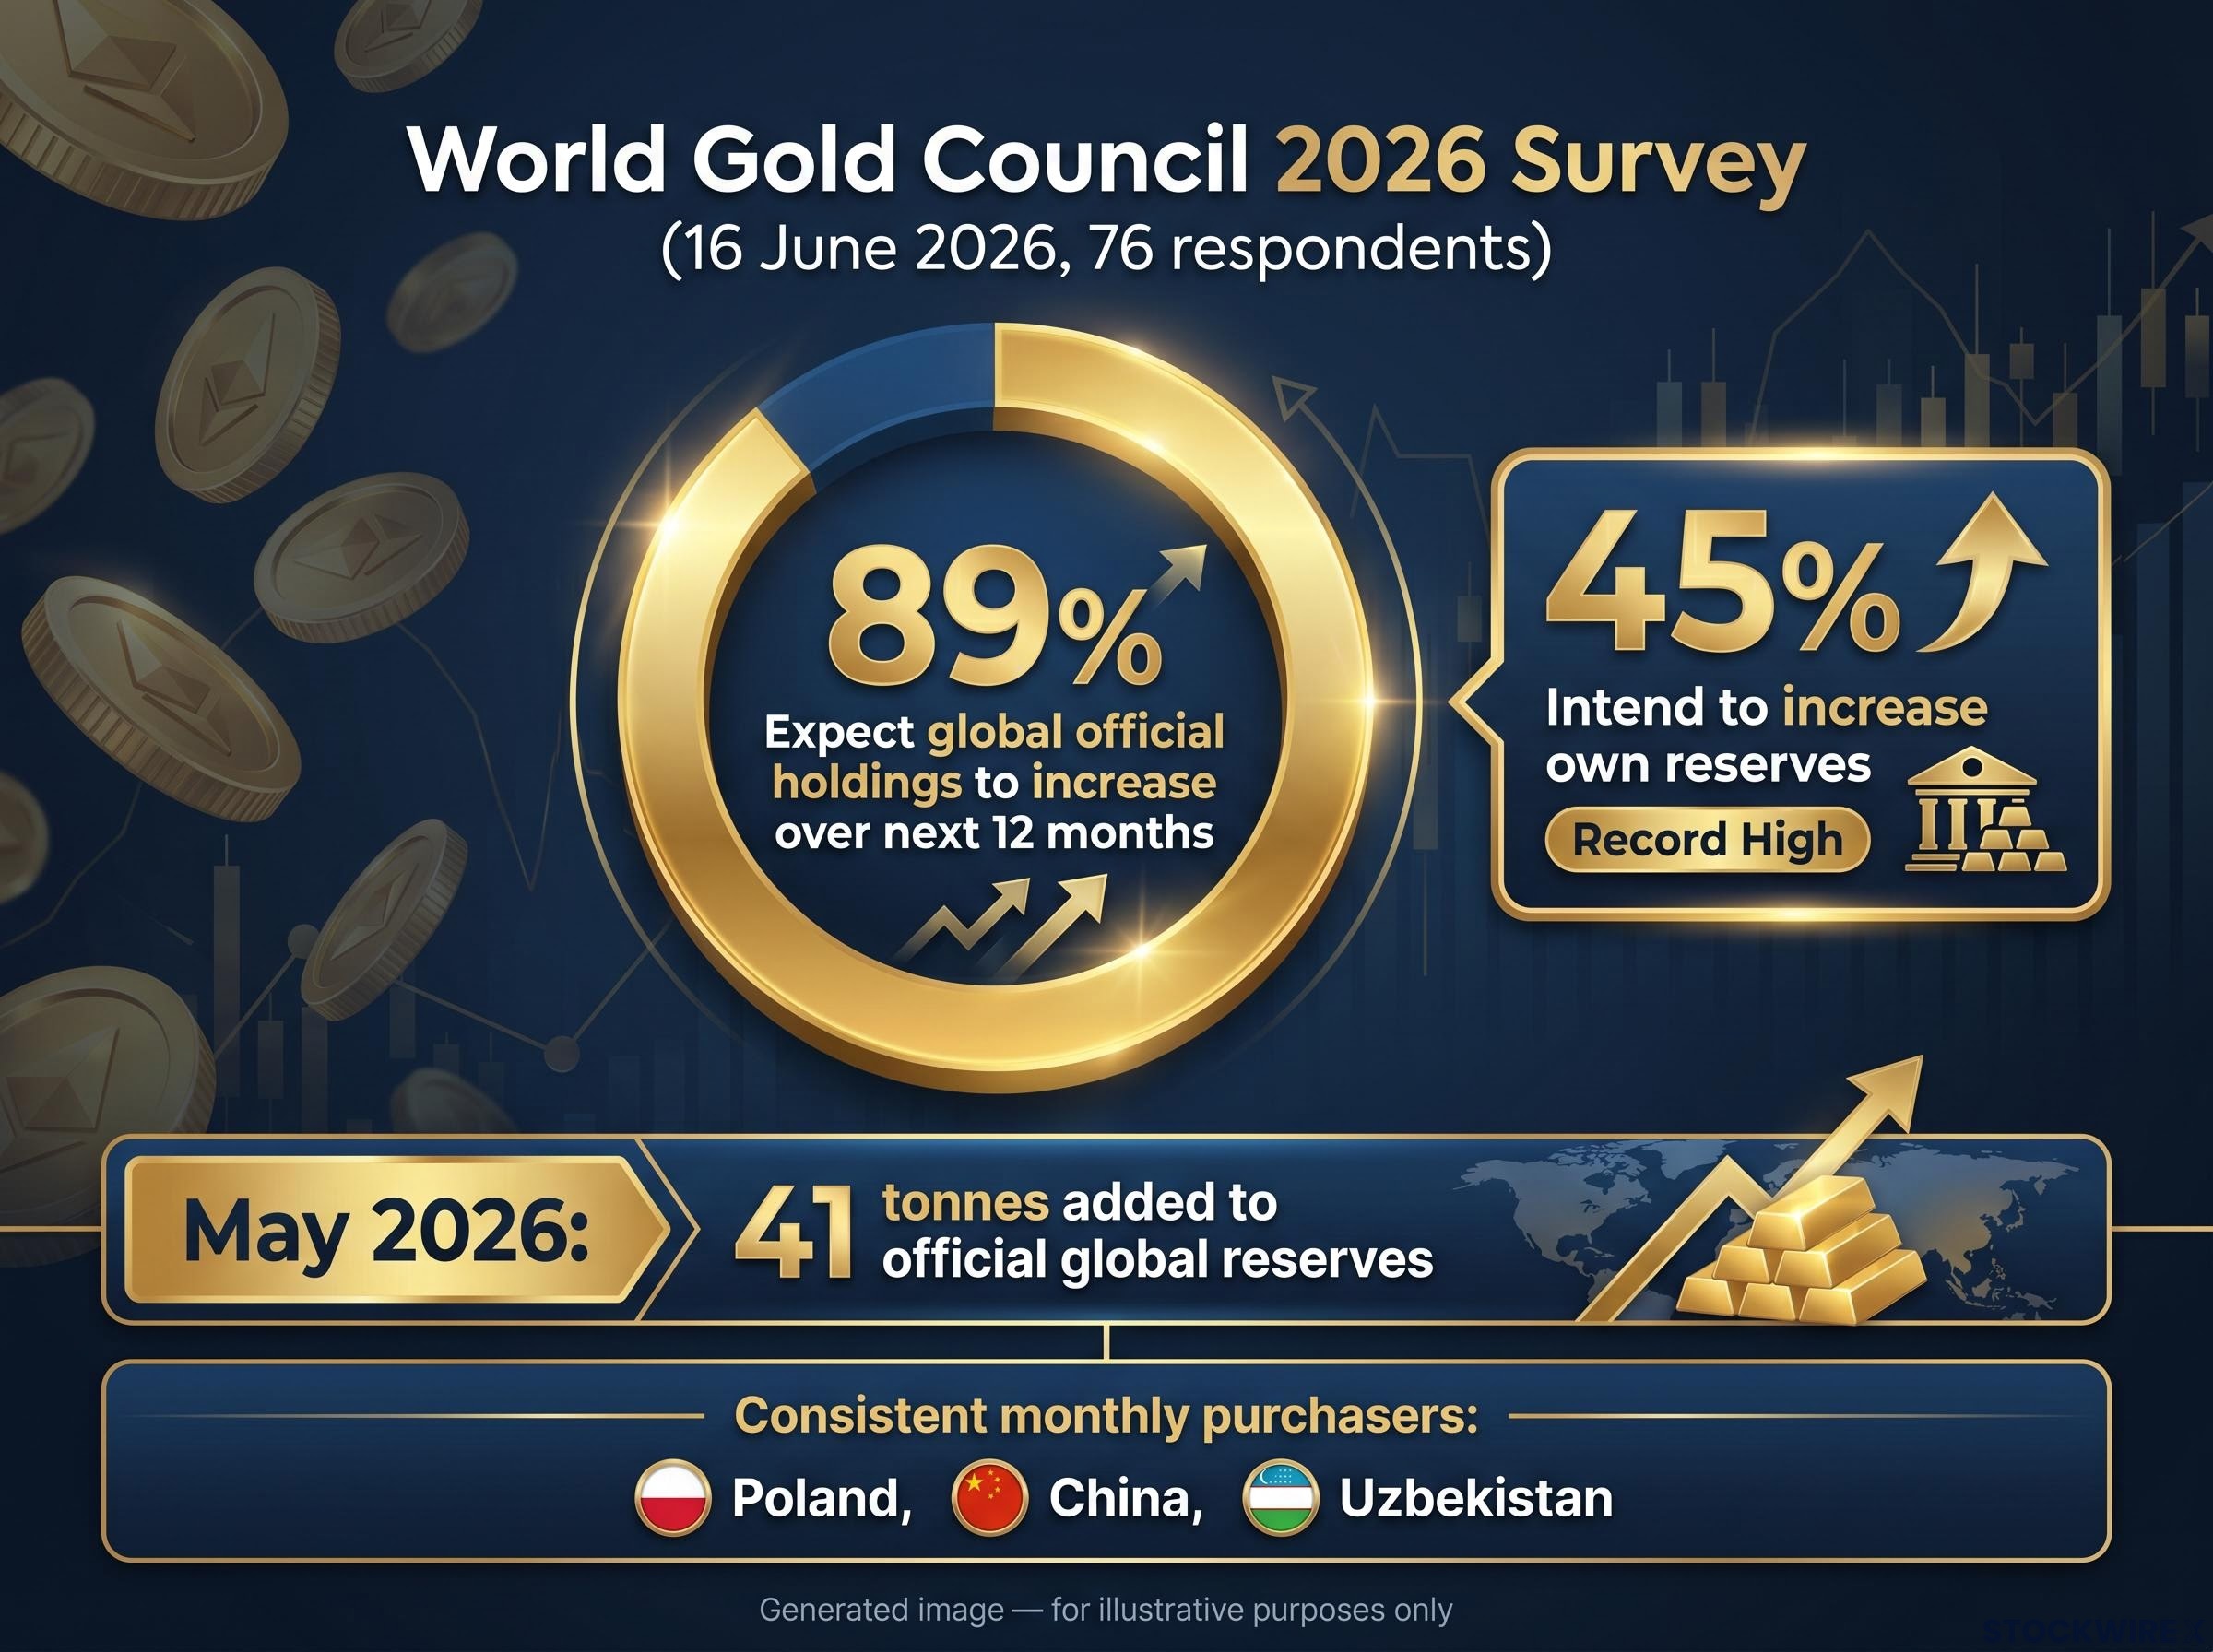
The World Gold Council’s 2026 Central Bank Gold Reserves Survey, released on 16 June 2026 with 76 respondents, sets out in measurable terms just how purposeful and long-horizon this accumulation has become:
89% of reserve managers surveyed expect global official gold holdings to increase over the next 12 months.
That figure is the section’s anchor. It tells you that the world’s most patient capital views the current price zone as a buying level, not an exit level.
- A net 41 tonnes were added to official global gold reserves in May 2026 alone
- A record 45% of central banks intend to increase their own reserves, the highest share since the survey began
- Poland, China, and Uzbekistan have maintained consistent monthly purchasing programmes throughout the correction
When a record share of sovereign reserve managers signals intent to increase holdings even after a pullback of this magnitude, the directional signal carries weight. These are not traders reacting to price action. They are institutions repositioning national balance sheets, and their buying compresses the downside, making deep, disorderly price cascades progressively less likely even if further pullbacks remain possible.
How the Federal Reserve became the most important variable for gold
Central bank demand provides a structural floor, but the near-term direction of gold prices hinges on a single macro variable that overrides everything else: the Federal Reserve’s rate path under Chair Kevin Warsh.
The mechanism is straightforward. Gold does not pay interest or a dividend. When the Fed raises rates, real yields (the return investors earn above inflation on government bonds) rise, and the opportunity cost of holding a non-yielding asset like gold increases. Higher rates also tend to strengthen the US dollar, which competes directly with gold as a store of value. The combination of rising real yields and a stronger dollar creates a double headwind for gold prices.
The real yield transmission mechanism worked against gold even as the conflict was escalating: elevated energy prices fed directly into inflation expectations, triggered hawkish Fed repricing, and pushed Treasury yields roughly 60 basis points higher, producing a dynamic where geopolitical risk and monetary tightening pulled price in opposite directions simultaneously.
The baseline context is established: Warsh has taken a clearly hawkish position, with market participants broadly pricing in a rate increase by October 2026.
The two scenarios that determine gold’s H2 direction
What matters is not whether a hike happens but what comes after it. The distinction between a single contained hike and the beginning of a sustained tightening cycle produces two fundamentally different gold outcomes:
- Scenario A (one-and-done): With just one rate increase, the dollar’s upward momentum is likely to exhaust itself heading into Q4 2026 as markets conclude the tightening cycle is complete, opening the door for gold to climb back toward US$4,300/oz-US$4,500/oz once the real yield pressure subsides.
- Scenario B (multi-hike): Should stubborn inflation or strong growth data push policymakers toward a series of further increases, elevated real yields and a firm dollar would cap gold’s recovery and bring US$3,700/oz-US$3,900/oz into play as the next meaningful support test.
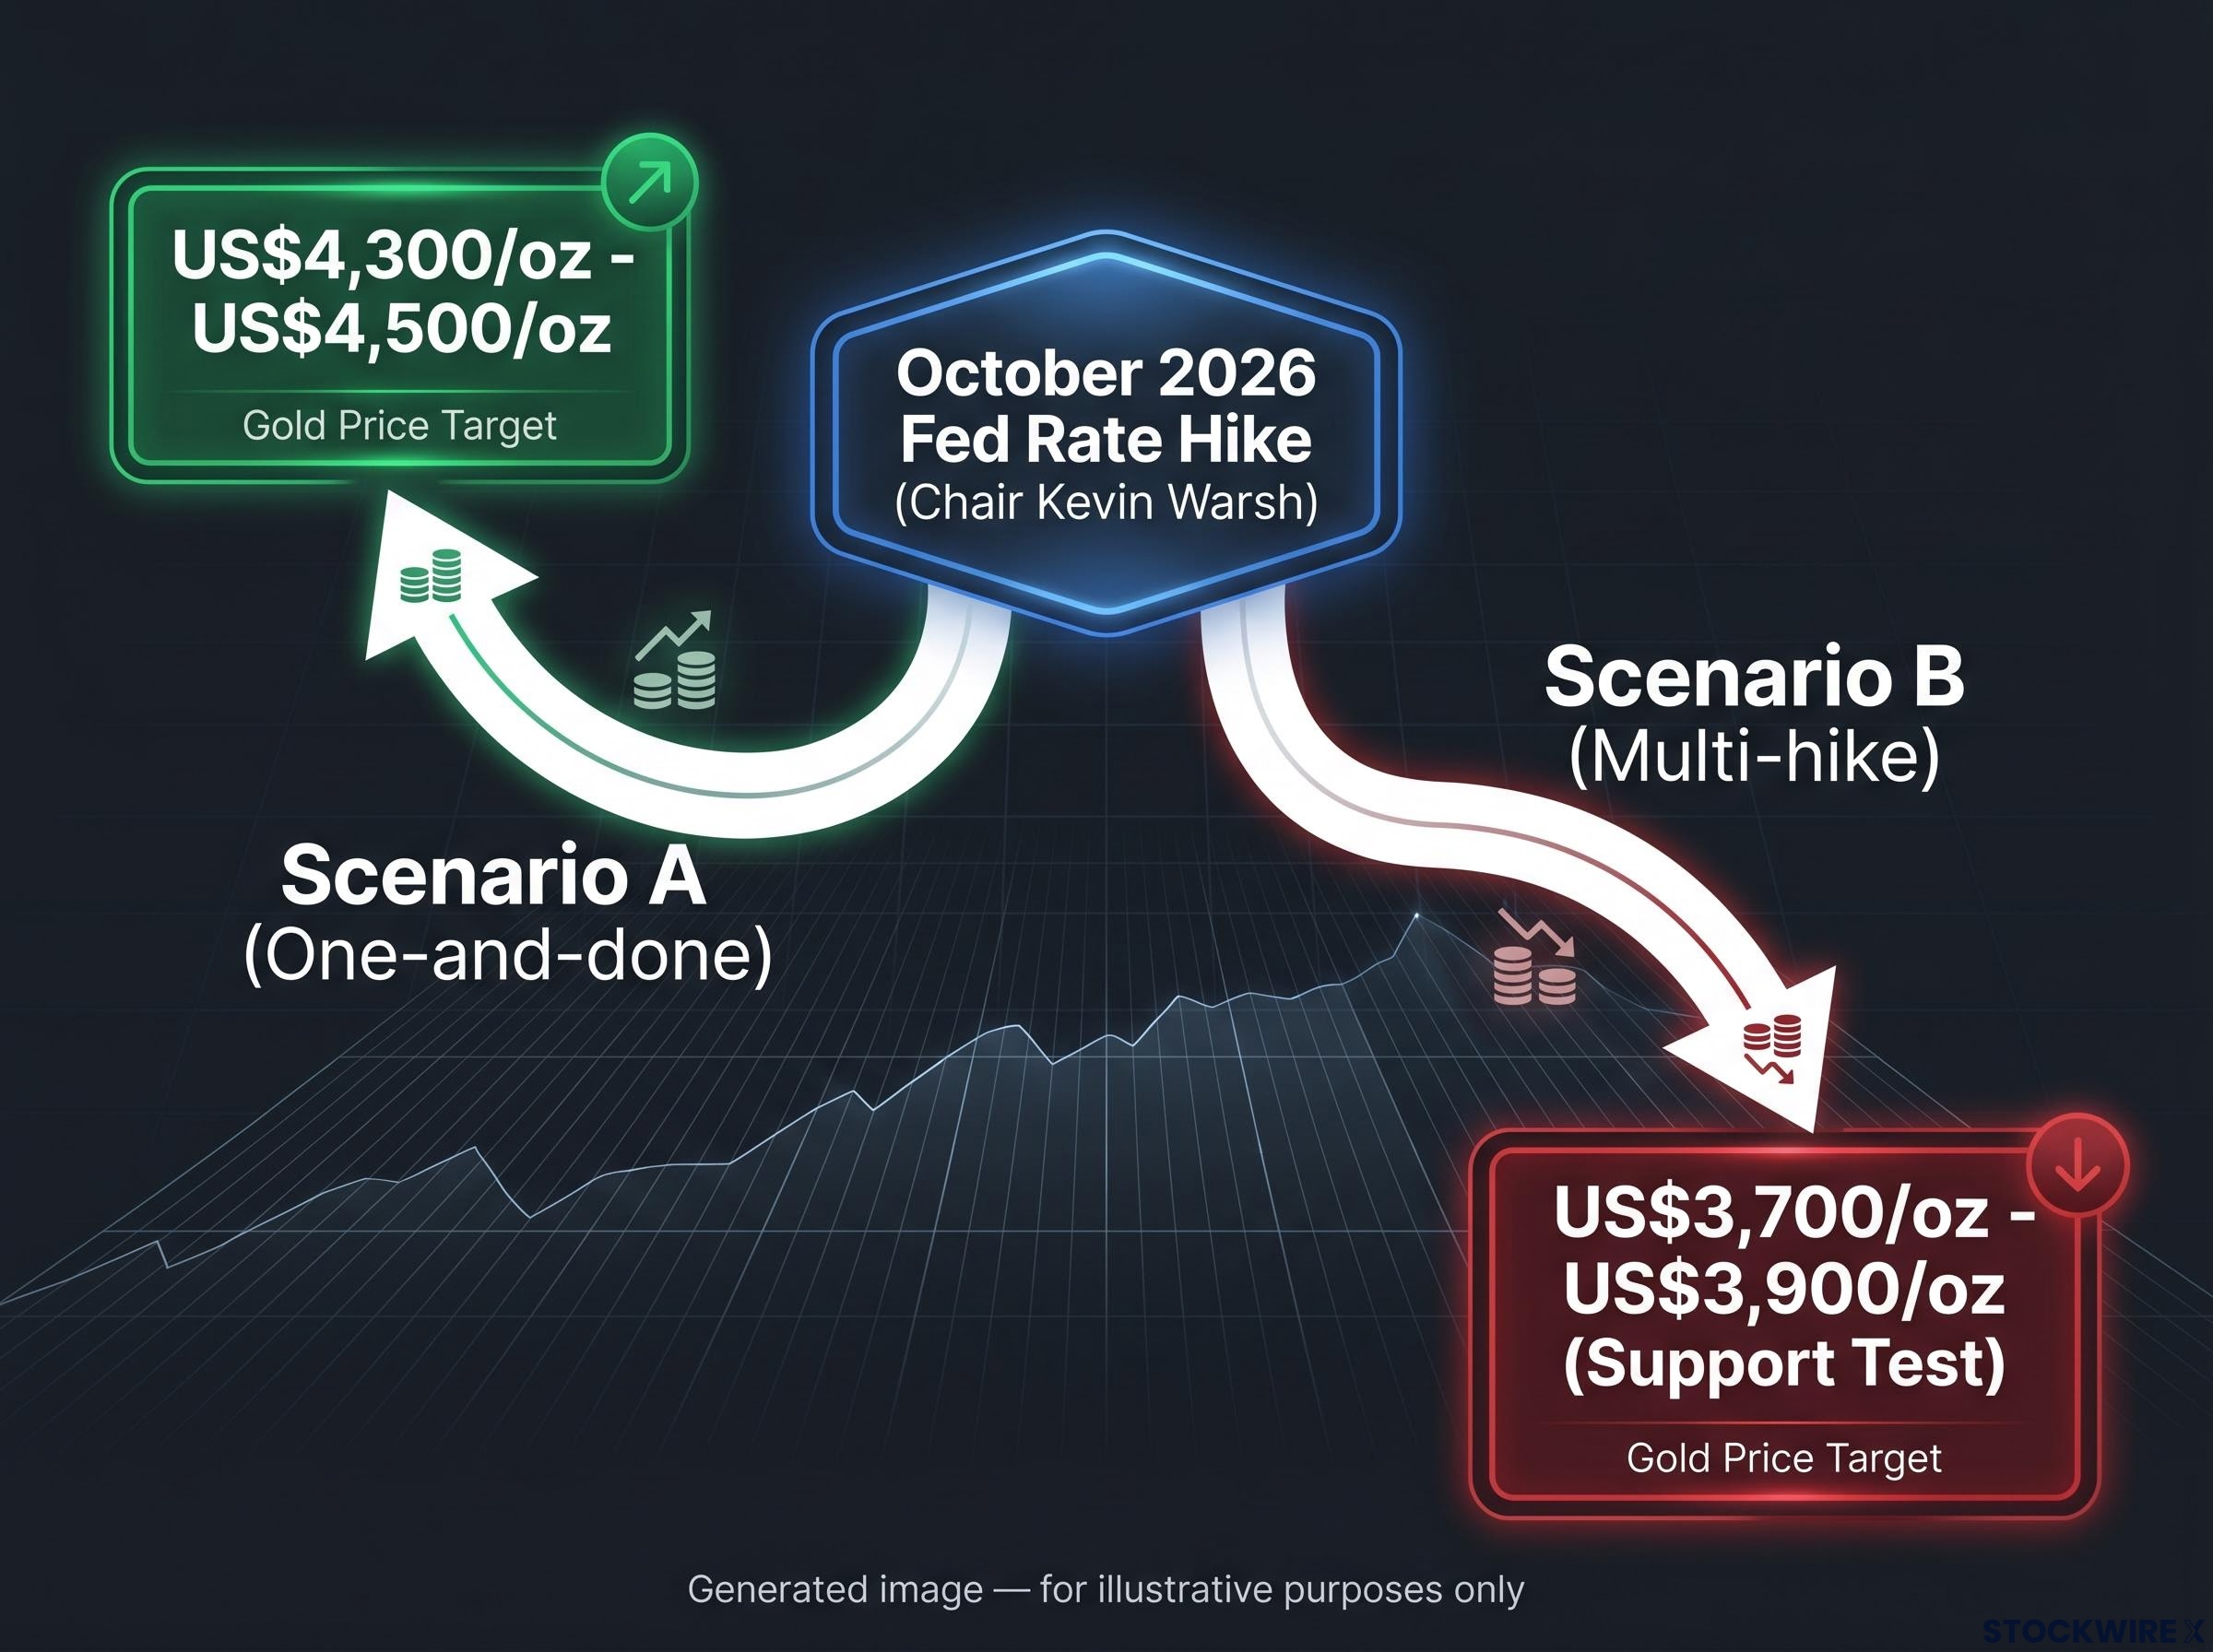
Both scenarios are genuinely plausible at this point. The reason this matters so specifically for you is that the two outcomes point in opposite price directions, and the signals to watch between now and October are the same ones that will tell you which path is unfolding: inflation readings, Fed communications on the pace of tightening, and the trajectory of the US dollar index.
Where the institutional consensus currently sits on gold’s year-end price
The spread of institutional forecasts tells you something important about the current moment: major banks see gold significantly above where it trades today, but the range of those forecasts is wide enough to reflect honest uncertainty about the macro path.
| Source | Forecast Price | Timeframe |
|---|---|---|
| J.P. Morgan | ~US$6,000/oz (US$6,300 into 2027) | Q4 2026 average |
| World Bank | ~US$4,700/oz | 2026 average |
| Heraeus (floor) | ~US$3,750/oz | 2026 range low |
| Heraeus (ceiling) | ~US$5,000/oz | 2026 range high |
| One-and-done scenario | US$4,300-US$4,500/oz | Near-term recovery target |
Note: Forecasts attributed to Goldman Sachs (~US$4,900-US$5,400), Wells Fargo (~US$6,100-US$6,300), UBS (~US$5,500), and Bank of America (~US$6,000) have been cited in industry commentary but have not been independently verified. Readers should confirm these figures directly with institutional sources before relying on them for decision-making.
For investors wanting to stress-test the institutional forecasts in the table above before acting on them, our full explainer on why gold forecasting rules fail examines three documented rate cycles where gold did the opposite of what every standard model predicted, with direct relevance to the current Fed-driven environment.
The gap between where gold trades today (near US$4,000/oz) and where these institutions see it in 12 months (US$4,700/oz to above US$6,000/oz) is the core commercial signal here. Even the most conservative credible anchor, the World Bank’s April 2026 Commodity Markets Outlook projection of approximately US$4,700/oz, implies meaningful upside from current levels. If those forecasts are even partially correct, the current price represents a discount that patient investors should understand before making a decision.
The World Bank Commodity Markets Outlook for April 2026 placed the gold forecast at approximately US$4,700/oz for the full-year average, making it the most conservative of the major institutional projections and therefore the most useful floor reference when calibrating realistic upside expectations.
The near-term US$4,300/oz-US$4,500/oz recovery target under a one-and-done scenario is best understood as a first step toward the broader institutional consensus, not a ceiling.
A practical price-zone framework for retail investors heading into H2 2026
The institutional forecasts give you the destination; this framework gives you the map for the journey. Four distinct price zones, each carrying a different risk and opportunity profile, provide a structure for interpreting price movements without reacting emotionally to every swing.
| Price Zone | Scenario | Risk Profile |
|---|---|---|
| US$3,700-US$3,900 | Multi-hike Fed path | High-risk accumulation; not a guaranteed floor |
| US$3,900-US$4,200 | H2 2026 consolidation | Realistic base case; patience rewarded |
| US$4,300-US$4,500 | One-and-done Fed recovery | Near-term upside; first step, not ceiling |
| US$4,700-US$6,300 | 12-month institutional consensus | Upside reference; not base case for H2 |
This is a decision framework, not a prediction. The US$3,700/oz-US$3,900/oz zone deserves particular caution: structural central bank demand and institutional forecasts suggest these levels would be “cheap” relative to most year-end targets, but they do not eliminate further downside under a sustained multi-hike Fed scenario. Treating it as a high-risk accumulation zone rather than a guaranteed bottom is the correct framing.
H2 2026 is most likely to see gold spend the bulk of its time within the US$3,900/oz-US$4,200/oz band, a view consistent with quantitative model averages and the Heraeus floor projection of US$3,750/oz. The US-Iran conflict phase earlier this year, when realised volatility surged past 50%, offered a vivid reminder of what genuinely wide trading ranges look like in practice. That tendency toward large swings is unlikely to disappear.
Three principles fit this environment:
- Patience in the consolidation band: The US$3,900/oz-US$4,200/oz range rewards investors who avoid overtrading and let the macro picture clarify.
- Discipline in the accumulation zone: If prices test US$3,700/oz-US$3,900/oz, measured scaling is more prudent than aggressive positioning into the lows.
- Perspective on the upside thesis: The US$4,700/oz-US$6,300/oz institutional range is the destination that justifies the wait, but it is more likely to unfold over quarters than in a single rebound.
Whether the structural bull case for gold survives the 2026 correction
The structural bull case survives. It survives because the two pillars holding it up, central bank accumulation and the institutional forecast consensus, have not cracked under the weight of the H1 correction.
Survey data from the World Gold Council shows that a record 45% of sovereign reserve managers plan to lift their own gold holdings over the next 12 months, the highest reading since the survey was first conducted. The most conservative institutional anchor, the World Bank’s US$4,700/oz 2026 average projection, still implies meaningful upside from current levels. These are not sentiment indicators that shift with short-term price action; they are structural commitments backed by sovereign capital.
That said, H2 2026 remains a high-volatility, Fed-driven environment where further downside is possible. The correction has cleared speculative excess, but it has not eliminated macro risk. Honest assessment requires acknowledging that the near-term path depends on variables that will not resolve until Q4, which means the most important decision right now is not “whether to hold gold” but “how much risk to carry while waiting for clarity.”
Three variables will determine what the second half looks like:
- Fed rate decision outcome: whether the October hike proves to be a single adjustment or the opening move of a sustained tightening sequence
- Central bank accumulation pace: whether the record intent-to-buy translates into sustained monthly purchasing
- US dollar trajectory: whether dollar strength persists through Q4 or fades once the rate decision is priced in
The October rate decision is the next major catalyst. Until then, H2 2026 is consolidation, not collapse, and the outcome depends on which macro forces gain dominance over the next three months.
For investors who want a cross-asset lens on where gold sits within the broader macro cycle, our deep-dive into the Dow-to-gold ratio examines how the ratio’s current level compares with its 50-year average and what prior readings at similar compression levels implied for the multi-year trajectory of gold relative to equities.
This article is for informational purposes only and should not be considered financial advice. Investors should conduct their own research and consult with financial professionals before making investment decisions. Past performance does not guarantee future results. Financial projections are subject to market conditions and various risk factors.