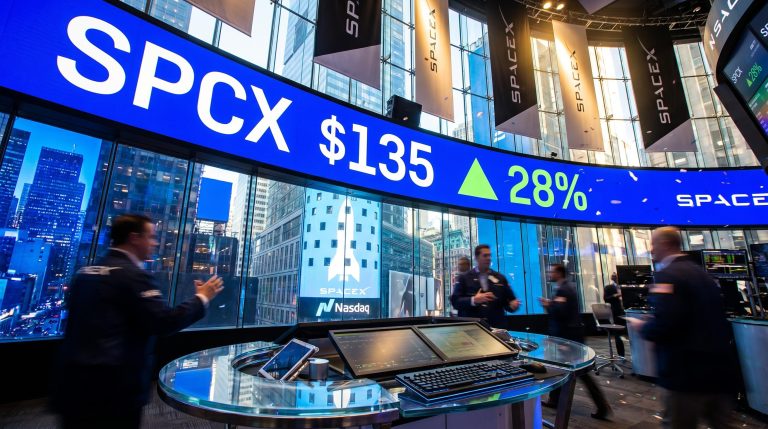
SPCX Surges 28% as SpaceX IPO Rewrites Listing History
5 hrs ago

US headline inflation hit 4.2% year-over-year in May 2026, its highest reading in more than three years. The next day, the European Central Bank (ECB) raised interest rates for the first time since 2023. Two alarming macro headlines in 24 hours, and investor anxiety has responded accordingly.
Both developments landed in quick succession: the Consumer Price Index (CPI) data on Wednesday, 11 June, the ECB’s 25 basis point hike on Thursday, 12 June. The timing alone makes this feel more severe than either event might in isolation. But the data beneath the headlines tell a more specific, and less alarming, story than the numbers suggest at first glance. What follows is a breakdown of what the inflation print actually shows, why the ECB acted, and what investors should genuinely monitor in the weeks ahead.

Gasoline prices rose 40.5% year-over-year in May 2026. That single category, propelled by Iran’s closure of the Strait of Hormuz, which has removed roughly one-fifth of global oil supply from the market since March, is responsible for the bulk of the headline shock.
Energy price increases accounted for more than 60% of the monthly inflation gains in May 2026.
The Bureau of Labor Statistics CPI release for May 2026 confirms that the energy index accounted for over 60% of the monthly all-items increase, with the all-items less food and energy measure rising just 2.9% year-over-year, a figure that sits well within the range central banks have historically tolerated without aggressive tightening.
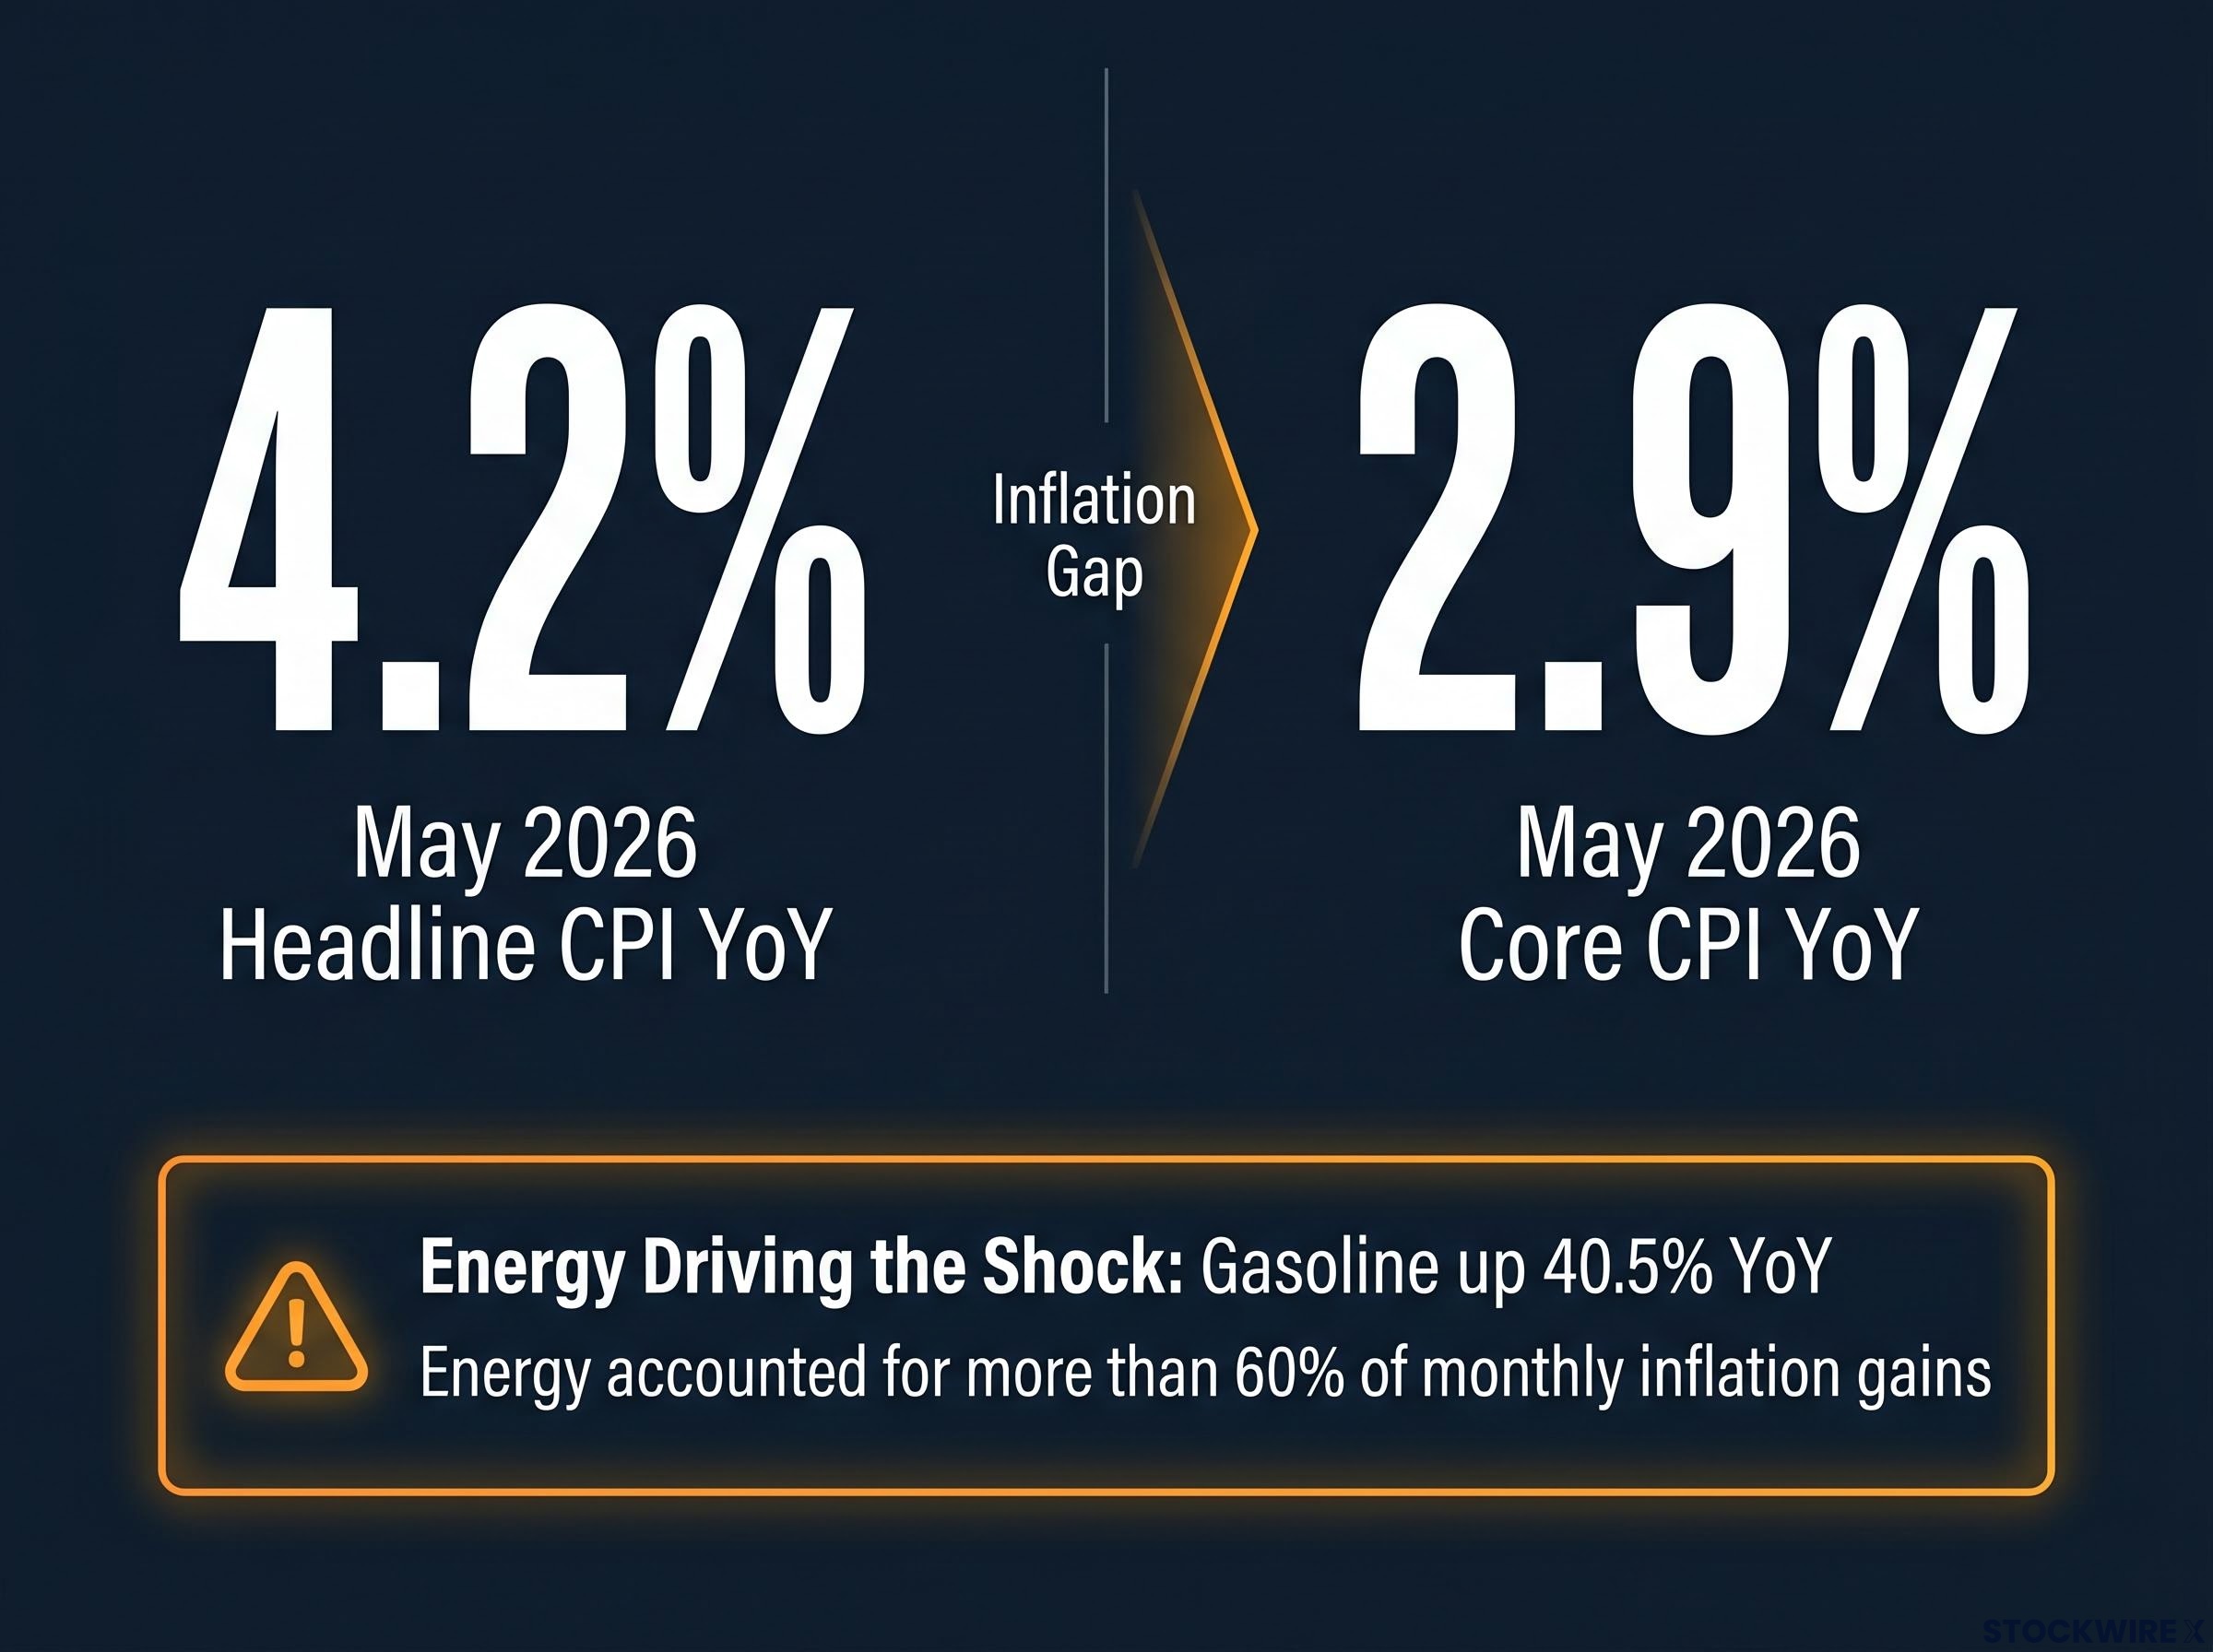
The gap between headline and core CPI is the report’s most important diagnostic signal. Headline CPI came in at 4.2%. Core CPI, which strips out food and energy, registered 2.9% year-over-year and just 0.2% month-over-month, slower than April’s 0.4% monthly pace. That is not a broad price surge. It is an energy shock with a specific geopolitical trigger.
The oil price and CPI transmission channels operate on different timescales: direct effects from gasoline prices hit headline CPI within weeks, while indirect effects flowing through logistics, agriculture, and manufacturing supply chains can take six to twelve months to appear in core measures.
US average gasoline prices peaked near $4.49 per gallon in mid-May before falling to approximately $4.16 subsequently, an early sign the worst of the spike may already be fading.
| Metric | May 2026 | April 2026 |
|---|---|---|
| Headline CPI (YoY) | 4.2% | 3.8% |
| Core CPI (YoY) | 2.9% | — |
| Gasoline (YoY) | 40.5% | — |
| Energy share of monthly gains | More than 60% | — |
A three-year-high CPI print sounds like it should rattle equities. It didn’t, and the reason is mechanical.
The 4.2% result aligned with analyst consensus projections. This was the third consecutive monthly acceleration in headline inflation, meaning the trend had been visible, discussed, and increasingly priced in for weeks before the number arrived on 11 June. When widely anticipated data are released, their market-moving power is largely spent in advance.
The equity market response to inflation data through 2026 has been shaped more by the gap between reported figures and prior consensus than by the absolute level of the CPI print, a pattern visible in April’s 3.8% reading and reinforced again by May’s outcome.
The University of Michigan’s one-year-ahead inflation expectations measure had already climbed to 4.8% in May 2026, reflecting the same energy-driven anxiety the CPI report confirmed. Markets were not learning something new; they were receiving confirmation of something they already expected.
Whether a data release genuinely moves markets depends on a short list of conditions:
None of those conditions pointed toward a shock reaction this week.
Sustained, broad inflation, the kind that erodes purchasing power across the entire economy, historically requires two conditions occurring together:
Neither condition is present in the current data. Money supply growth has been described as relatively contained. Core inflation at 2.9% against a headline of 4.2% confirms the price pressure is concentrated, not dispersed. The wedge between the two numbers is structural evidence that this is a supply shock, not a monetary-driven spiral.
Fisher Investments has noted that it does not anticipate a prolonged period of elevated broad inflation given these conditions. The 2022 energy shock following Russia’s military action in Ukraine offers a useful comparison: headline inflation surged on energy costs, alarmed investors and central banks alike, and then proved temporary once supply conditions shifted.
Higher fuel costs trigger behavioural shifts that act as a natural brake on inflation’s spread. Households reduce driving, cut discretionary spending, and adjust consumption patterns. That pullback limits the ability of firms in non-energy sectors to pass on higher costs, because consumer demand for their products softens in response.
This dynamic prevents a single volatile category from pulling all prices upward in tandem. It is well documented across past energy shocks and helps explain why core inflation can remain relatively contained even when gasoline prices are surging.
The ECB’s decision deserves to be understood on its own terms before its limitations are examined. On 12 June 2026, the central bank raised its key policy rate by 25 basis points to 2.25%, its first increase in approximately three years. The move had been broadly anticipated; minutes from the ECB’s April 2026 meeting showed several members had already considered a hike at that earlier session. Bond markets reacted in line with expectations.
The ECB framed the action as a reaffirmation of its commitment to returning inflation to its medium-term target. That framing is institutionally coherent. The question is whether the tool matches the problem.
What the rate hike affects:
What the rate hike does not affect:
Fisher Investments characterised the decision as potentially reflecting institutional memory of the 2022 episode rather than current money supply conditions warranting tightening. A 25 basis point hike does not reopen a shipping lane.
The 4.2% CPI print is not the primary medium-term concern. The policy response to it could be.
The bigger medium-term risk for investors is potential policy error, not this specific CPI print.
If central banks continue tightening in response to what is fundamentally a supply-side shock, they risk pushing short-term interest rates above long-term rates, inverting the yield curve. That configuration has historically preceded many economic slowdowns.
Yield curve dynamics in the current environment need to be read against the post-QE baseline rather than the suppressed rates of the 2010s: the decade of quantitative easing created an artificially low reference point that makes today’s yield levels look extreme when compared against recent memory but unremarkable against the pre-2008 historical record.
As of 12-13 June 2026, yield-curve inversion is not considered imminent. But the escalation path bears monitoring, particularly if additional rate increases follow without a corresponding shift in underlying inflation dynamics.
Three signals deserve investor attention in the coming months:
Both the CPI data and the ECB hike were widely anticipated. Acting on them now means reacting to already-priced-in information rather than to genuinely new signals.
The distinction that matters is between short-term noise (a single month’s headline CPI, a single telegraphed rate hike) and the longer-term variables that drive portfolio outcomes: growth, valuations, and multi-year policy direction. Stocks have historically continued performing across varying inflationary environments, and a single CPI report, even one at a three-year high, does not constitute a portfolio mandate.
Early evidence of easing gasoline prices (from $4.49 to $4.16) suggests June’s CPI reading could print softer, though that outcome is not guaranteed.
This article is for informational purposes only and should not be considered financial advice. Investors should conduct their own research and consult with financial professionals before making investment decisions.
Past performance does not guarantee future results. Financial projections are subject to market conditions and various risk factors.
The 4.2% headline and the ECB’s first hike in three years sound alarming together, but both developments point to the same underlying story: an energy shock driven by geopolitical disruption, not a new inflationary regime. Core inflation at 2.9%, energy driving more than 60% of monthly gains, money supply growth relatively contained, and both events arriving in line with market expectations all reinforce that reading.
The rational investor response is not dramatic repositioning. It is measured monitoring of the three signals that will determine whether this episode remains contained or evolves into something broader: the central-bank policy path, geopolitical developments around Iran and energy markets, and long-term inflation expectations. The data, not the headlines, should set the pace.
For investors who want to stress-test the conclusion that this episode will remain contained, our deep-dive into structural inflation regimes examines 150 years of inflation cycle data and identifies 13 simultaneous structural reversals that could make a return to 2% targets significantly harder than the supply-shock framing implies.
Core CPI measures inflation excluding volatile food and energy prices, giving a clearer picture of underlying price pressures. In May 2026, core CPI came in at 2.9% year-over-year, well within historically tolerated ranges, even as headline inflation hit 4.2%.
The spike was driven almost entirely by a 40.5% year-over-year surge in gasoline prices, caused by Iran's closure of the Strait of Hormuz which removed roughly one-fifth of global oil supply from the market since March 2026. Energy accounted for more than 60% of the monthly all-items increase.
The European Central Bank raised its key policy rate by 25 basis points to 2.25% on 12 June 2026, its first hike in approximately three years, framing the move as a reaffirmation of its commitment to returning inflation to its medium-term target. The decision had been broadly anticipated, with ECB April 2026 meeting minutes showing several members had already considered a hike at that earlier session.
Investors should track three key signals: the central bank policy path and whether further hikes respond to core inflation or headline energy noise; geopolitical developments around Iran and the Strait of Hormuz; and long-term inflation expectations over the five-to-ten-year horizon, which are distinct from short-term consumer sentiment readings.
Early evidence suggests it is possible, as average US gasoline prices fell from a peak of approximately $4.49 per gallon in mid-May to around $4.16 subsequently, indicating the worst of the energy spike may already be fading. However, the article notes this softer outcome is not guaranteed.