For roughly four decades, every investor alive operated inside a single macro environment: falling inflation and falling interest rates. That era ended in 2020. The question finance professionals are now grappling with is not whether it ended, but how long the replacement regime will last, and why the forces sustaining it appear resistant to the tools that worked before.
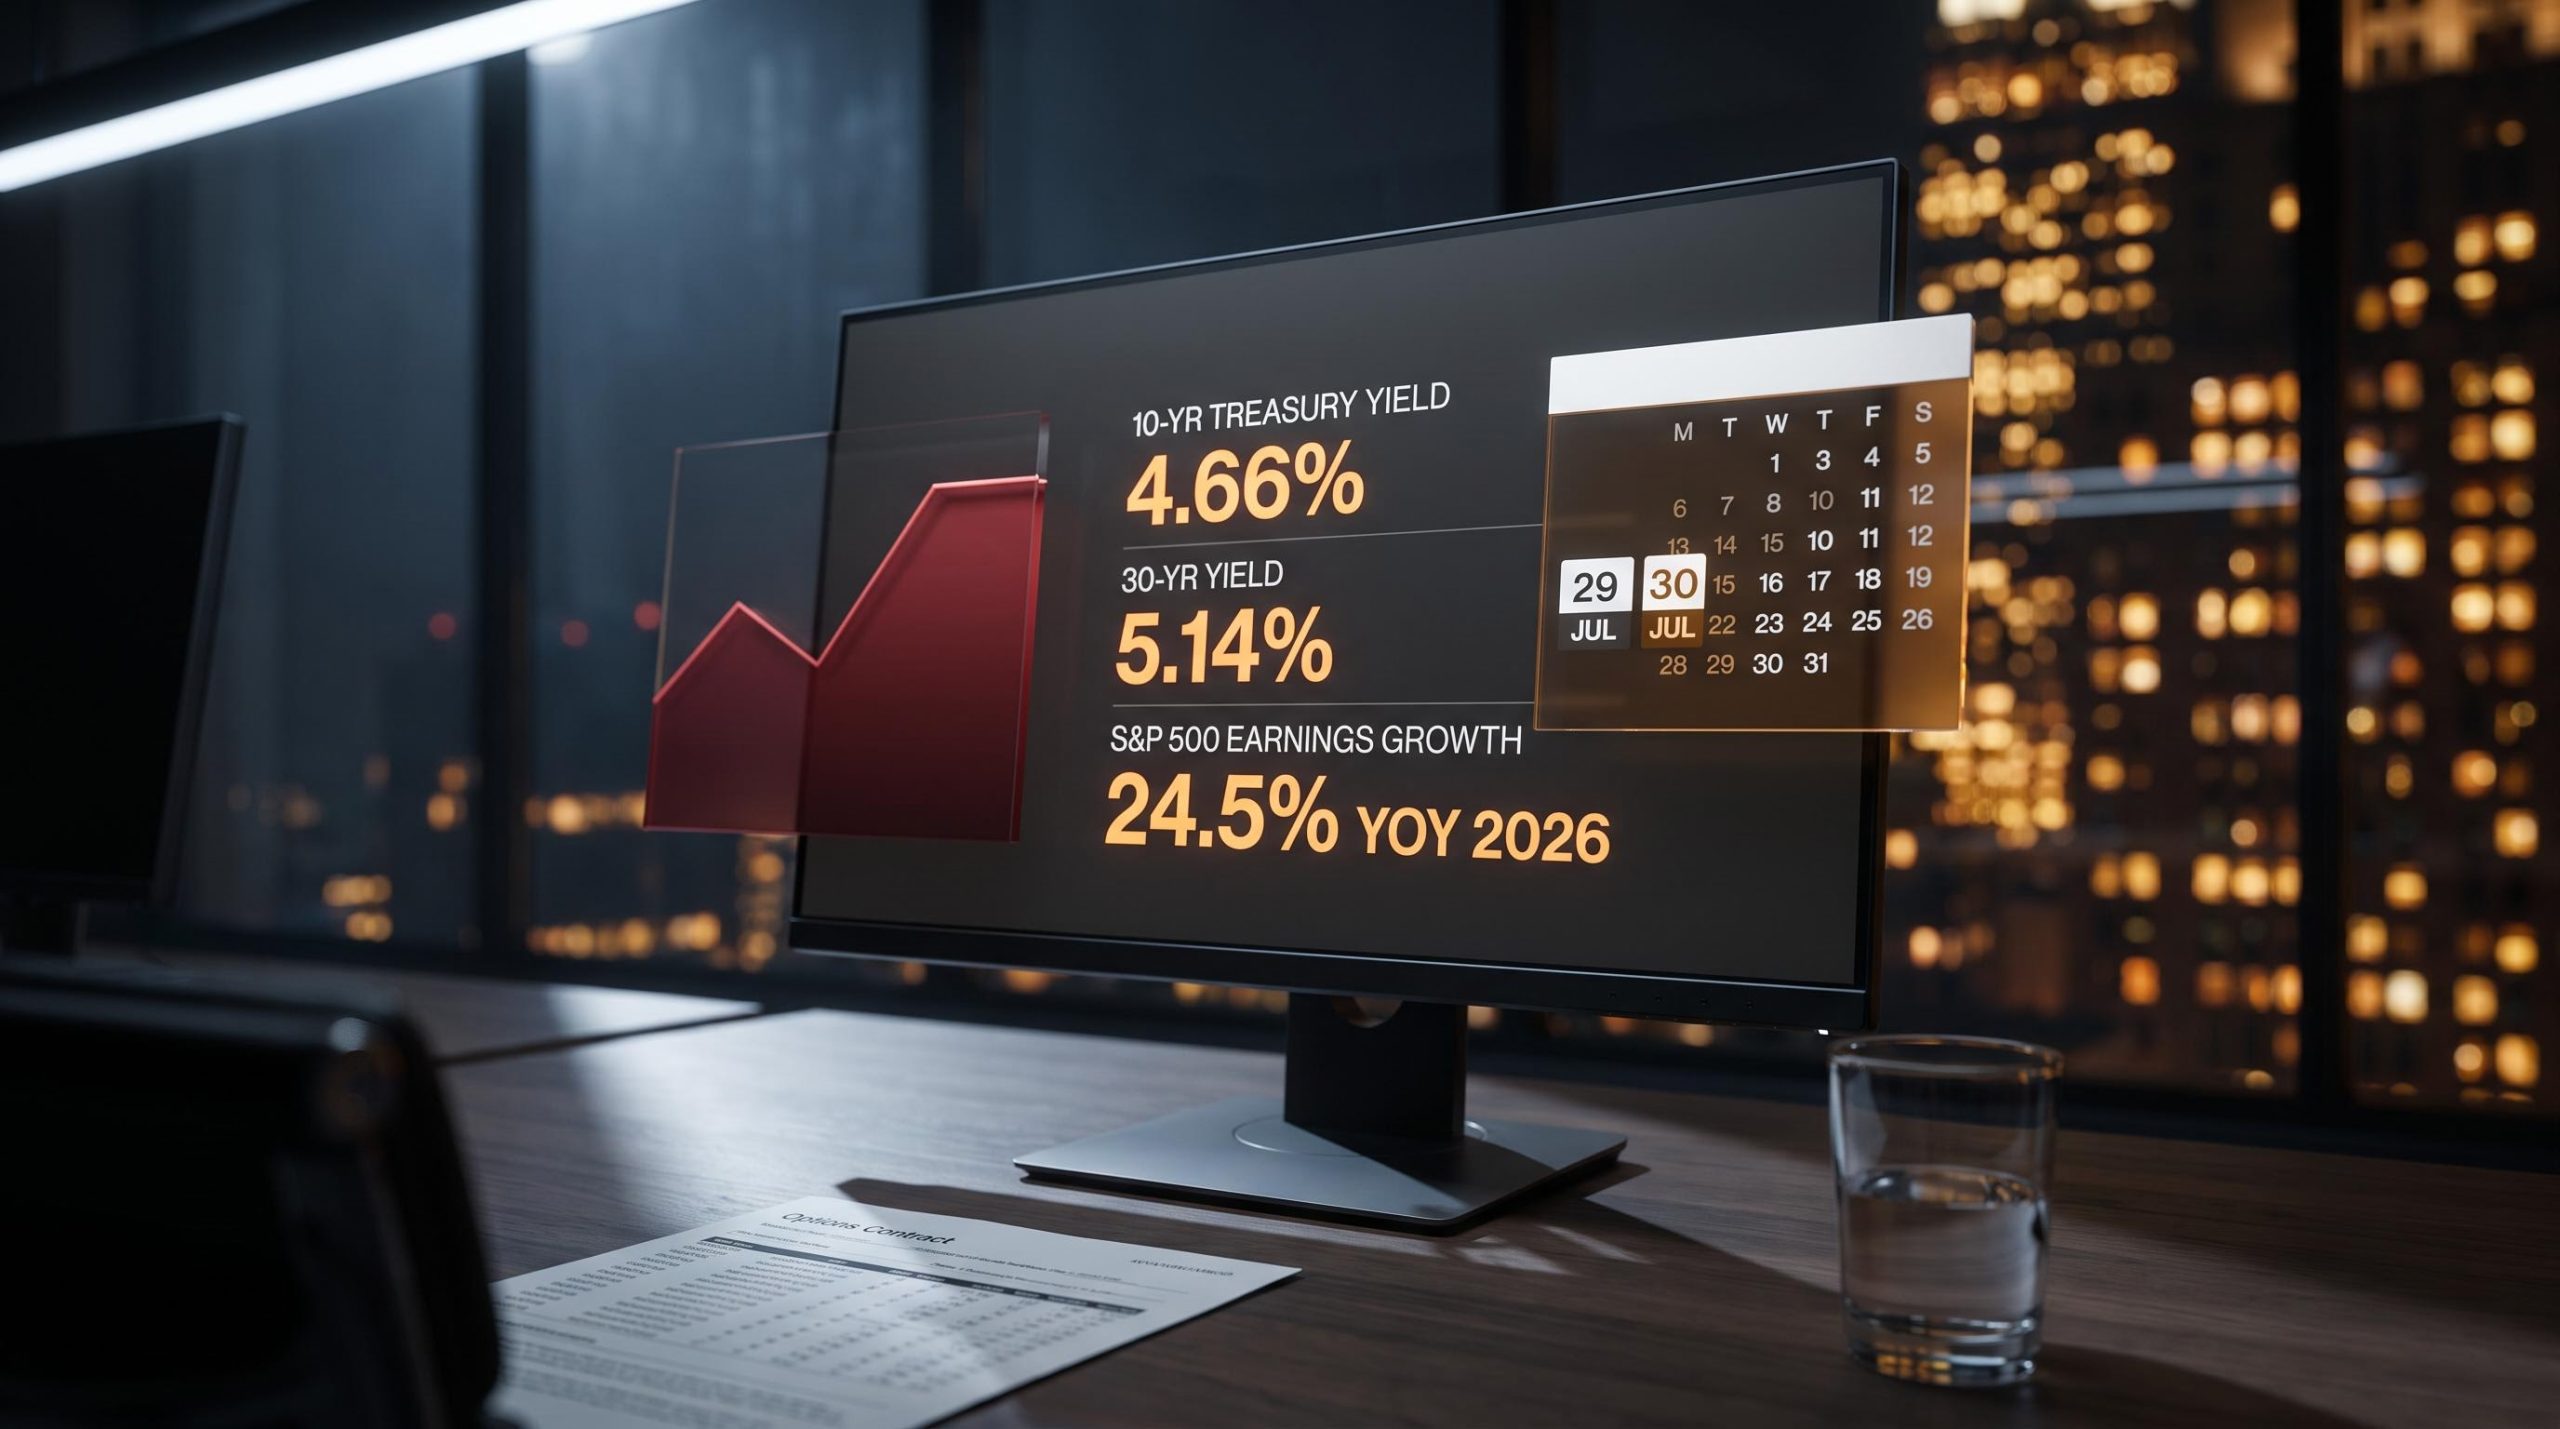
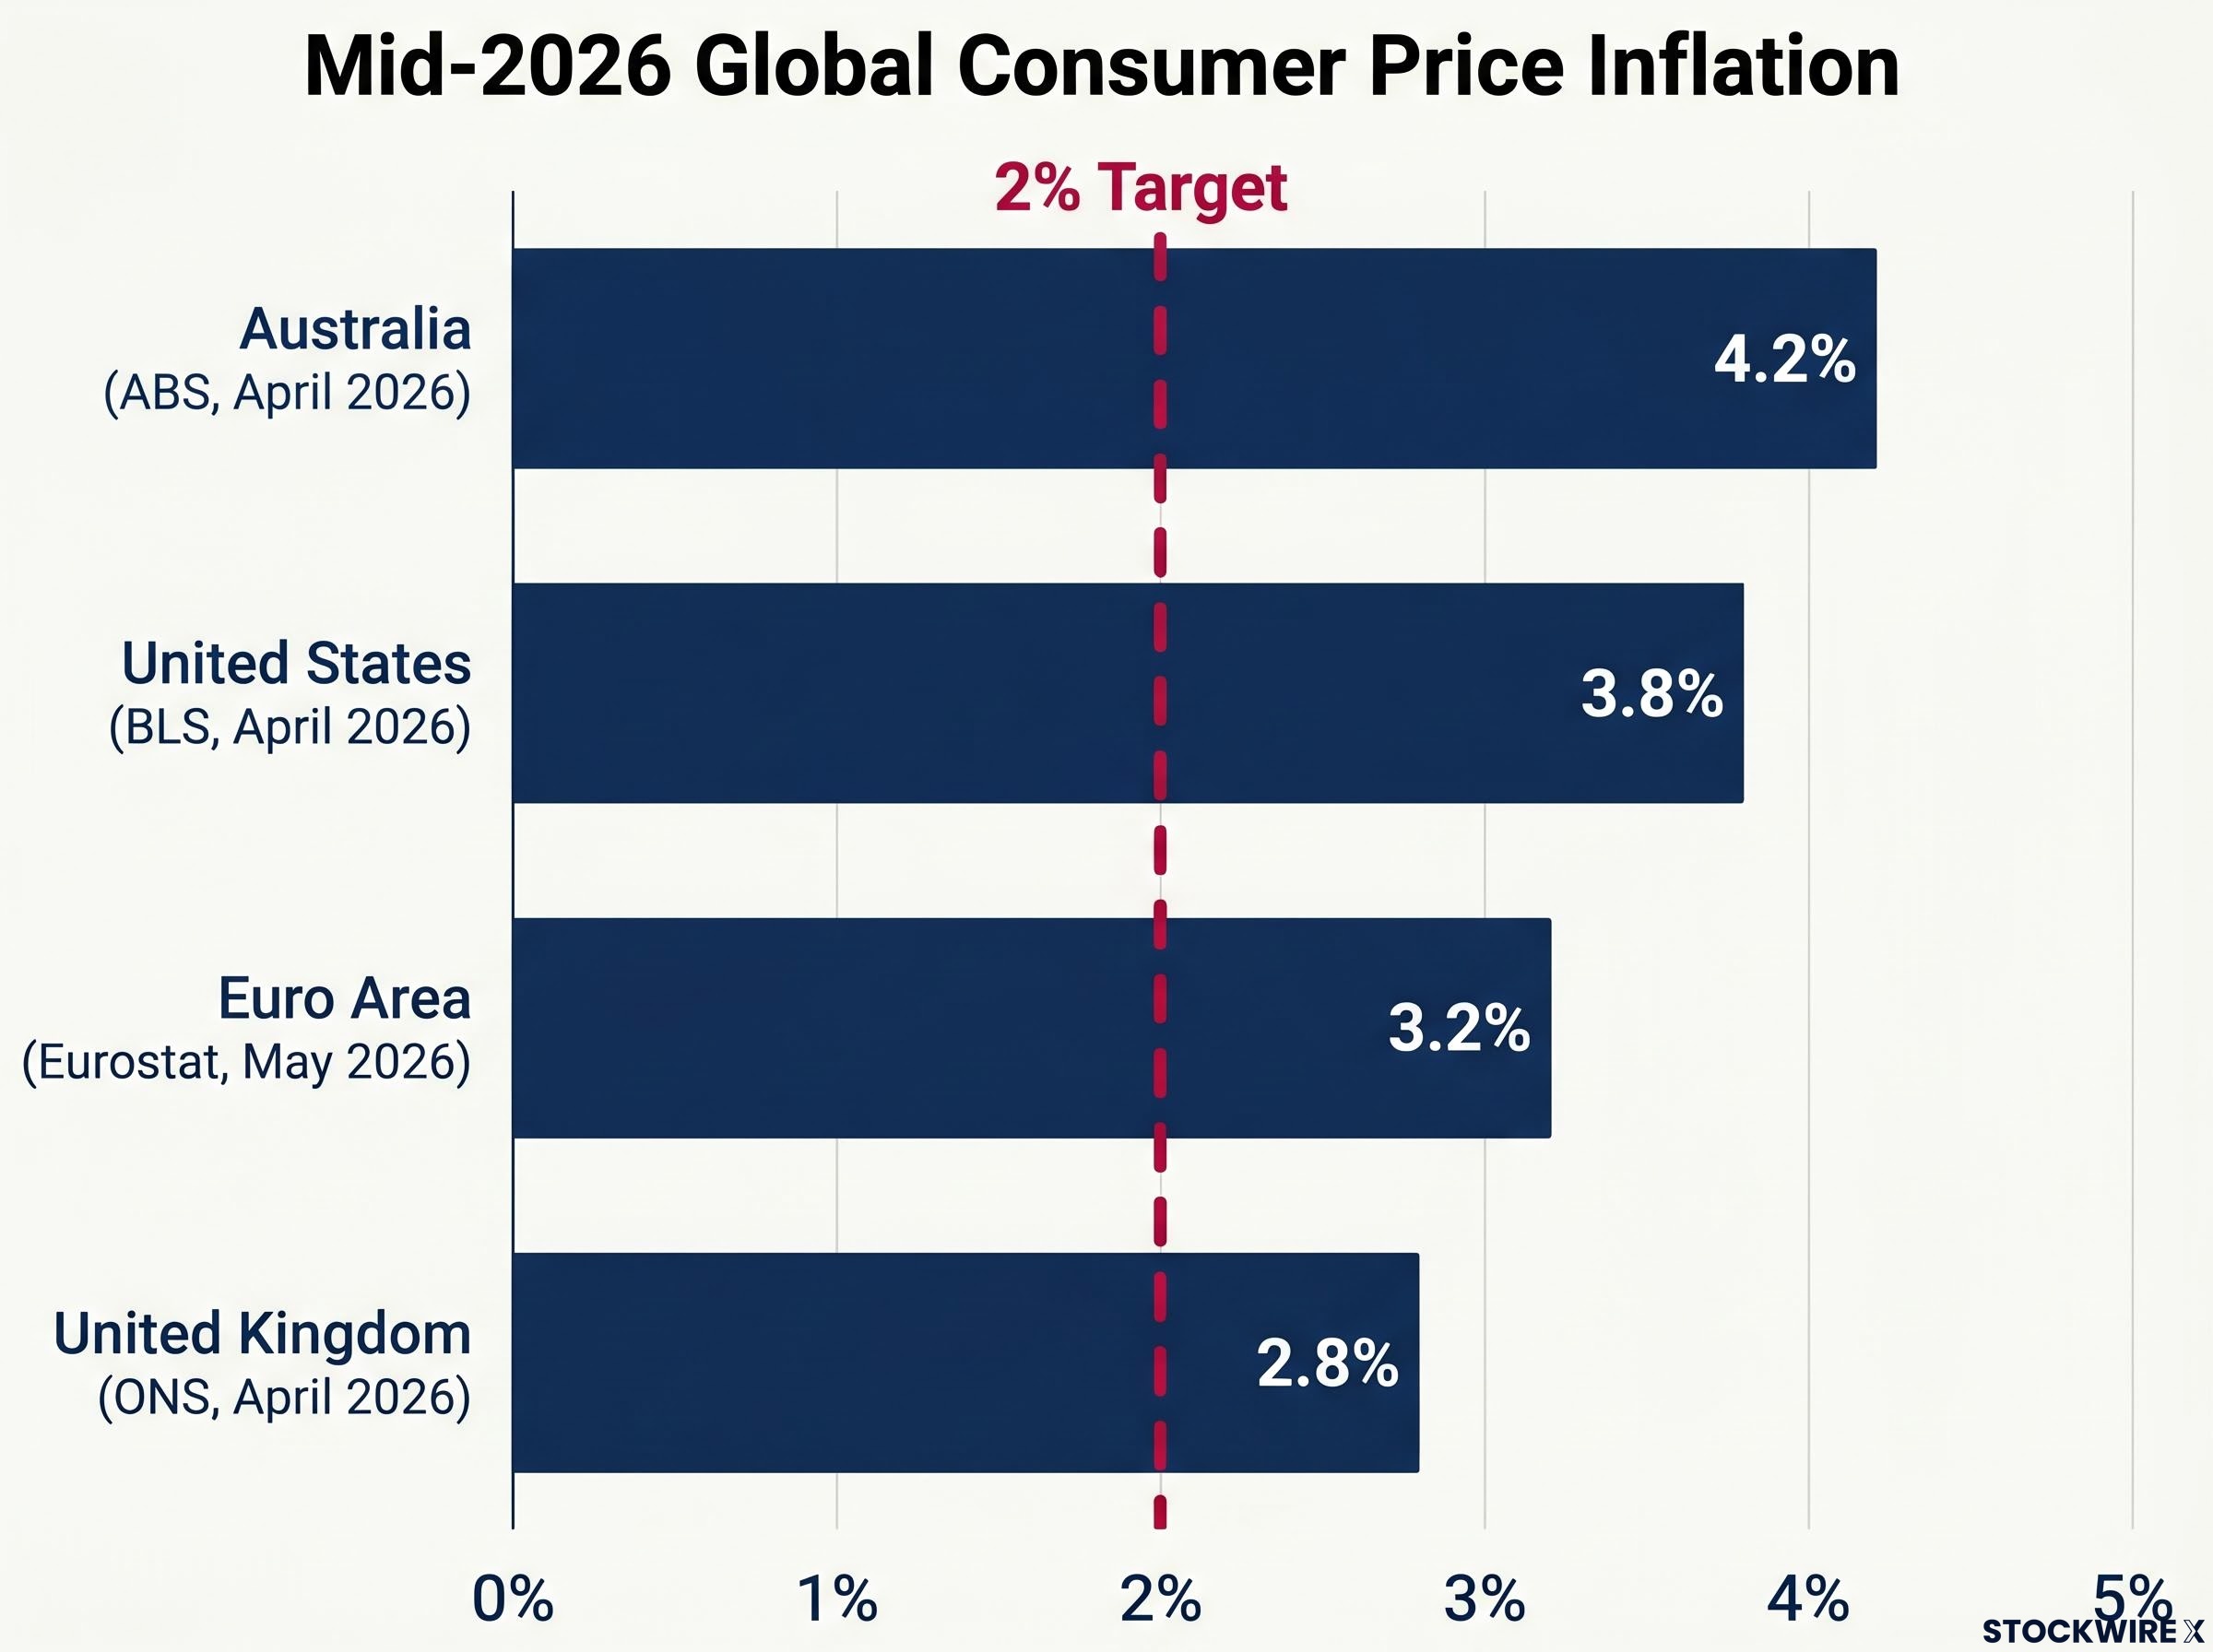
As of mid-2026, consumer price inflation is running at 3.8% in the United States, 4.2% in Australia, and 3.2% across the Euro area, well above pre-pandemic norms. Central banks have tightened aggressively, yet persistent inflation remains sticky. The explanation, this analysis argues, lies not in cyclical dynamics but in structural forces that are collectively and simultaneously reversing the conditions that produced four decades of disinflation. What follows is a historically grounded framework, drawing on 150 years of inflation cycle data, for understanding why elevated prices are likely to endure for years rather than months, and which specific structural reversals are doing the most damage to the disinflationary conditions investors previously relied upon.
How inflation actually behaves across history: cycles, not equilibria
The assumption embedded in most portfolio construction is that inflation reverts to a stable long-run average. The historical record does not support it.
Ashley Owen, CFA, of OwenAnalytics, published analysis on 8 June 2026 via Morningstar Australia examining 150 years of inflation data across Australia and major global economies using five-year rolling averages. The data reveals multi-decade directional regimes, not mean-reverting volatility around a stable equilibrium. Inflation moves in sustained waves, and each dominant monetary framework persists for roughly one generation before being replaced.
National inflation trajectories tend to move in parallel across economies, reflecting globalised capital markets and the cross-border spread of dominant monetary theories. Local deviations exist (Germany’s early-1920s hyperinflation, Japan’s late-1940s episode), but these diverge from rather than define the global pattern. The three major episodes of elevated inflation over the past 150 years share a common catalyst:
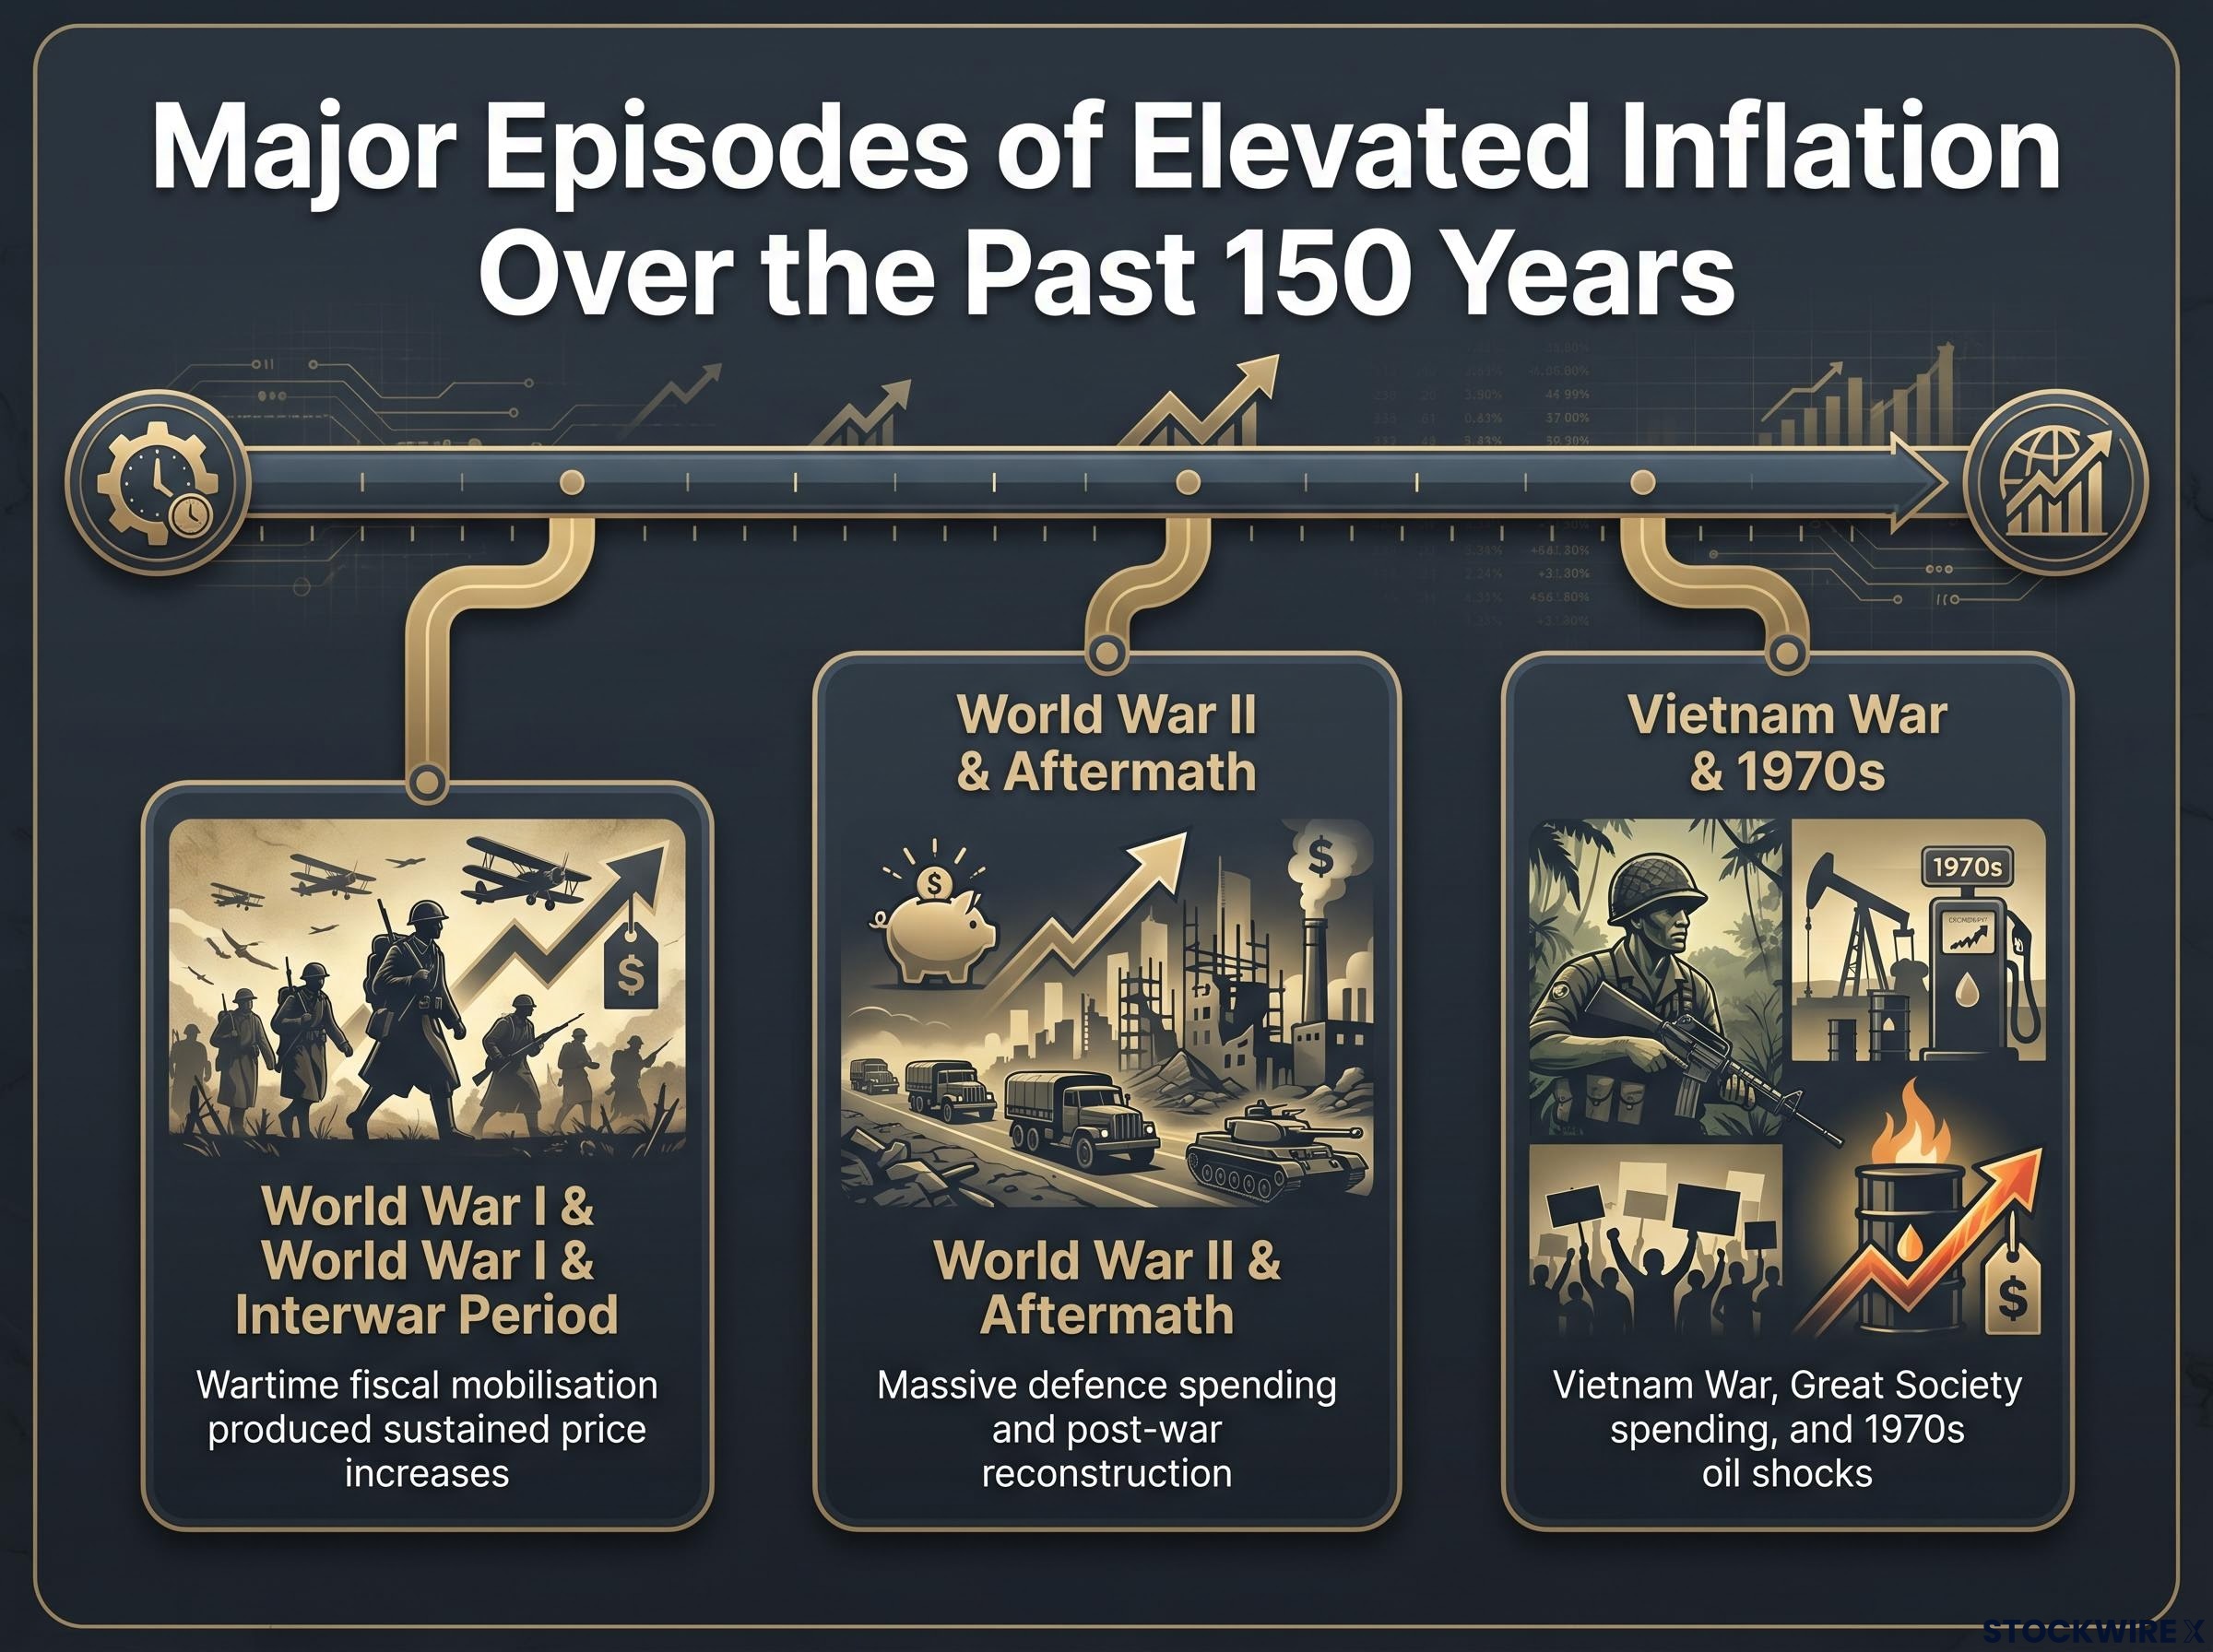
- World War I and the interwar period: wartime fiscal mobilisation produced sustained price increases across combatant economies
- World War II and its aftermath: massive defence spending and post-war reconstruction drove a multi-decade inflationary environment
- The Vietnam War, Great Society spending, and the 1970s oil shocks: fiscal-monetary interaction sustained inflation for more than a decade
Inflation follows sustained directional regimes lasting roughly a generation, not mean-reverting cycles. Each monetary framework persists until it is discarded and replaced by an alternative approach.
Investors who expect inflation to “normalise” back to 2% are working from a theoretical framework the historical record does not validate.
The mechanism by which inflation erodes purchasing power operates differently across asset classes, with fixed-income instruments and cash savings bearing the most direct losses while real assets and equities provide partial but uneven protection depending on the inflationary context.
When big ASX news breaks, our subscribers know first
What actually caused four decades of falling prices
The disinflation that began in the early 1980s was not a natural equilibrium. It was a deliberate, policy-driven outcome, achieved through considerable economic pain.
In the United States and United Kingdom, the transition to lower inflation was forced through recessions in the early 1980s. Australia addressed its inflation problem approximately a decade later during the 1990-91 recession. According to Owen’s analysis, the disinflation cycle that followed the high-inflation period of the late 1960s through late 1970s emerged from specific structural conditions aligned simultaneously across trade, labour, fiscal, and monetary dimensions. None of it was accidental.
The disinflationary structural stack
Each of the following forces represented a one-time gain. Once realised, it could not be repeated, and each was always vulnerable to reversal:
- Free trade regimes and low tariffs suppressed input costs across borders
- Offshoring to low-cost labour markets compressed manufacturing wages globally
- Comparative advantage specialisation maximised productive efficiency
- Just-in-time supply chains minimised inventory costs and waste
- Post-Cold War military spending reductions freed fiscal capacity (the “peace dividend”)
- Central bank independence insulated monetary policy from political pressure
- Labour and financial market deregulation increased flexibility and competition
Understanding these structural origins clarifies something important: the reversal of disinflation is not a policy failure or a temporary shock. It is the logical consequence of dismantling, one by one, the conditions that produced it.
Thirteen Structural Shifts Driving Persistent Inflation
No single structural reversal explains the current inflationary environment. What makes this regime durable is the breadth and simultaneity of the unwinding: every major structural factor that contributed to falling inflation has not only ceased but actively reversed direction.
Energy supply volatility represents one of the more difficult structural reversals to quantify because it combines geopolitical risk premiums with genuine physical supply constraints, and the IEA’s characterisation of Middle East tension as a persistent structural upside risk rather than a transient spike aligns closely with the regime-based framework Owen applies to inflation more broadly.
Owen’s 2026 analysis identifies 13 structural reversals now operating in the same direction at the same time. The Covid-era fiscal stimulus of 2020-21 acted as the catalyst that activated the transition from one regime to the other, not as the cause of a temporary spike. Observable data supports the scale of the shift. According to SIPRI’s Trends in World Military Expenditure, 2025 (published April 2026), world military expenditure reached $2,887 billion in 2025, the 11th consecutive annual rise, representing 2.5% of world GDP. US manufacturing construction spending approximately doubled the 2019 level in real terms by 2024-2025, according to the Federal Reserve Bank of Dallas. The Reshoring Initiative reported approximately 190,000 reshoring and FDI job announcements in the US in 2024 alone. The European Commission’s Net-Zero Industry Act and Chips Act have channelled tens of billions of euros into semiconductor, battery, and clean-tech manufacturing since 2023.
| Disinflationary Force (1980-2020) | Current Reversal (2020-present) |
|---|---|
| Stable, low-tariff free trade regimes | Volatile, unpredictable trade disputes |
| Offshoring to low-cost labour | Reshoring and nearshoring at higher cost |
| Comparative advantage specialisation | National self-sufficiency objectives |
| Integrated globalisation | Geopolitically aligned trade blocs |
| Lean just-in-time supply chains | Larger inventory buffers and higher working capital |
| Post-Cold War military spending cuts | Broad-based defence spending increases |
| Independent central banks | Growing political pressure on monetary policy |
| Labour and financial deregulation | Re-regulation and rising compliance costs |
| Cheap fossil fuel energy | Capital-intensive renewable transition |
| Stable Middle Eastern oil supply | Volatile, unreliable energy supply |
| Balanced budget norms | Persistent deficits and expanding public debt |
| Market-driven restructuring | Government intervention to prevent failures |
| Limited industrial subsidies | Expanded welfare and politically directed subsidies |
Every major structural factor that contributed to falling inflation has not only ceased but actively reversed direction. The simultaneity of the reversal is what makes this regime durable rather than transient.
Understanding inflation regimes: why this one is different from a temporary price spike
Headline CPI can fall for several consecutive months and still leave the underlying regime intact. The distinction between a cyclical inflation spike and a structural inflation regime is one of mechanism, not duration.
An inflation regime is a sustained period during which structural forces, institutional settings, and dominant economic frameworks collectively anchor inflation at a higher (or lower) level than the preceding period. Cyclical inflation spikes, by contrast, are driven by temporary demand or supply imbalances that self-correct as monetary policy tightens or the bottleneck clears. The current environment shares its mechanism with historical precedents that lasted decades, not quarters.
The historical link between large fiscal mobilisation and multi-decade inflation persistence follows a consistent three-stage pattern:
- Large-scale fiscal mobilisation (war, reconstruction, or equivalent) generates massive public debt
- Debt accumulation constrains the political appetite for aggressive monetary tightening
- Financial repression becomes the debt-management response: governments use interest-rate caps, captive domestic savings, and regulation to keep nominal yields low while moderately elevated inflation erodes the real value of debt over time
IMF and BIS research on the post-WWII era documents this pattern in detail. Korean War and 1950s Cold War defence spending sustained aggregate demand through military Keynesianism, setting the stage for the 1960s demand pressures. Vietnam War expenditure, Great Society programmes, and accommodative Federal Reserve policy then produced the multi-year high-inflation regime that ended only with the Volcker disinflation.
Agustín Carstens, General Manager of the BIS, has warned of “structural forces that may keep inflation more volatile and above pre-pandemic levels,” citing geopolitical fragmentation, large fiscal deficits, and the green transition as factors limiting central banks’ capacity to respond.
The BIS Annual Report 2024/25 identifies uncertainty over the configuration of the global trade system as a primary risk to the inflation outlook, with the report’s economic analysis explicitly addressing how evolving inflation dynamics interact with financial stability across major economies.
The mechanism, not the monthly print, is the signal investors should be reading.
The AI deflation counterargument and why the structural view holds
The strongest intellectual challenge to the structural inflation thesis comes from artificial intelligence. It deserves to be taken seriously before its limitations are examined.
Economists and strategists at Goldman Sachs, ARK Invest, and institutions including the IMF and OECD argue that generative AI represents a powerful disinflationary force. The channels are well defined: a productivity surge in services and knowledge work, automation of cognitive tasks affecting a large share of advanced-economy employment, increased competition through lower entry barriers, and a historical parallel to the 1990s IT productivity boom that coincided with sustained low inflation. Some analysts contend that near-zero labour costs enabled by automation could drive consumer price inflation toward zero.
Why the 1990s analogy may not hold
The counterarguments are specific and, in the near-to-medium term, more compelling.
| AI-Deflation Argument | Structural Inflation Rebuttal |
|---|---|
| Productivity surge lowers unit costs | Diffusion lags: the 1990s IT boom took most of a decade to appear in aggregate productivity data |
| Automation reduces labour demand and wages | Job displacement triggers political pressure for redistribution, expanding fiscal outlays |
| Competition and price transparency increase | AI capex raises demand for energy, data centres, and infrastructure, which is itself inflationary |
| Historical IT-boom parallel supports deflation | The 1990s boom operated while structural disinflationary forces were accumulating; those forces are now reversing |
BIS research emphasises a point often overlooked: relative price changes from AI do not necessarily translate into lower aggregate inflation if monetary policy maintains nominal spending growth. If central banks target 2% inflation, AI’s gains are more likely to appear as higher real growth than as a permanently lower price level. BlackRock’s 2024 “New Regime” update reinforces this framing, stating that inflation shocks will be more frequent and central banks will tolerate somewhat higher average inflation due to constraints from debt and growth objectives.
BCA Research’s Peter Berezin makes a pointed case for AI’s near-term inflationary pressure, arguing that surging electricity and semiconductor costs from AI infrastructure buildout are already lifting input prices across the economy, which directly complicates the productivity-driven deflation scenario that Goldman Sachs and ARK Invest project.
The IMF’s chief economist Pierre-Olivier Gourinchas noted in the April 2026 World Economic Outlook that core inflation remains sticky, and that geoeconomic fragmentation, ageing populations, climate policies, and defence spending can push up the natural rate of interest. Owen personally aligns with the higher-inflation outlook rather than the AI-driven deflation scenario. The AI thesis and the structural inflation thesis operate on different timescales; structural forces appear dominant across the 5-10 year window that matters for current investment decisions.
Long-Term Investor Implications of Sustained Inflation
If the historical cycle-length evidence holds, the current inflationary regime is likely to persist for approximately two decades, consistent with the typical generational span of dominant monetary frameworks before they are discarded and replaced.
Owen’s analysis projects a new inflationary regime lasting roughly two decades, consistent with the generational pattern observed across 150 years of data. The implication is that investors planning for a 2-3 year inflation episode followed by a return to pre-pandemic conditions are systematically mispricing a multi-decade structural shift.
History offers two exit paths from inflationary regimes, and neither is painless:
- The Volcker model: a severe, politically accepted recession that crushes demand and resets expectations, as occurred in the early 1980s
- Multi-decade financial repression: sustained negative real interest rates that gradually erode debt burdens while inflation remains moderately above target, as occurred in the post-WWII period
Given current debt levels and political constraints across major economies, the financial repression path appears more likely. The political appetite for a Volcker-style recession has diminished in an era of elevated public debt and populist politics.
For investors wanting to trace the specific transmission mechanism from government deficit spending to asset price gains, our dedicated guide to fiscal deficits and asset price inflation examines how four consecutive crisis episodes from 2008 through 2026 produced rising equity, property, and gold valuations regardless of whether rates were cut or raised, and what that pattern implies for portfolio positioning in the current regime.
Where does expert opinion sit? The disagreement is genuine and unresolved:
- Structural camp (BIS, IMF, BlackRock, Larry Summers, Olivier Blanchard): structural forces including deglobalisation, fiscal deficits, defence spending, and the green transition will sustain higher and more volatile inflation for an extended period
- Cyclical camp (Federal Reserve, ECB, academic Phillips-curve modellers): supply-chain normalisation, fading energy shocks, and restrictive monetary policy are bringing inflation toward 2%; long-run expectations remain anchored
Current CPI readings sit uncomfortably between the two views. The US reported 3.8% (BLS, April 2026), Australia 4.2% (ABS, April 2026 monthly), the Euro area 3.2% (Eurostat, May 2026 flash estimate), and the UK 2.8% (ONS, April 2026). Summers and Blanchard argue that very large fiscal stimulus, tight labour markets, and structural constraints have created conditions for persistent inflation pressures even after initial pandemic distortions ease.
Regime recognition is the first step: where that leaves long-term investors
The structural conditions that produced four decades of disinflation have reversed comprehensively and simultaneously, activating a new inflationary regime that historical evidence suggests will persist for roughly two decades. All 13 disinflationary forces identified in the post-1980s era have not only ceased but turned in the opposite direction, operating concurrently for the first time.
Genuine uncertainty remains. The AI deflation thesis represents a real supply-side force whose long-term magnitude is unknown. The disagreement between central banks and structuralists has not been empirically resolved, and intellectual honesty about that gap is itself part of a sound analytical framework.
Recognising that the macro regime has changed is the prerequisite for recalibrating asset allocation, duration exposure, and real return expectations. The monthly CPI print will fluctuate. The structural forces underpinning it will not reverse quickly.
This article is for informational purposes only and should not be considered financial advice. Investors should conduct their own research and consult with financial professionals before making investment decisions. Past performance does not guarantee future results. Financial projections are subject to market conditions and various risk factors.
—