Adobe Posts Record Revenue, Drops 5% on Second Executive Exit
4 hrs ago

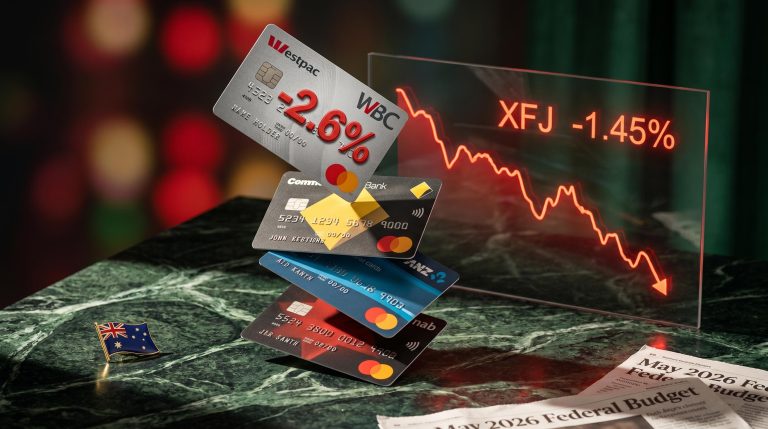
UBS strategists have cut gold price forecasts by up to $900 per ounce, citing a Federal Reserve rate-cutting cycle now pushed to 2027 and stronger-than-expected US economic data. The revision, attributed to UBS strategists Dominic Schnider, Giovanni Staunovo, and Wayne Gordon in a research note dated 12 June 2026 and reported via Investing.com, arrives as gold navigates competing forces: near-term pressure from elevated real yields and a resilient US economy on one side, and durable structural tailwinds from central bank buying and long-run dollar weakness on the other. The note introduces a near-term drift zone of $3,850 to $4,000 per ounce, a level the bank frames as a potential accumulation opportunity rather than a reason to exit. What follows breaks down the magnitude and reasoning behind the UBS cuts, identifies the price zone the bank is watching, and explains why UBS still sees gold as a buy-on-dips over the next 12 months.
The numbers are large enough to warrant a second look. UBS strategists Schnider, Staunovo, and Gordon reduced gold price forecasts by between $300 and $900 per ounce across multiple time horizons in their 12 June 2026 research note, reported via Investing.com.
Forecast revision range: $300 to $900 per ounce, depending on the horizon referenced in the 12 June note.
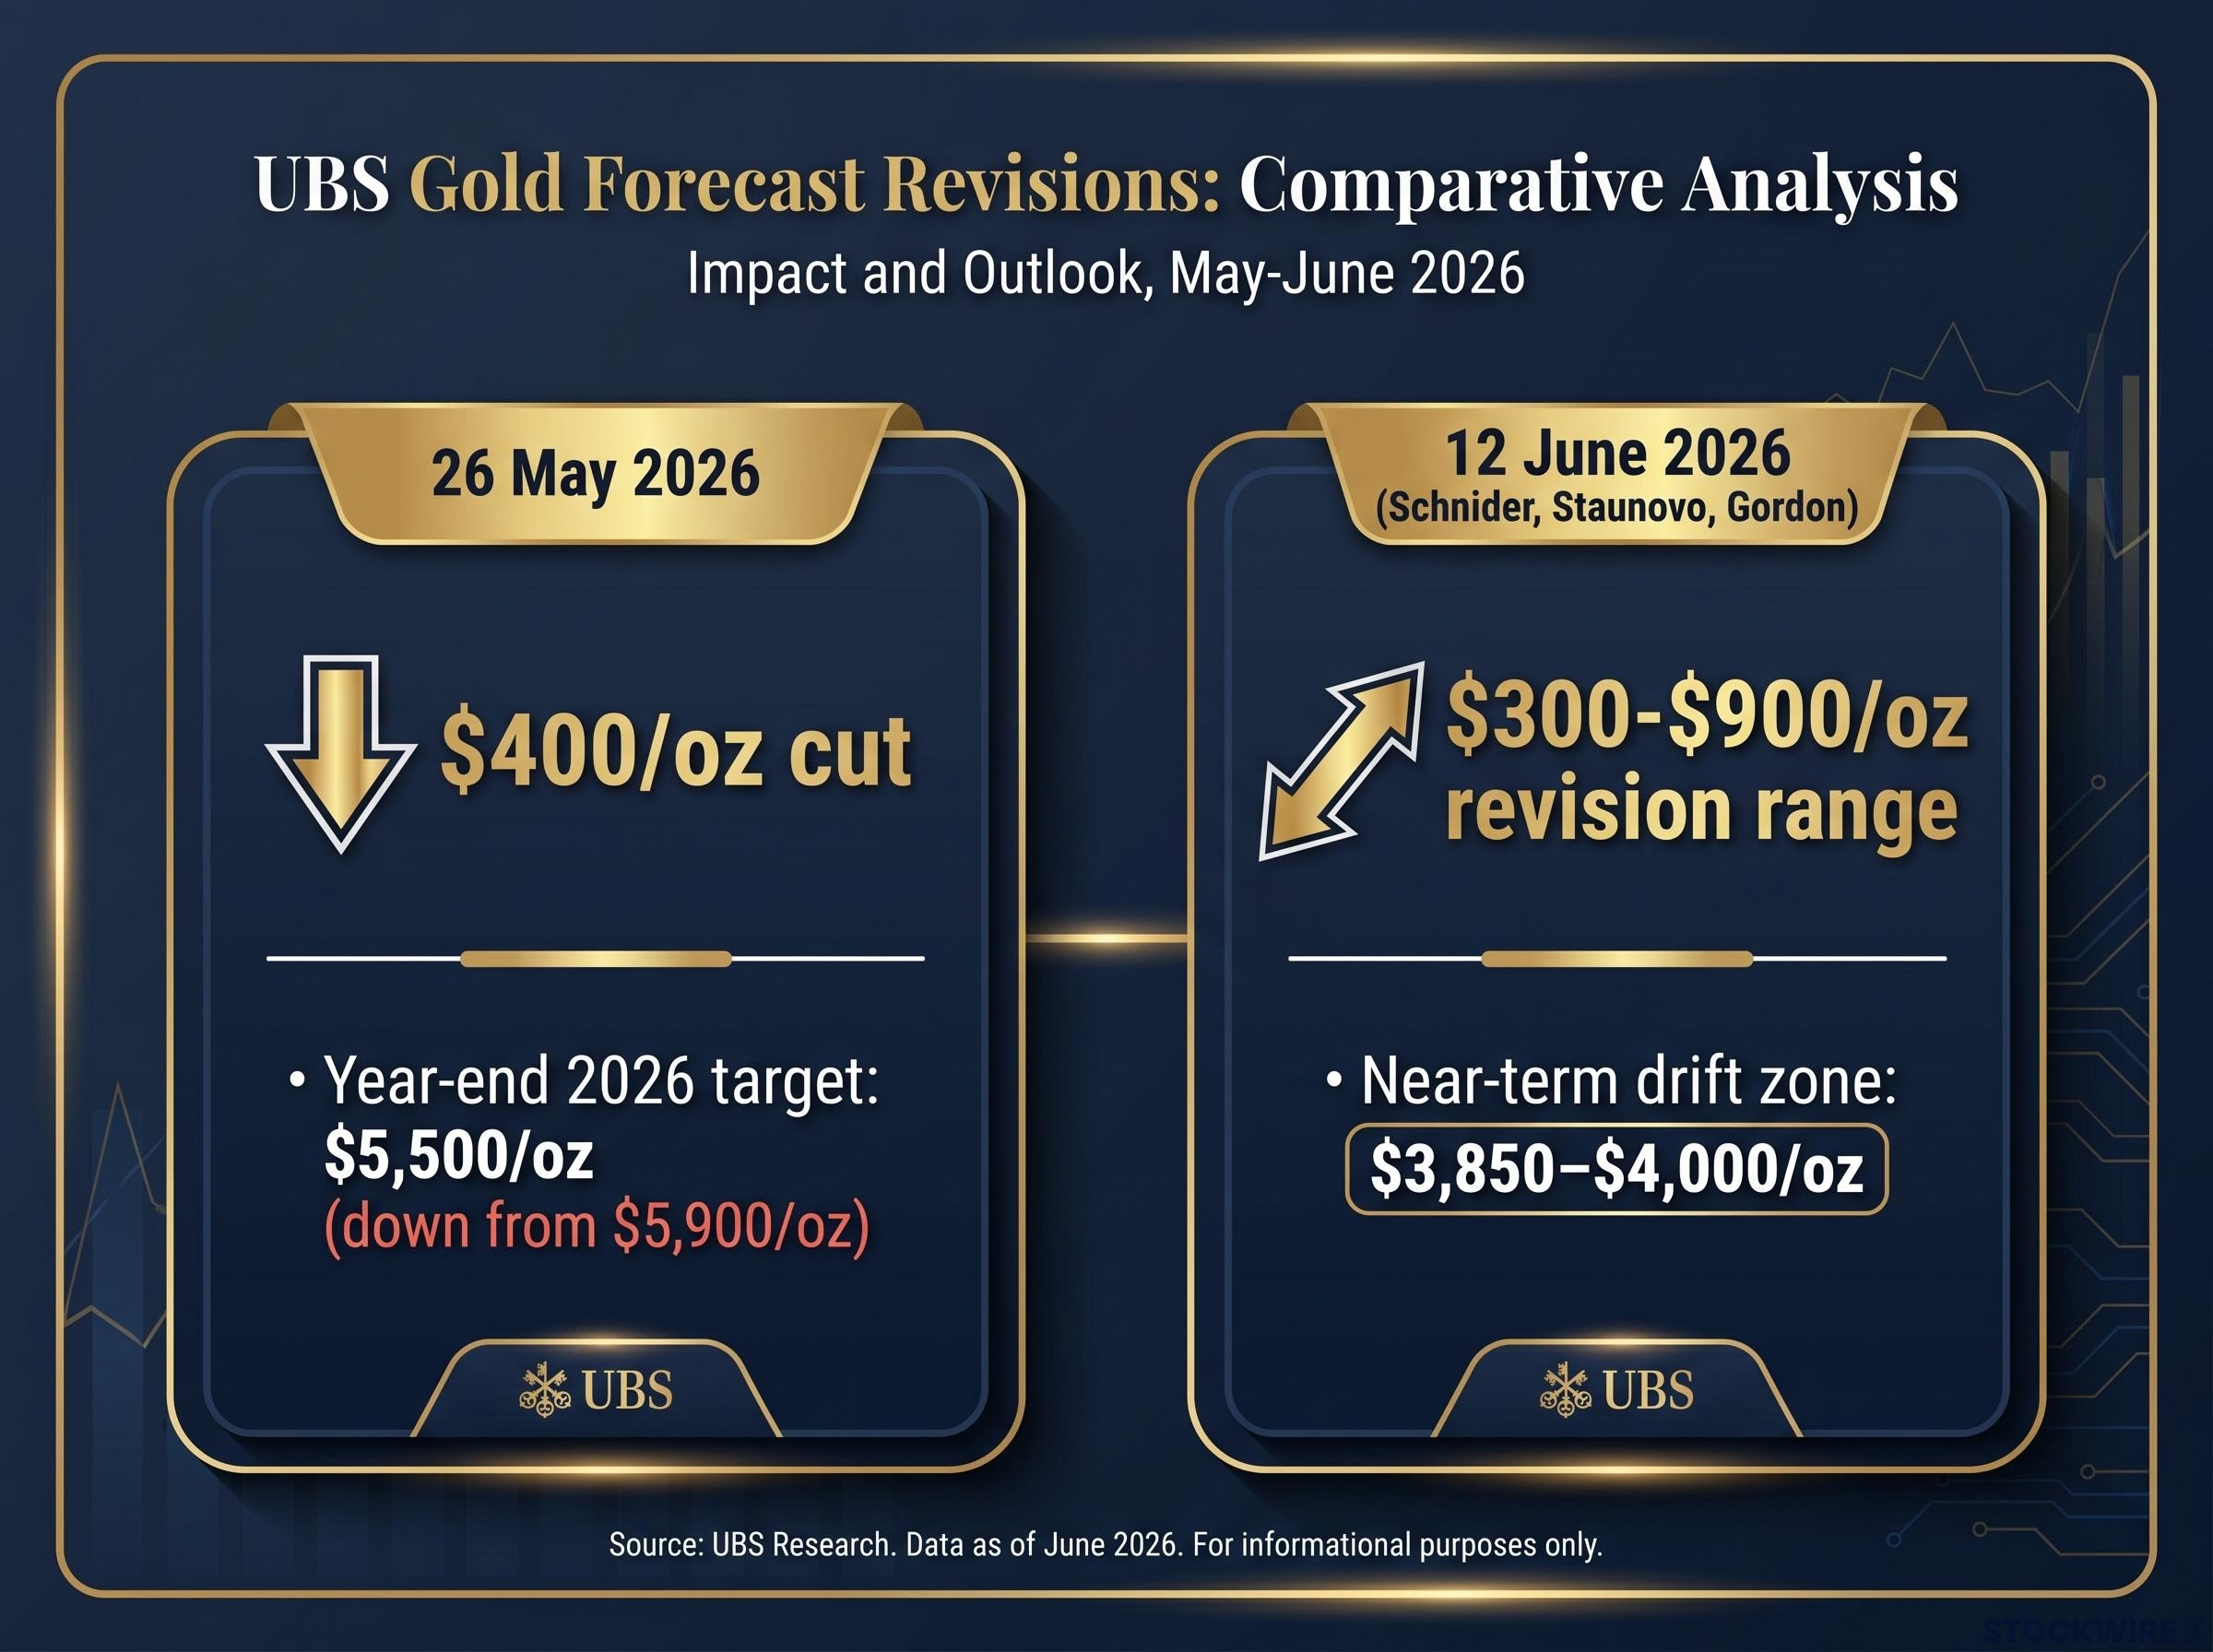
This is not the first downward adjustment from UBS in recent weeks. On 26 May 2026, the bank publicly cut its year-end 2026 target from $5,900 to $5,500 per ounce, a $400 reduction that still implied roughly 22% upside from the approximate $4,496 spot price at the time. The June 12 note goes further, introducing a near-term technical drift zone of $3,850 to $4,000 per ounce, a band absent from publicly indexed coverage and specific to this later research note.
| Note Date | Revision Amount | Key Output |
|---|---|---|
| 26 May 2026 (public) | $400/oz cut | Year-end 2026 target lowered to $5,500/oz |
| 12 June 2026 (Schnider, Staunovo, Gordon) | $300-$900/oz range | Near-term drift zone of $3,850-$4,000/oz |
The scale of a potential $900 per ounce revision is large enough to materially affect positioning decisions for investors holding gold ETFs, futures, or physical gold. Understanding which note introduced which numbers prevents misreading the cumulative signal.
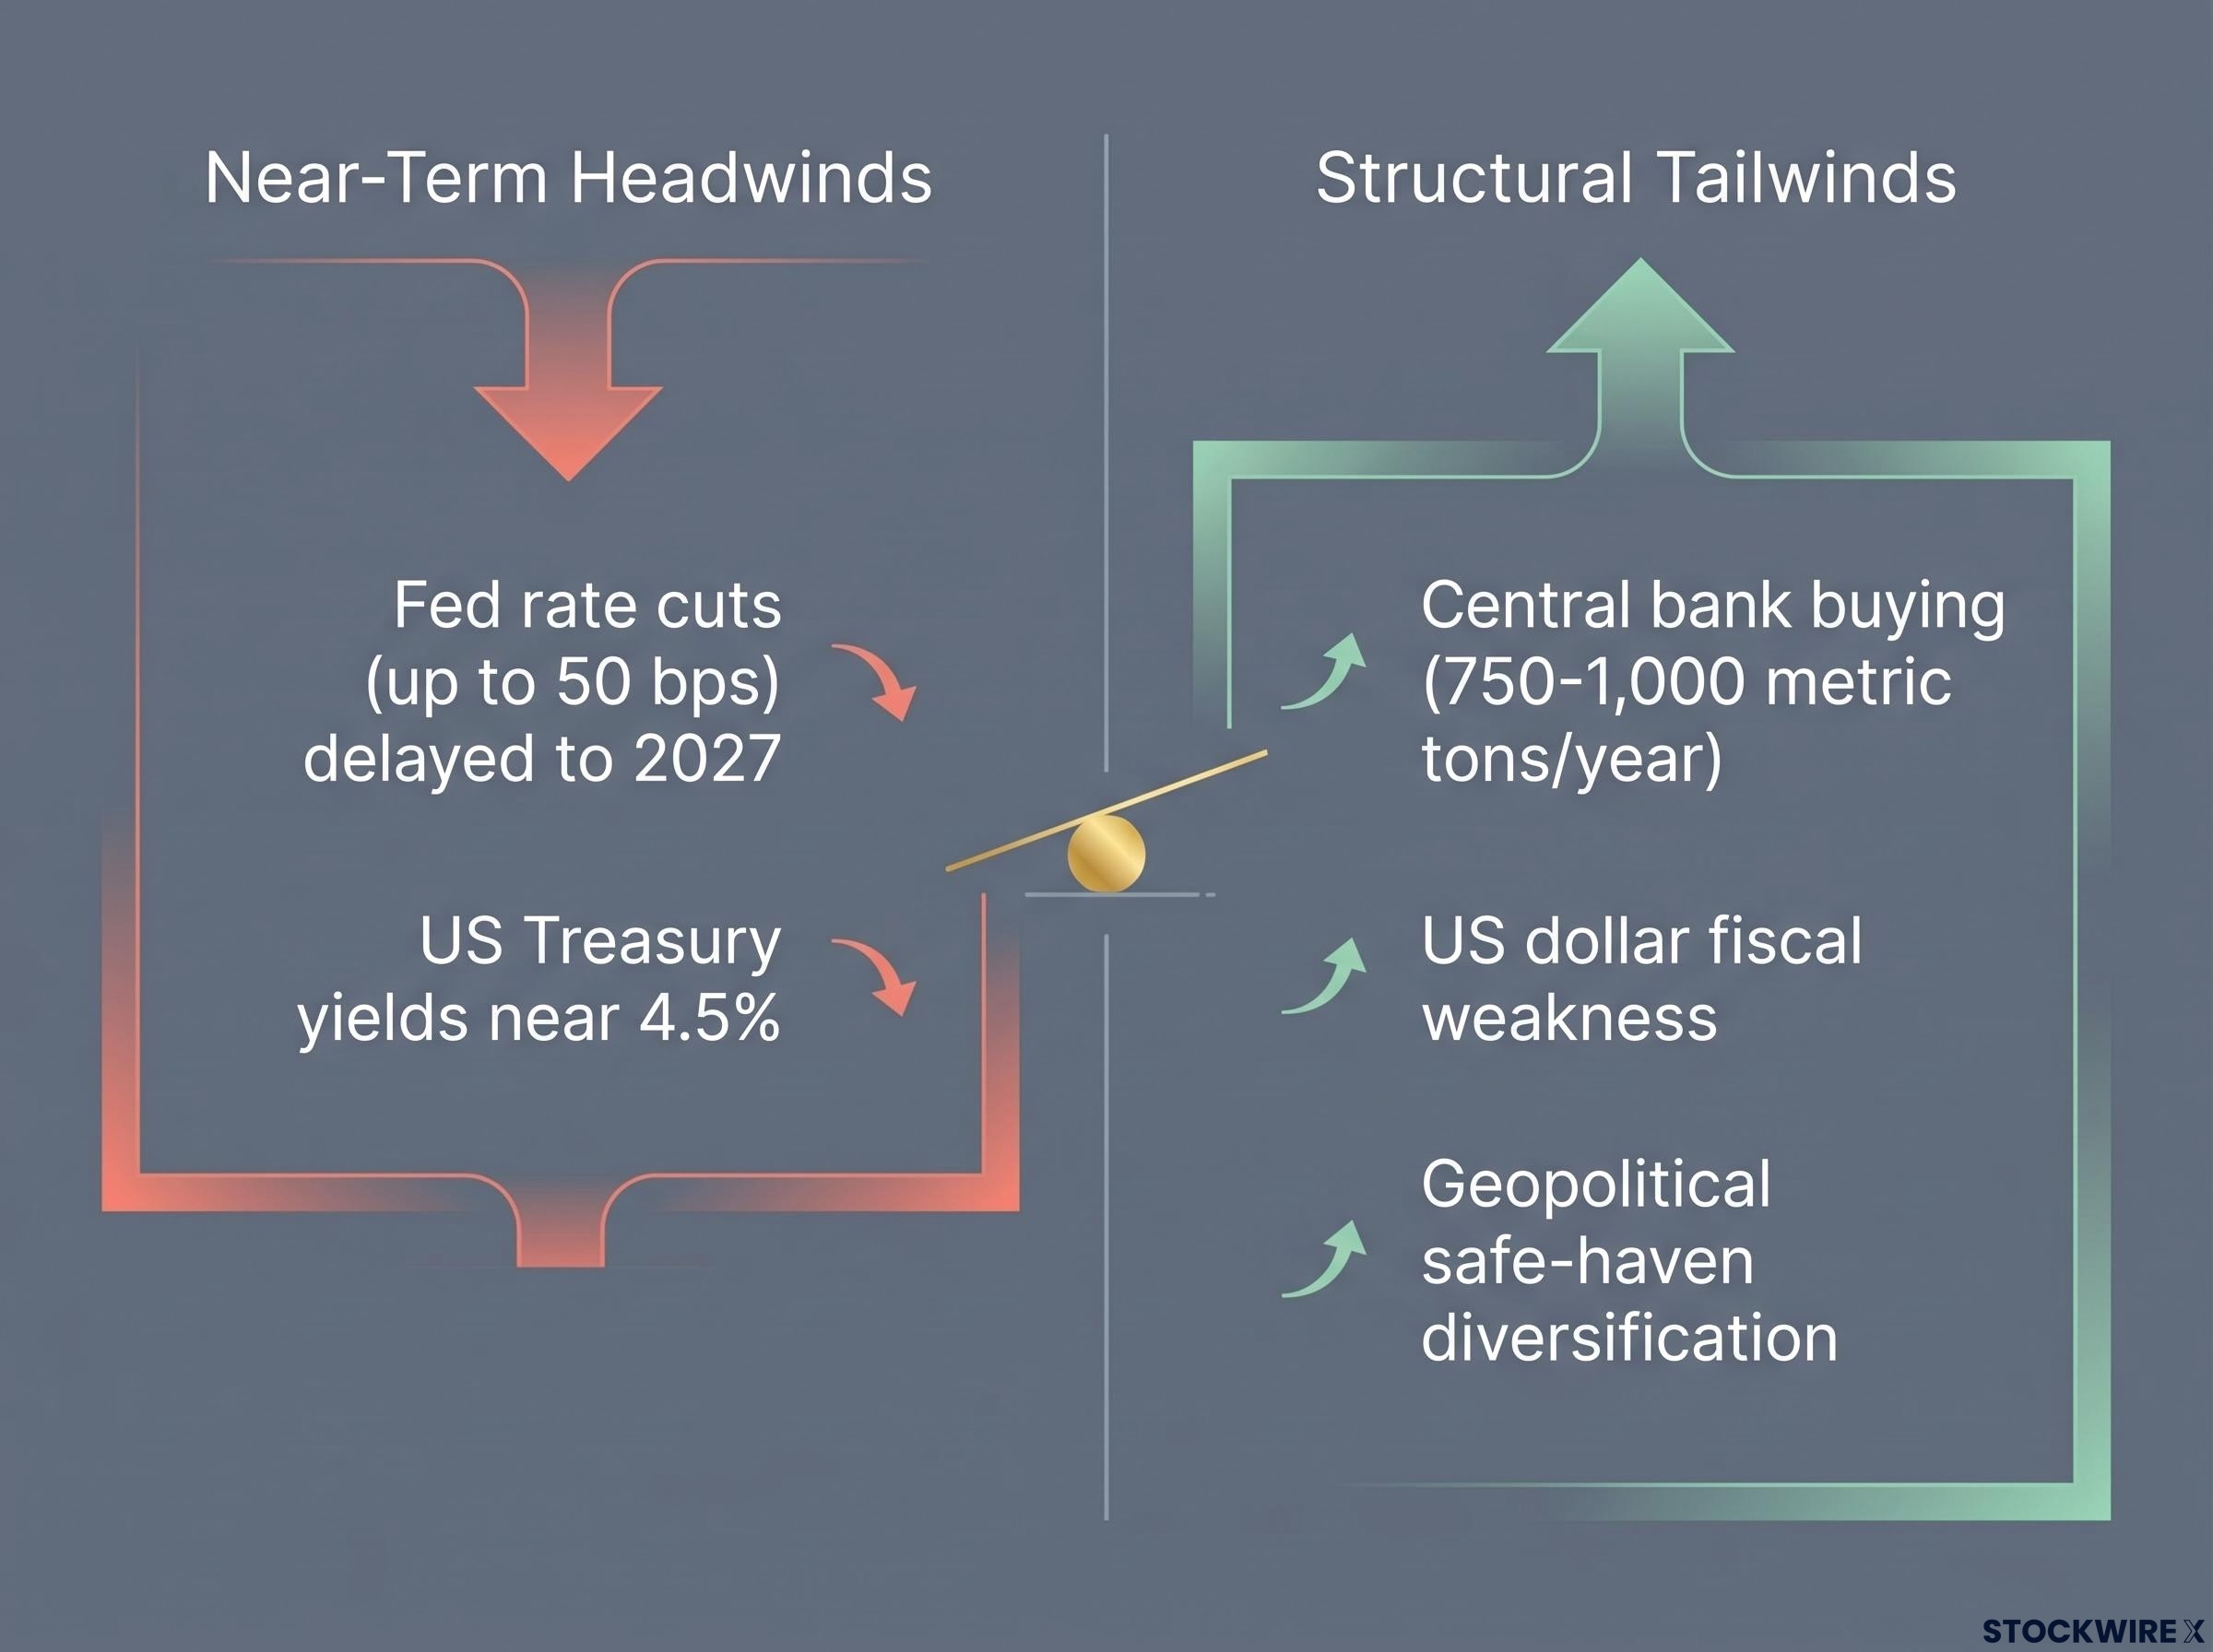
The two headwinds UBS identifies are not independent of each other. One created the conditions for the other to bite harder.
UBS’s base case now assumes Federal Reserve rate reductions totalling up to 50 basis points beginning in 2027, not 2026. That single shift removes the monetary easing tailwind gold typically benefits from across the near-term horizon. When investors expected cuts sooner, they were willing to hold a non-yielding asset in anticipation of falling real yields. With that timeline pushed back by roughly a year, the anticipation trade has partially unwound.
The second headwind compounds the first. Stronger US labour market readings and US Treasury yields near roughly 4.5% at the time of the May revision have raised the opportunity cost of holding gold. Some market participants repriced near-term rate expectations toward potential increases, further pressuring gold positioning.
Gold’s relatively muted response to heightened US-Iran geopolitical tensions contributed to profit-taking and signalled that the metal is currently more sensitive to macro yield drivers than to safe-haven headlines. For investors, this is a timing-and-yield story, not a structural reversal of the gold thesis.
Gold’s muted response to geopolitical risk, a pattern documented across the 2026 Iran conflict period when the metal fell more than 16% even as hostilities escalated, reflects the same dynamic UBS is now pricing into its revised forecasts: when elevated energy prices feed directly into inflation expectations, they tighten rather than loosen the Fed’s hand, compounding the yield headwind rather than offsetting it.
Gold pays no interest, no dividend, and no coupon. When interest rates are high, investors holding gold forgo the yield they could earn in US Treasuries or other fixed-income instruments. That forgone yield is the opportunity cost, and it rises directly with real interest rates (nominal rates adjusted for inflation).
The Federal Reserve controls short-term rates, and its forward guidance shapes expectations across the yield curve. The logical chain runs as follows:
With Treasury yields near 4.5% and the first Fed cut now pushed to 2027 under UBS’s base case, the macro setup that supported gold’s prior rally has partially unwound. Investors who understand this relationship can evaluate future Fed communications as direct leading indicators for gold, rather than reacting to headline price moves without context.
For readers wanting to trace the full mechanics in detail, our dedicated guide to bond yields and dollar pressure on gold walks through the opportunity cost arithmetic, historical Taper Tantrum comparisons, and the dual-channel effect of yields and dollar strength that together explain why institutional forecasts can remain bullish while near-term prices slide.
The near-term headwinds are real. UBS is not disputing them. What the bank is disputing is the notion that they invalidate the 12-month outlook.
Central bank demand sits at the core of UBS’s structural conviction. The bank forecasts annual central bank gold purchases in the 750 to 1,000 metric ton range, a level of institutional buying that operates independently of near-term macro conditions.
UBS annual central bank gold purchase forecast: 750 to 1,000 metric tons per year, a structural demand floor that operates on a different clock than Fed rate decisions.
Preliminary May 2026 data offers early evidence of ongoing sovereign demand. The People’s Bank of China reportedly added approximately 10 metric tons and Uzbekistan approximately 9 metric tons during the month, according to UBS’s research note, though these figures have not been independently corroborated through publicly indexed sources. World Gold Council data showed central bank purchases of 244 tonnes in Q1 2026, up 3% year-on-year.
World Gold Council central bank demand data for Q1 2026 recorded 244 tonnes of net purchases, a 3% year-on-year increase that reinforces UBS’s structural conviction that sovereign buying operates on a timeline largely independent of Fed rate decisions.
| Entity | Period | Volume |
|---|---|---|
| Global central banks (World Gold Council) | Q1 2026 | 244 tonnes |
| People’s Bank of China (preliminary) | May 2026 | ~10 metric tons |
| Uzbekistan (preliminary) | May 2026 | ~9 metric tons |
Beyond central bank buying, UBS points to two additional structural pillars:
These pillars explain why UBS has maintained its 12-month constructive stance despite the near-term downward revisions. Sovereign demand and fiscal dynamics operate on a different timeline than Federal Reserve decisions.
The $3,850 to $4,000 per ounce near-term drift zone from the June 12 note is not, in UBS’s framing, a warning to sell. It is a price band the bank is watching for accumulation.
The recent gold price trading range illustrates the competing pressures UBS is mapping: a 0.6% rebound to $4,460 on 3 June 2026 was capped almost immediately by above-forecast ADP payroll data and an ISM services prices-paid index at its highest level since 2022, a combination that reinforced Fed rate-hold expectations and limited follow-through buying.
UBS characterises the $3,850 to $4,000/oz drift zone as a potential accumulation opportunity, not an exit signal, viewing price weakness as an entry point for investors with a 12-month horizon.
Supporting that view, UBS notes that gold ETF outflows have been mild and that current positioning levels remain far from extreme. That gap leaves room for renewed investor participation if prices approach the lower band and the structural case reasserts itself.
The bank maintains a buy-on-dips posture over the 12 months from June 2026, conditional on the Fed easing cycle eventually materialising and the dollar weakening as fiscal pressures build. For context, the publicly revised year-end 2026 target of $5,500 per ounce still implies meaningful upside from current levels, even after the downward adjustments. The drift zone, in UBS’s reading, is a short-term technical event within a longer-term structural bull market.
UBS’s downward revisions reflect real near-term macro headwinds: a delayed Fed easing cycle, elevated real yields, and a resilient US economy. The forecast adjustment is meaningful, spanning $300 to $900 per ounce depending on the horizon. It is not, however, a change in strategic view.
The bank’s 12-month outlook remains explicitly constructive, anchored in central bank demand of 750 to 1,000 metric tons annually, anticipated US dollar weakness, and ongoing geopolitical diversification. The $3,850 to $4,000 per ounce drift zone is framed as an entry zone, not a floor-break warning.
The Goldman Sachs gold forecast of $5,400 per ounce for late 2026, maintained despite current price weakness, reflects a broadly similar structural conviction to UBS’s position, with Goldman modelling 50 basis points of Fed rate reductions in 2026 as delivering approximately $120 per ounce of direct price support and central bank accumulation of 750–850 tonnes providing the demand floor.
The two variables most likely to confirm or challenge UBS’s constructive case are Federal Reserve communications on rate timing and the direction of the US dollar. Investors seeking deeper context on those dynamics may find related coverage on central bank gold demand trends and Fed policy outlook useful for tracking the structural factors UBS is monitoring.
This article is for informational purposes only and should not be considered financial advice. Investors should conduct their own research and consult with financial professionals before making investment decisions. Past performance does not guarantee future results. Financial projections are subject to market conditions and various risk factors.
UBS revised its year-end 2026 gold price target to $5,500 per ounce on 26 May 2026, down $400 from its prior target of $5,900 per ounce, still implying roughly 22% upside from the approximate $4,496 spot price at the time of that revision.
UBS cut its gold price forecast by $300-$900 per ounce across multiple time horizons because it shifted its Federal Reserve rate-cut base case to 2027, and stronger US labour data combined with Treasury yields near 4.5% raised the opportunity cost of holding non-yielding gold.
UBS identified a near-term drift zone of $3,850-$4,000 per ounce in its 12 June 2026 research note, framing it as a potential accumulation opportunity rather than an exit signal for investors with a 12-month horizon.
When the Fed delays rate cuts, real yields stay elevated and bonds offer meaningful returns, raising the opportunity cost of holding non-yielding gold and putting downward pressure on prices; UBS's shift of the first Fed cut to 2027 is the primary driver behind its latest downward revisions.
UBS points to annual central bank gold purchases of 750-1,000 metric tons, anticipated US dollar weakness driven by fiscal and external deficits, and ongoing geopolitical reserve diversification as structural pillars that support gold over the medium term regardless of short-term Fed timing.