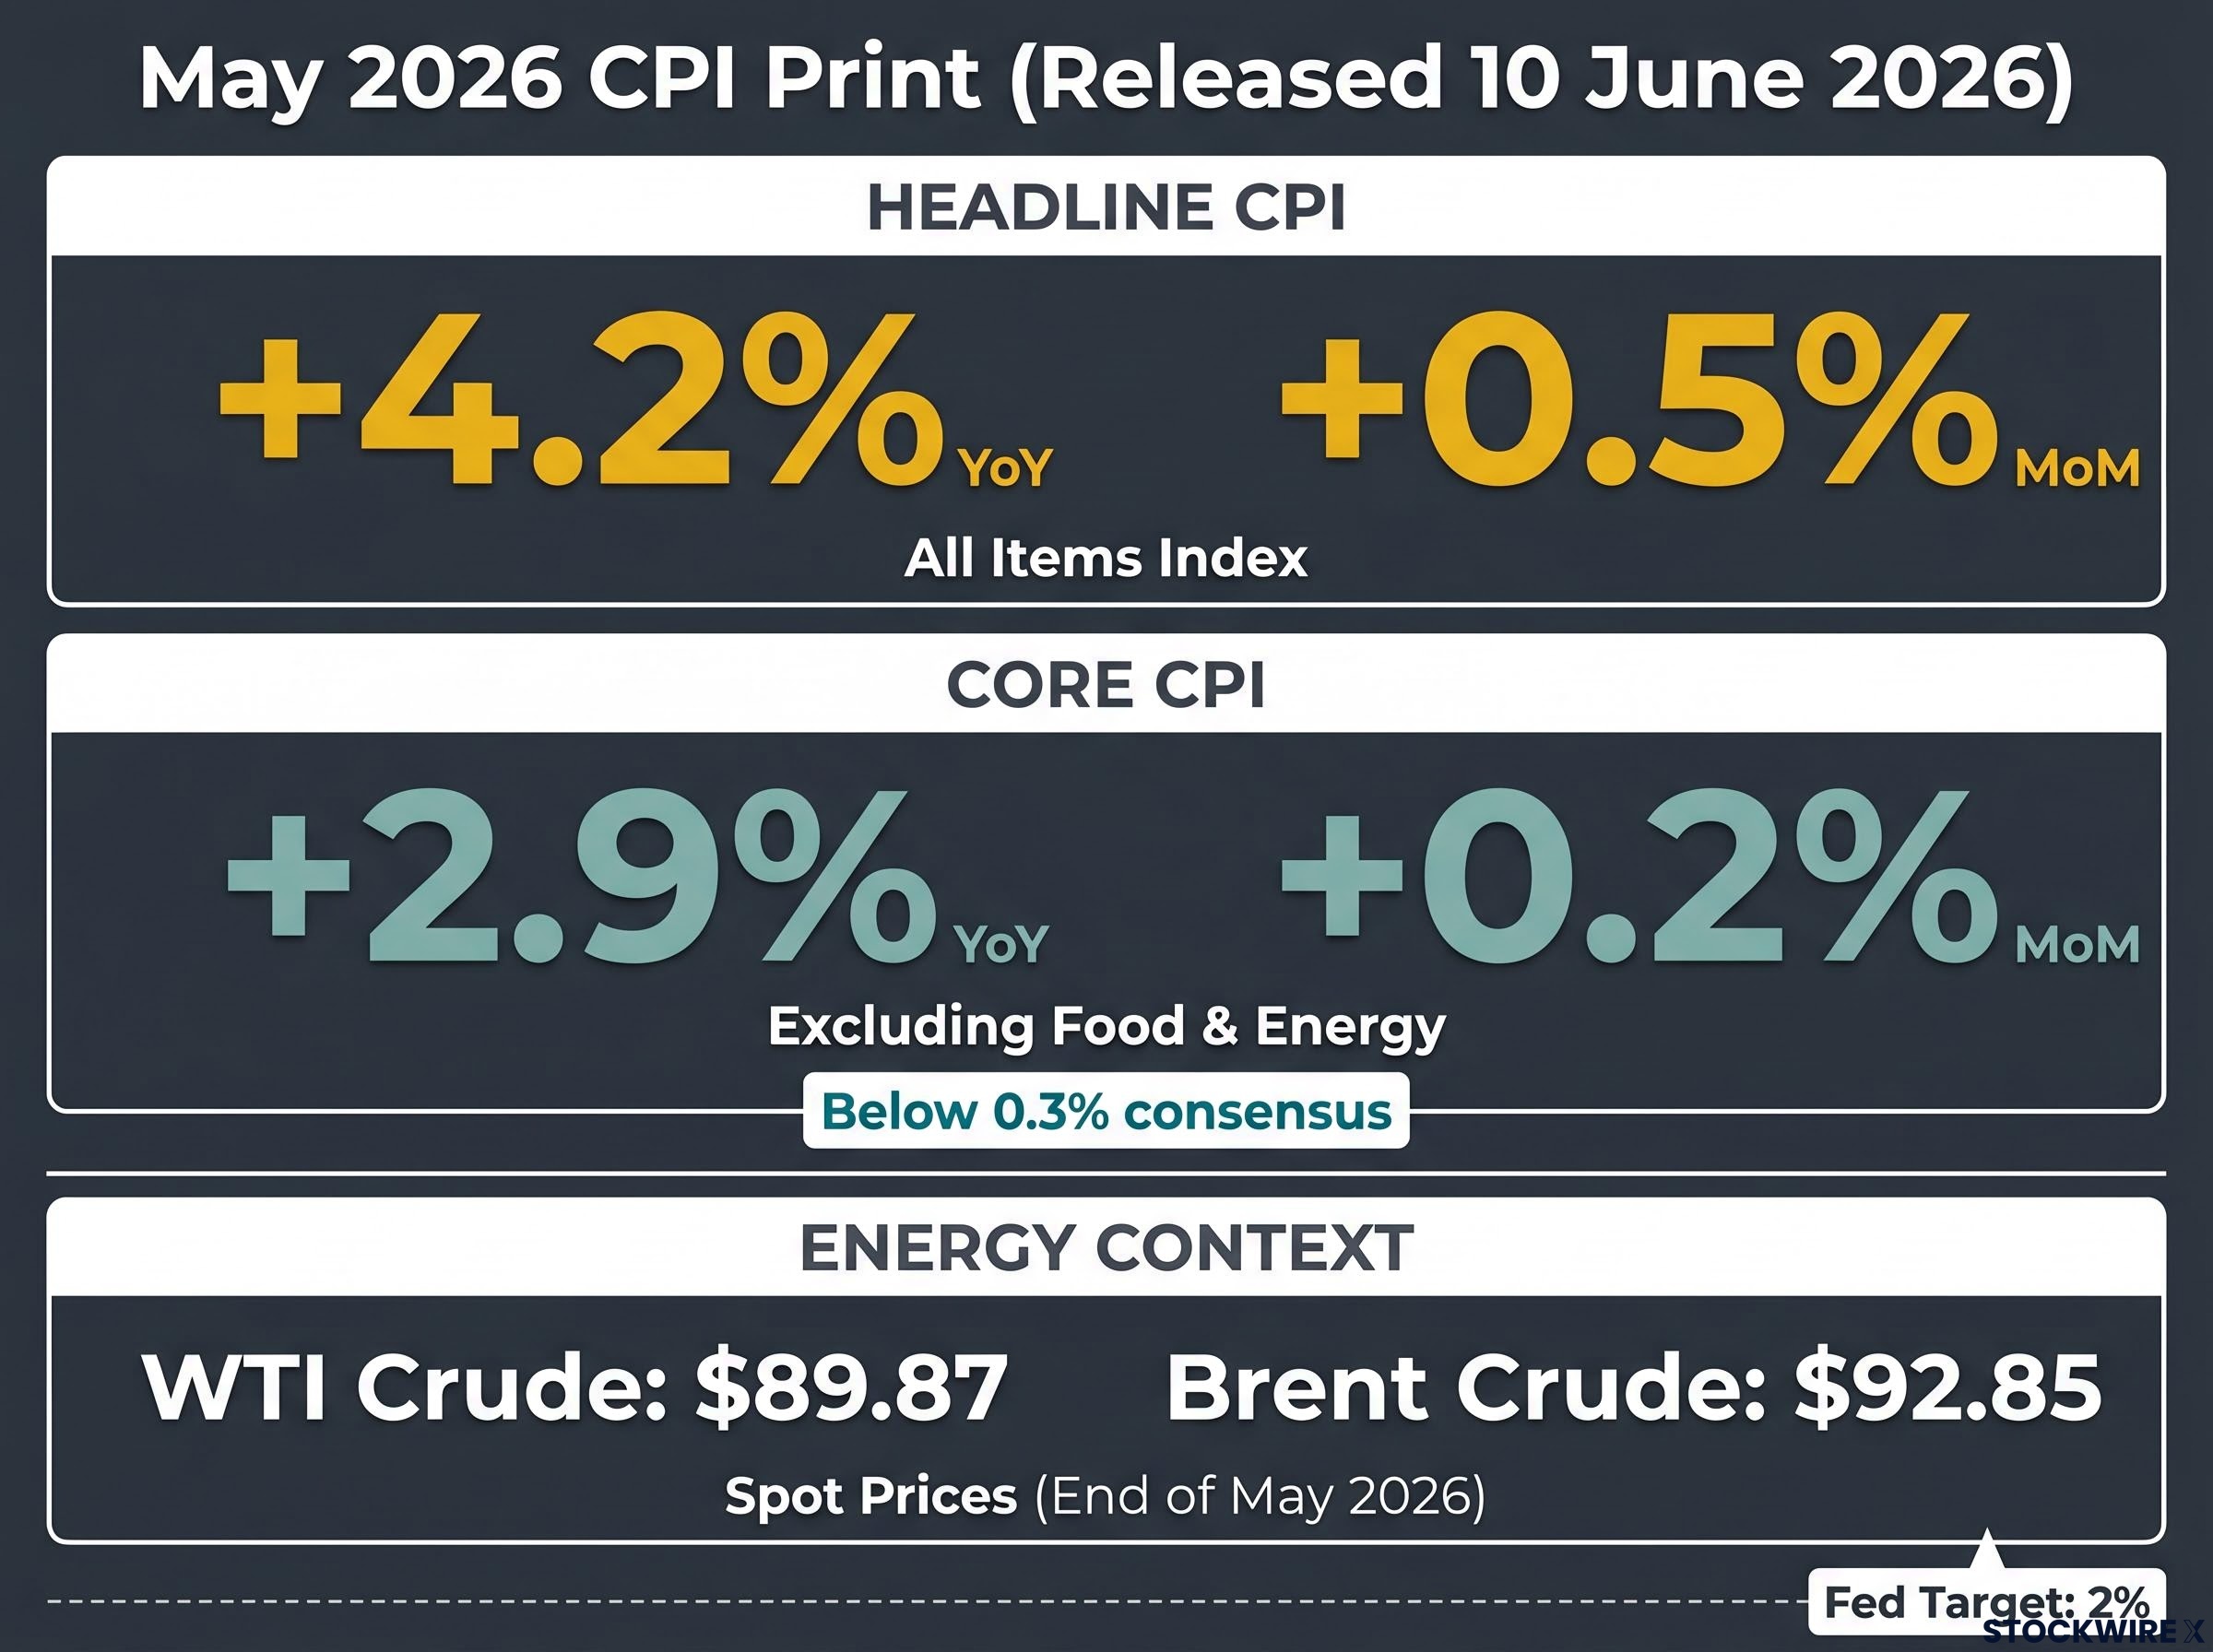
On the same morning that WTI crude hit $89.87 and Brent crossed $92, the U.S. Bureau of Labor Statistics released a May CPI print showing headline inflation at 4.2% year-over-year and core at a softer-than-expected 2.9%. Two numbers, one story: the Strait of Hormuz closure is already reshaping the inflation and rate outlook in real time. Four months of U.S.-Iranian military conflict have effectively choked the strait that carries roughly 20% of global oil and LNG flows. There is no scalable rerouting alternative. The oil price is not a prediction or a scenario; it is the current market clearing price for a world in which that chokepoint is compromised. The May CPI report, released 10 June 2026, is the first major inflation read that fully reflects sustained oil above $85. What follows explains the two-channel transmission from crude prices to consumer inflation, interprets what the headline-core divergence signals about second-round risk, maps the Federal Reserve’s constrained policy options under each oil scenario, and identifies the specific market indicators that will determine which outcome is unfolding.
Twenty percent of global oil flows through a strait that is effectively closed
Before the economics, the geography. The Strait of Hormuz is a narrow waterway through which approximately 20% of the world’s oil and liquefied natural gas transits daily. Pipeline bypasses exist, but they replace only a fraction of that throughput at current scale. When tanker traffic through the strait is disrupted, the global energy system has no full substitute.
The Hormuz oil risk premium is not simply a function of ships being unable to pass; the near-total withdrawal of commercial war-risk insurance has effectively closed the strait to standard commercial traffic even during periods when physical passage was technically possible, a structural layer of disruption that persists independently of any single military exchange.
The disruption is not hypothetical. Four months of joint U.S.-Israeli military operations against Iran have produced a retaliatory cycle that has intensified through June 2026:
- Iran conducted missile strikes on U.S. installations in Kuwait and Bahrain, deepening the exchange
- Five missiles were intercepted over Jordan, according to the Associated Press
- Prior U.S. strikes followed an attack on an American military helicopter near the strait, which Washington attributed to Tehran
- Israel continued operations in southern Lebanon targeting Iran-aligned Hezbollah forces
- On 10 June 2026, President Trump warned via social media that Iran would face consequences for delays in reaching a peace settlement; Fox News reported the administration was close to authorising strikes on Iranian power infrastructure and bridges
Brief diplomatic progress earlier in the week, after Iran and Israel agreed to suspend strikes under U.S. pressure, collapsed on the same day.
Wood Mackenzie has characterised the Hormuz disruption as the “single greatest threat to global energy markets in decades.”
That assessment is not hyperbole. WTI crude closed at $89.87, up $1.67 (+1.89%) on 10 June. Brent settled at $92.85, up $1.40 (+1.53%). These are not fear-driven spikes on a single headline. They are the market-clearing prices of a structural supply constraint that has persisted for four months and shows no immediate sign of resolution.
When big ASX news breaks, our subscribers know first
How oil at $90 transmits into the prices Americans actually pay
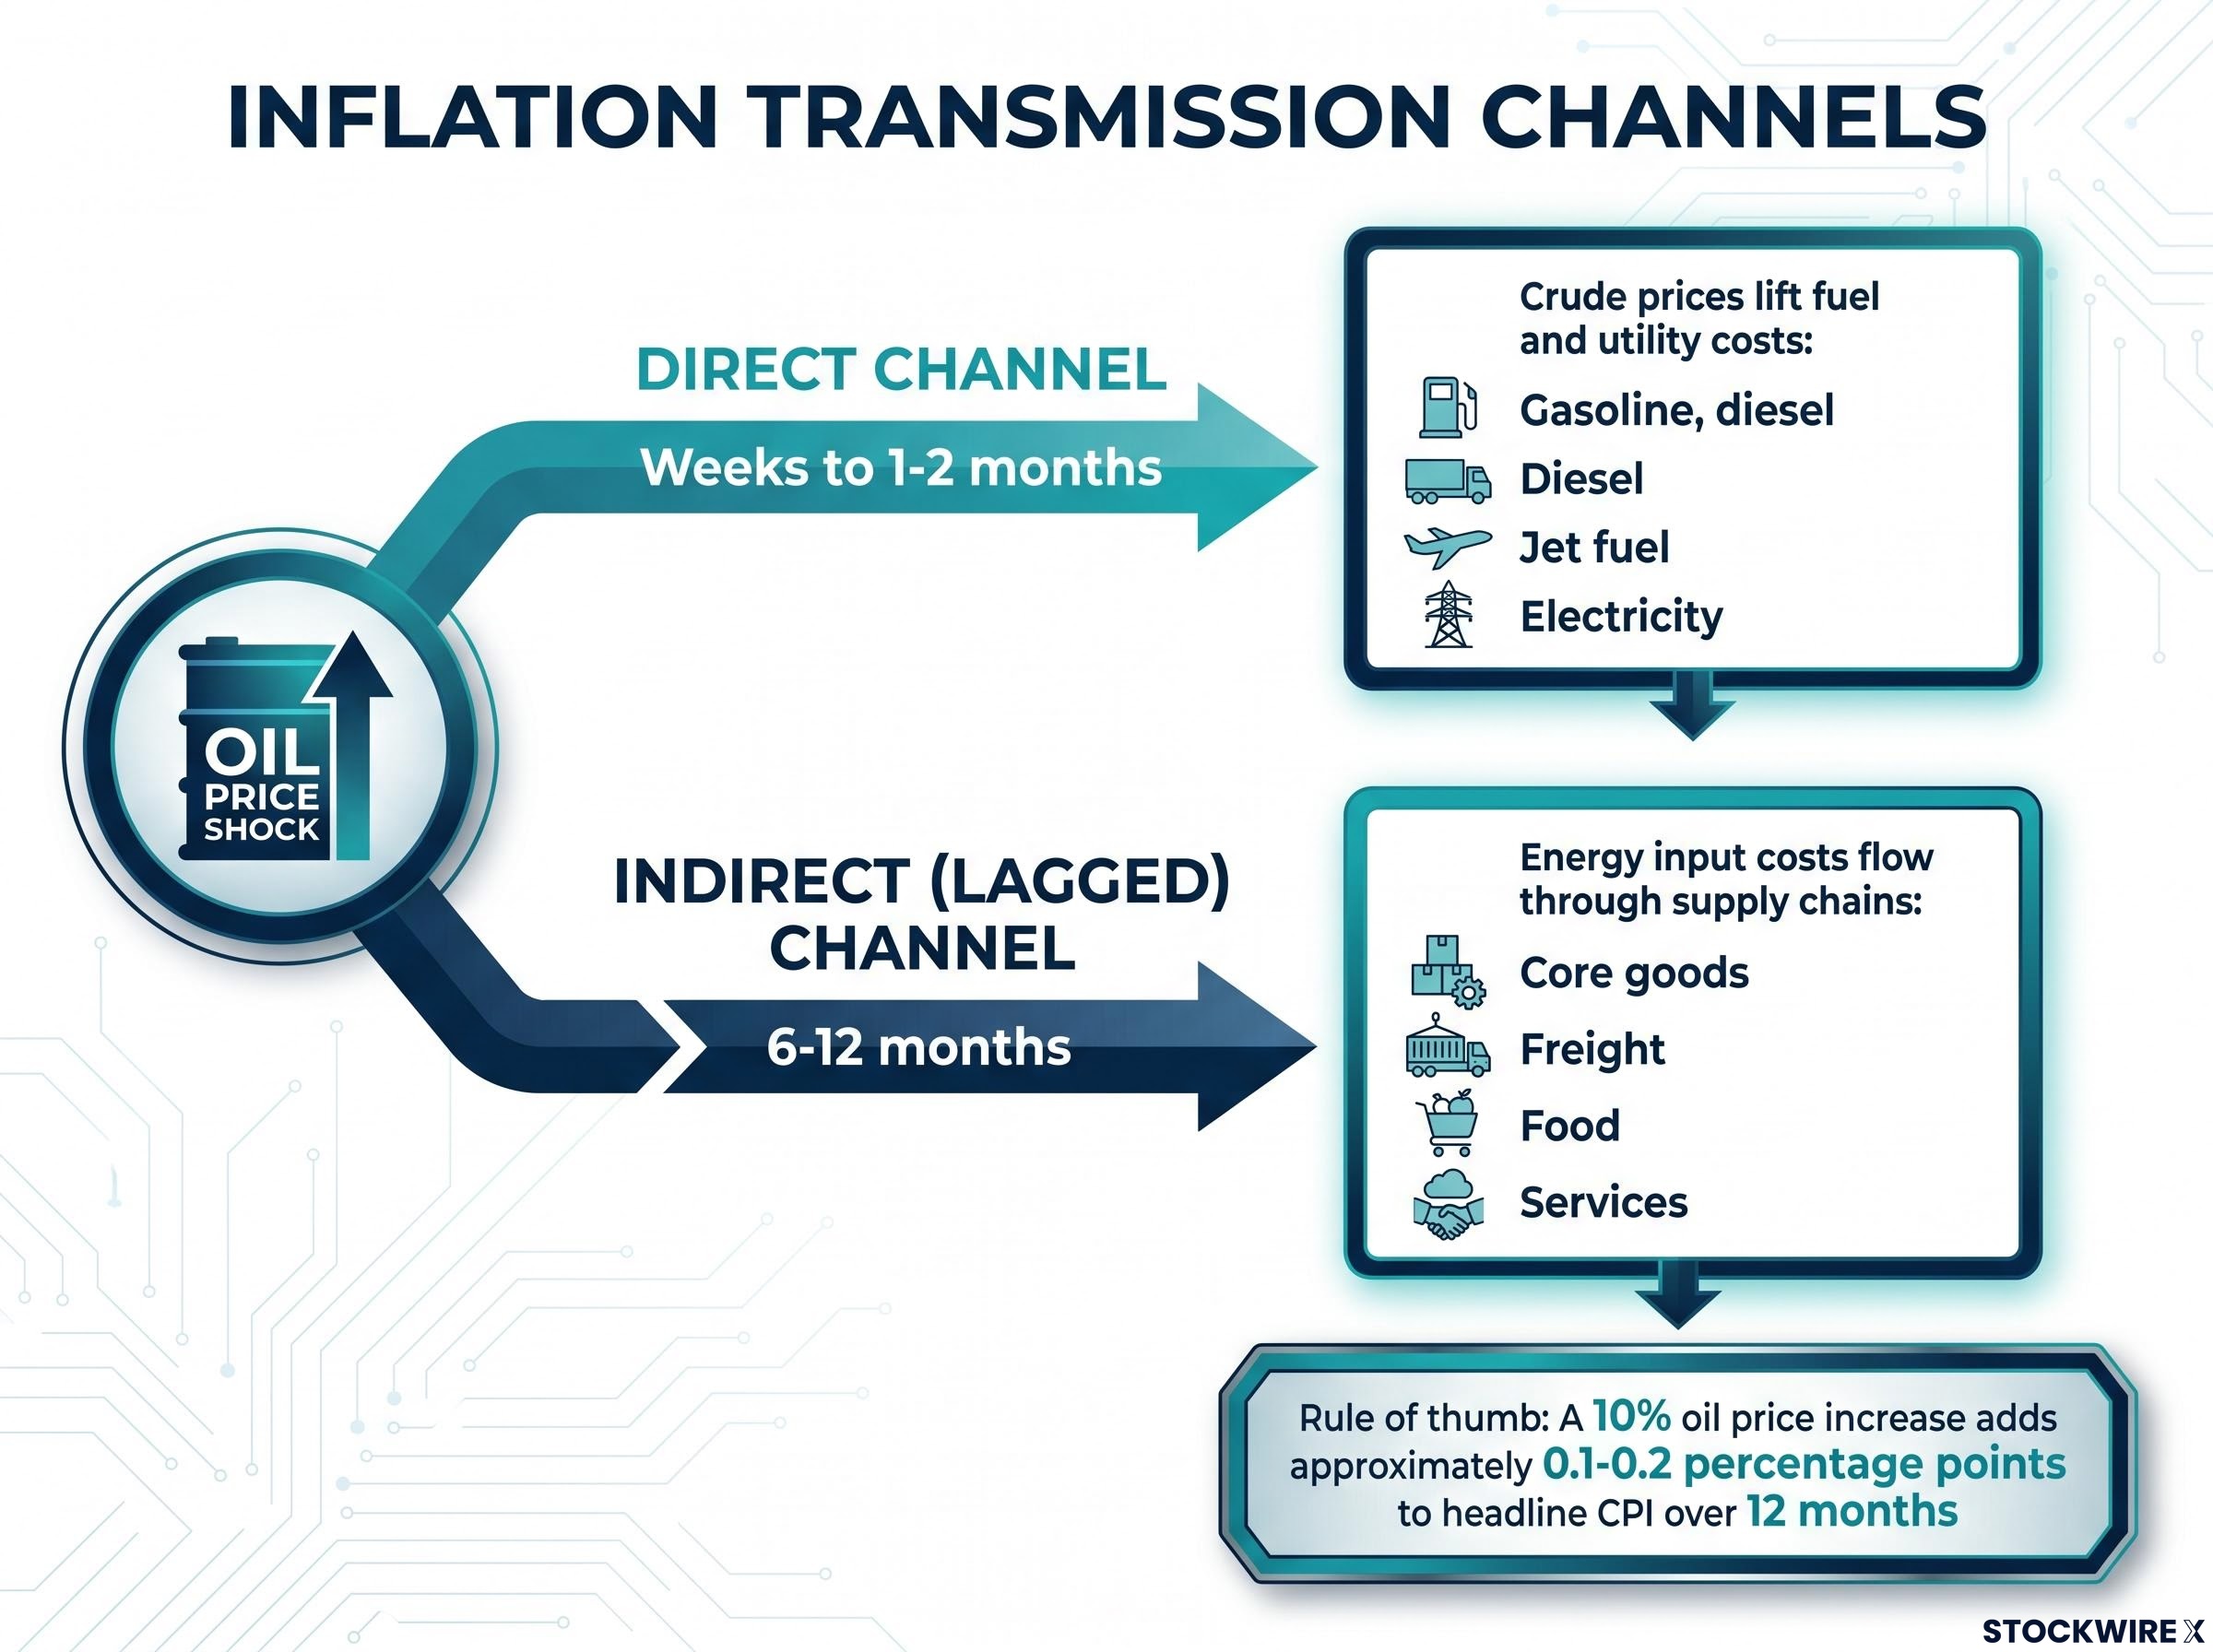
Crude oil feeds into consumer prices through two channels that operate on different clocks.
The direct channel moves fast. Higher crude lifts gasoline, diesel, jet fuel, and utility costs almost immediately. These show up in headline CPI energy components within weeks. A rule of thumb from central bank and academic literature holds that a 10% oil price increase adds approximately 0.1-0.2 percentage points to headline CPI over 12 months, depending on pass-through dynamics and tax structures.
The indirect channel is slower and more dangerous. Energy is an input cost for transportation, logistics, fertilisers, petrochemicals, and manufacturing. When oil stays elevated, those costs propagate through supply chains over 6-12 months, eventually reaching core goods and some services prices. The sectors most exposed include shipping, agriculture (via fertiliser costs), petrochemical inputs, and global logistics.
The distinction matters because a short-lived oil spike clears before the indirect channel activates at scale. A prolonged disruption does not.
| Channel | Transmission mechanism | Key CPI components affected | Typical lag time |
|---|---|---|---|
| Direct | Crude prices lift fuel and utility costs | Gasoline, diesel, jet fuel, electricity | Weeks to 1-2 months |
| Indirect (lagged) | Energy input costs flow through supply chains | Core goods, freight, food, services | 6-12 months |
The May CPI print released today captures the direct channel in full. The indirect channel is still building. Investors who conflate the two will misread the inflation data for months.
What the May CPI report actually says about second-round risk
The numbers themselves are straightforward. Headline CPI for May 2026 came in at +0.5% month-over-month and +4.2% year-over-year, both in line with analyst estimates. Core CPI (excluding food and energy) printed at +0.2% month-over-month, below the 0.3% consensus, and +2.9% year-over-year, matching forecasts.
The BLS Consumer Price Index release for May 2026 confirmed headline inflation at 4.2% year-over-year and core at 2.9%, providing the official underlying data that anchors the headline-core divergence analysis in this article.
The headline-core divergence is precisely the economic signature of a contained but persistent energy shock. Headline runs well above the 2% target because fuel costs are elevated and politically visible. Core remains above 2% but continues to drift lower, with the monthly 0.2% print consistent with gradual convergence. Through four months of disruption, second-round pass-through has not materialised in broad core measures.
Traders responded accordingly, scaling back rate-hike wagers after the softer core reading. A strong U.S. jobs report the prior Friday had already elevated expectations for a rate increase before year-end; the CPI data pushed back against that trajectory.
The signal that would change the inflation picture
The reassurance embedded in the 2.9% core reading is conditional. It holds only as long as the oil shock remains contained to the direct channel.
The conditions that would change the read are specific: core goods, transport, and services prices beginning to accelerate; wage growth responding to higher living costs; and TIPS breakevens (the bond market’s measure of expected future inflation) drifting upward. These are the indicators that would signal the lagged indirect channel is activating at scale. For investors monitoring fixed income positions, they represent the watchlist that separates a manageable energy shock from a broader inflation problem.
The Federal Reserve’s constrained position between two bad options
Energy shocks create a particular bind for central banks because they raise prices and weigh on growth simultaneously. The Fed has no clean option between protecting its inflation credibility and cushioning the economy.
The historical pattern offers some guidance. Across comparable episodes, including the 2008 oil spike, 2011-2012 Middle East tensions, and the 2022 Russia-Ukraine energy shock, the Fed’s response has followed three conditions:
- Inflation expectations stay anchored. The Fed focuses on medium-term expectations and core, not the initial headline spike. The 1970s remain the canonical failure case, where repeated shocks fed into wages and expectations and became entrenched.
- Core and wage trajectory remain contained. If core and wages hold while headline rises, the Fed typically “looks through” the energy component. If energy feeds into transportation, goods, and services prices and generates wage demands, the Fed treats it as a general inflation shock.
- Growth and labour market conditions determine the trade-off. A stagflationary shock, where prices rise while growth slows, forces the Fed to choose between credibility and economic support.
Given the May data, the Fed’s posture is “hold and watch.” Core at 2.9% and drifting lower provides no urgency to cut rates. Headline at 4.2% and potentially rising provides no room to cut. The softer core monthly print reinforced this stance and reduced near-term hike probability.
FOMC internal divisions have added a layer of uncertainty to the Fed’s stated ‘hold and watch’ posture: the April 29 decision produced a four-way dissent, the broadest committee split in years, with hawks outnumbering the lone dovish dissenter three to one, signalling that the threshold for moving from patience to action may be lower among committee members than the consensus guidance implies.
Fixed income investors need to understand exactly what data would shift the Fed from “hold” to “hike,” because that threshold determines duration risk across bond portfolios right now. The answer sits in the three conditions above: if any of them breaks, the Fed’s patience breaks with it.
Three scenarios for oil, inflation, and rates through late 2026
The current $85-95 oil environment sits in the middle of a wide professional forecast range. Three named scenarios capture the outcomes that matter for positioning.
| Scenario | Oil price range | Inflation outcome | Fed posture | Key rate implication |
|---|---|---|---|---|
| Negotiated De-escalation | Brent corrects $10-15 (Fitch base case: ~$87 average) | Headline drifts toward 3% by late 2026; core disinflation resumes | Shock treated as transitory | Market pricing tilts toward late-2026 cuts; long-end yields rally |
| Protracted Stalemate | Brent $85-95 band | Headline stuck above 4%; core stalls in high-2s to low-3s as lagged effects activate | Higher for longer; data-dependent | Cuts become conditional; TIPS breakevens and 10-year yields are the stress gauges |
| Escalation | Brent $100-110+; Wood Mackenzie severe case near $200; Brookings-based analysis ~$150 | Headline retests 5%+; second-round effects become materially more likely | Stagflation risk; credibility pressure | Short-end reprices for at least one hike; curve flattens or inverts on growth fears |
The asymmetry across these scenarios is worth noting. A negotiated de-escalation would bring modest relief, a $10-15 correction in Brent and a resumption of the disinflation path that was already in progress. The escalation scenario carries materially worse consequences: headline CPI retesting 5%+, second-round effects activating through logistics, food, and wage channels, and a Fed forced to consider tightening into weakening growth.
Wood Mackenzie’s severe case, with Brent approaching $200 and over 11 million barrels per day curtailed, represents the asymmetric tail risk. A Brookings-based analysis summarised by Investopedia in May 2026 placed Brent near $150 if the closure extends past mid-year.
The downside is larger than the upside given current positioning. Portfolios calibrated for the stalemate scenario face limited adjustment if de-escalation arrives, but face significant repricing if escalation materialises.
Investors wanting to stress-test the three scenarios against institutional projections will find our full explainer on Hormuz oil price forecasts, which maps EIA, Goldman Sachs, and JPMorgan estimates through 2027 with explicit probability weights assigned to reopening and prolonged closure outcomes across the full $79-$142 forecast range.
The five indicators that will tell you which scenario is playing out
Investors who wait for the next CPI report will be trading on lagged data. Five indicators update in real time and will resolve the scenario uncertainty weeks before the next monthly inflation print.
- Hormuz tanker traffic and pipeline capacity reports. Any verifiable sign of increased tanker throughput or partial reopening is immediately price-relevant. Conversely, any attack on Gulf production or export infrastructure (not just shipping lanes) warrants repricing toward the severe scenarios.
- Oil time spreads: backwardation versus contango. Backwardation (near-term contracts priced above longer-dated ones) signals structural tightness and ongoing supply concern. A shift toward contango signals the market is treating the disruption as transient.
Financial market signals worth watching daily
- Diesel and jet fuel crack spreads. Refined product stress links more directly to CPI components than crude alone. Widening crack spreads indicate that the energy cost pressure feeding into headline inflation is intensifying at the consumer-facing level.
- TIPS breakevens and 5-10 year inflation expectations surveys. These measure how anchored long-term inflation expectations remain. A sustained drift upward shifts the Fed’s posture from patient to pre-emptive. This is the single most actionable indicator for fixed income positioning.
- 10-year Treasury yield. A move toward the mid-4% range with rising breakevens signals markets pricing renewed inflation risk and potential additional hikes. A move lower with stable or falling breakevens signals confidence that the shock is contained and disinflation remains on track.
Together, these five indicators form a composite picture of whether the market’s confidence in the Fed’s “hold and watch” posture is holding or eroding. TIPS breakevens and the 10-year yield are the most efficient aggregators because they compress oil, inflation, and rate expectations into a single daily-updating signal.
Four months in, the inflation story is still being written
The May CPI divergence between 4.2% headline and 2.9% core is not a resolution. It is a snapshot of a dynamic that has not yet fully played out through the lagged transmission channels. The direct channel has delivered its effect; the indirect channel, operating on a 6-12 month clock, is still building.
The Fed’s hold posture is stable only as long as core stays contained and expectations stay anchored. Both conditions are directly tied to whether oil remains near $90 or moves materially higher. The five indicators outlined above will determine whether this episode resolves as a 2022-style contained shock, where the Fed successfully looked through the energy component, or as something more structurally disruptive for fixed income and inflation expectations.
For investors who want to extend the escalation scenario analysis further into macro risk, our deep-dive into oil shock recession transmission examines the four simultaneous channels through which triple-digit oil flows into recession probability, including Moody’s Analytics placing the 12-month US recession probability at 48.6% and Morgan Stanley’s adverse modelling of Brent at $150-$180 if the strait remains blocked through Q3 2026.
This article is for informational purposes only and should not be considered financial advice. Investors should conduct their own research and consult with financial professionals before making investment decisions. Past performance does not guarantee future results. Financial projections are subject to market conditions and various risk factors.