How Wesfarmers’ AI Strategy Is Built to Compound Returns
6 hrs ago

April’s 3.8% headline inflation print landed on 12 May 2026 like a verdict: the highest reading in over a year, enough to convince markets that the remaining 2026 rate cuts were dead on arrival. But headline numbers can deceive, and the composition of this one matters more than the total. The Bureau of Labor Statistics report showed core inflation (which strips out food and energy) rising to 2.8% from 2.6% in March, a comparatively modest move. Energy prices drove the bulk of the headline acceleration, from 3.3% to 3.8% year-over-year. The Federal Open Market Committee (FOMC) had already flagged rising global energy prices in its 29 April statement, signalling that policymakers were watching this dynamic closely before the data arrived. What follows is a decomposition of what actually moved in the April report, why the inflationary surge may prove more temporary than consensus fears suggest, and what the inflation trajectory means for equity investors positioning through the second half of 2026.
The initial reaction was understandable. A 3.8% headline print, up from 3.3% a month earlier, with a +0.6% month-over-month increase, looks like inflation re-accelerating. Growth-sensitive equities sold off. Rate-cut expectations collapsed.
Then the detail beneath the headline told a different story.
Core CPI, which excludes the volatile food and energy categories, rose to 2.8% year-over-year from 2.6%, with a month-over-month increase of +0.4%. That is firmer than the Fed would like, but it is not the kind of broad-based acceleration that rewrites the monetary policy outlook.
The Bureau of Labor Statistics April CPI release confirmed the energy index rose 17.9% year-over-year and 3.8% month-over-month, making energy by far the largest single contributor to the headline acceleration and reinforcing the case that core inflation, not the headline figure, is the more reliable guide to underlying price pressure.
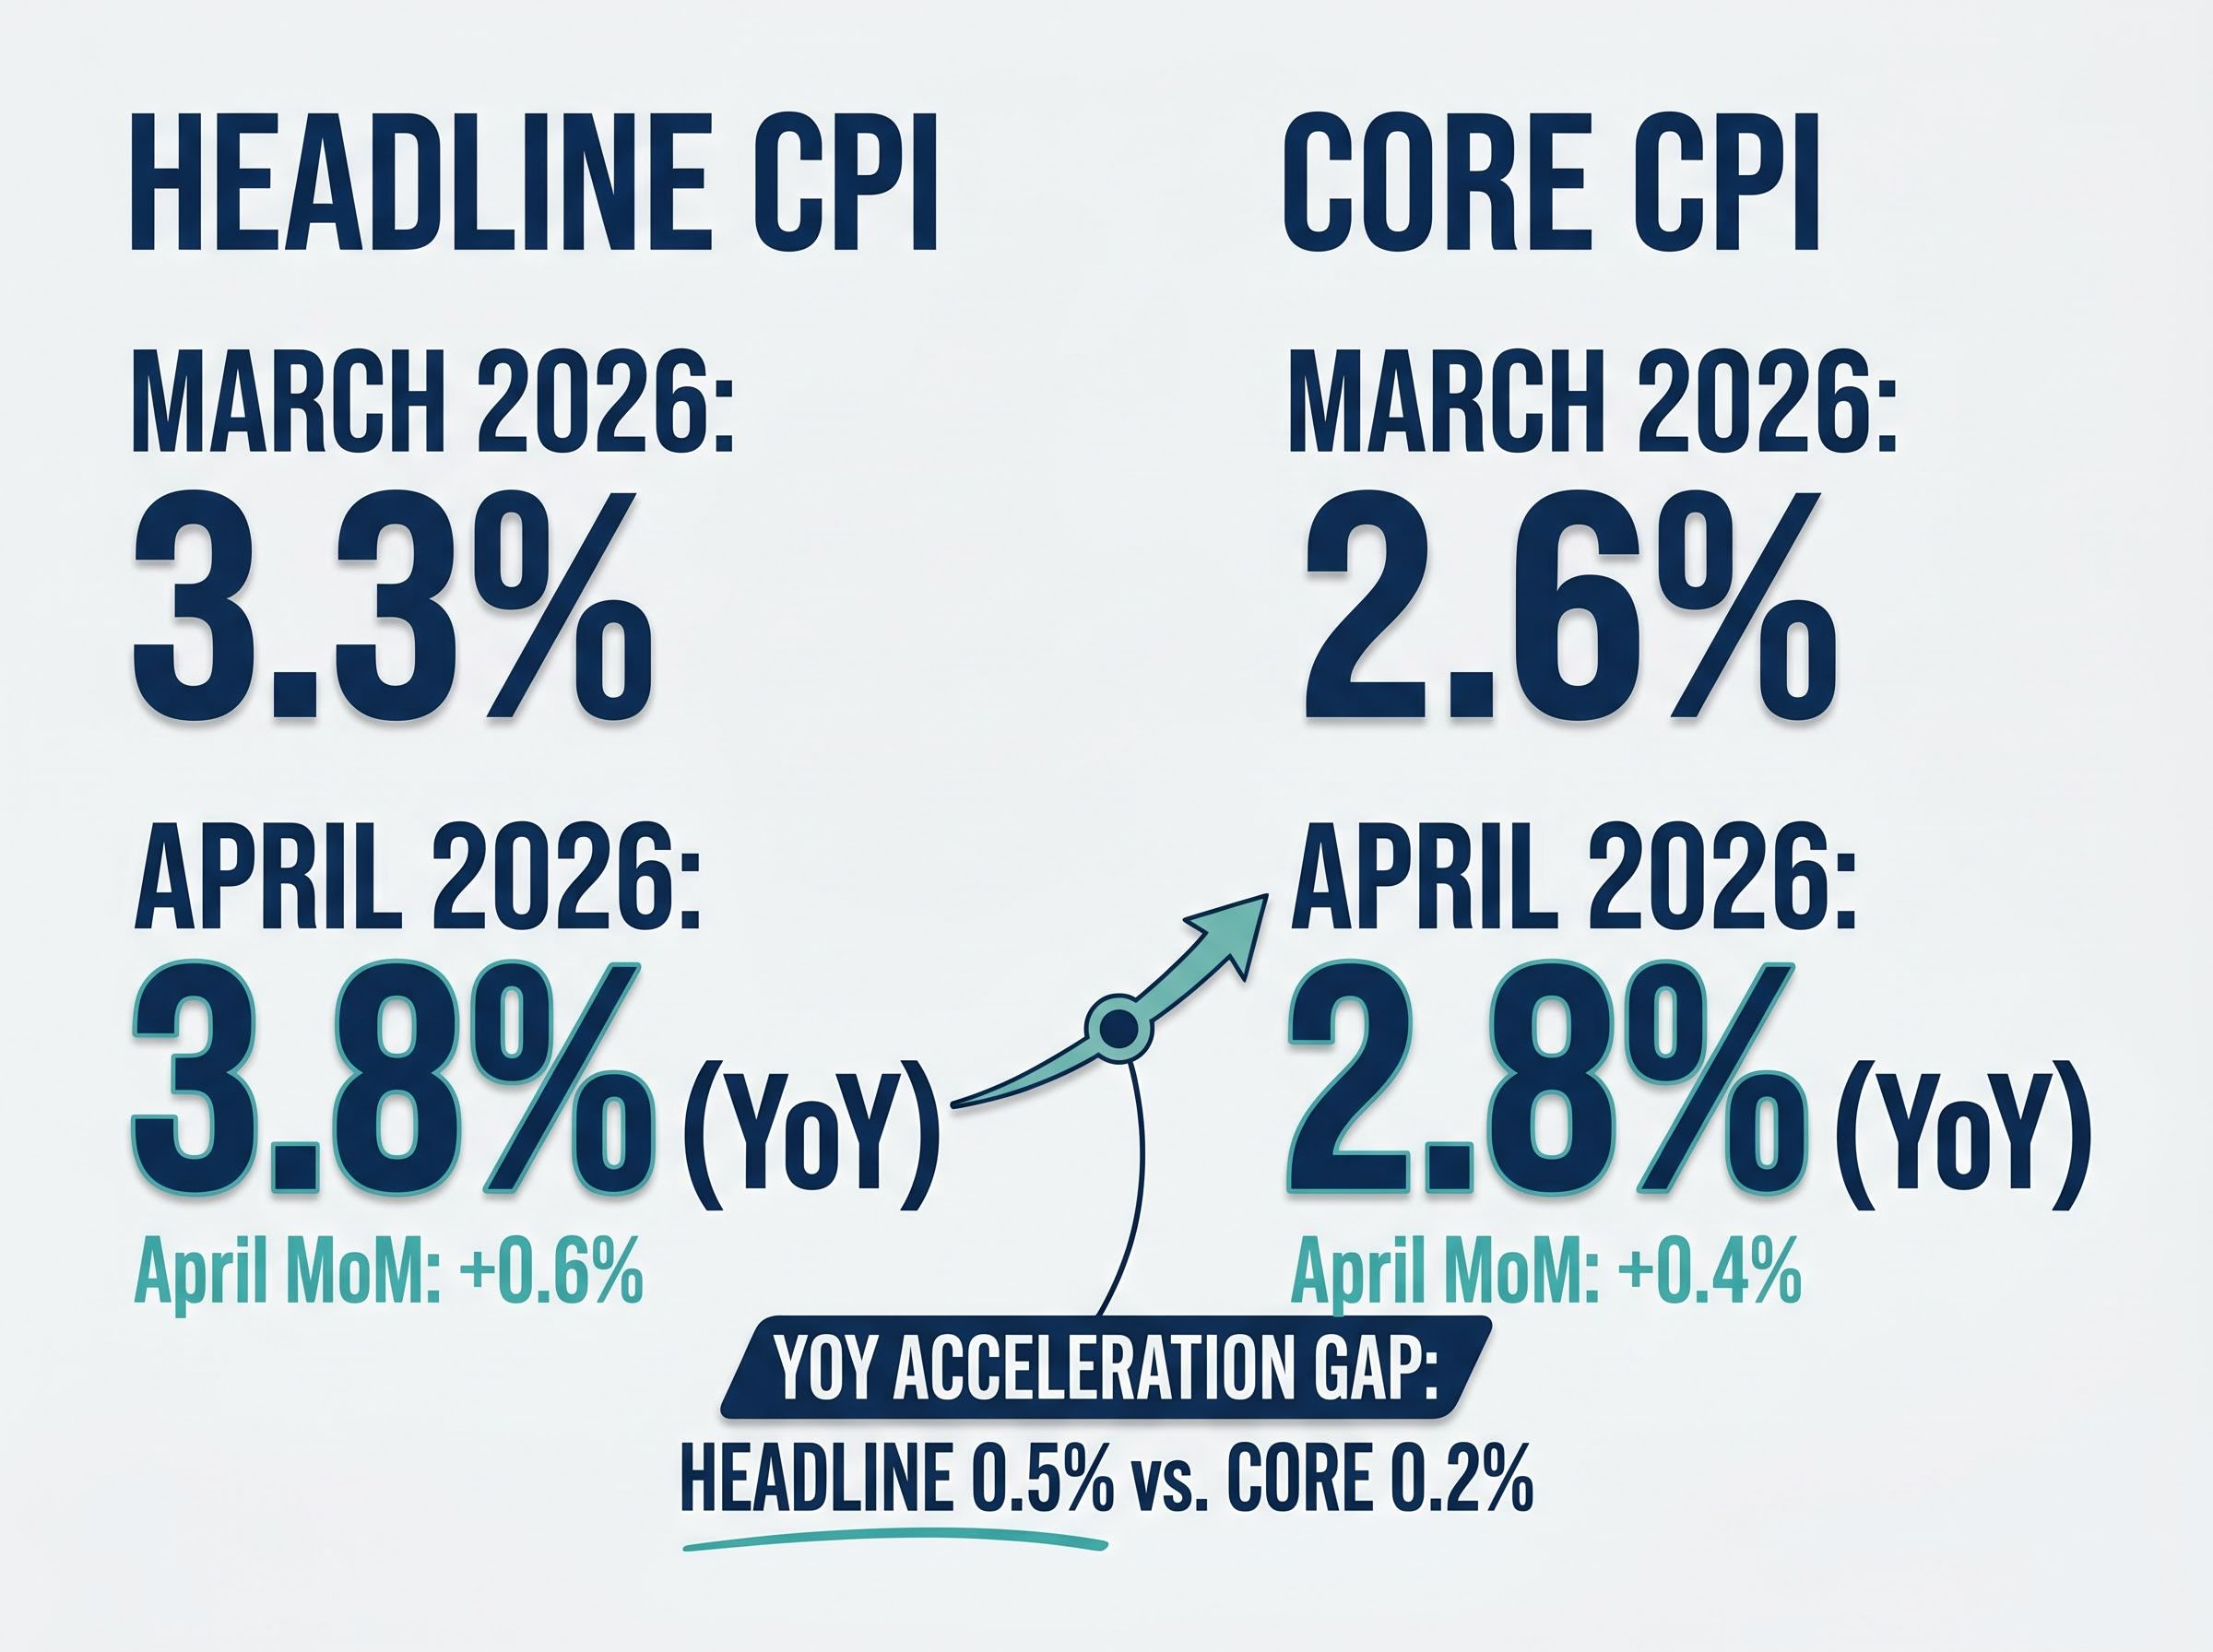
| Measure | March 2026 | April 2026 |
|---|---|---|
| Headline CPI (YoY) | 3.3% | 3.8% |
| Core CPI (YoY) | 2.6% | 2.8% |
| Headline CPI (MoM) | — | +0.6% |
| Core CPI (MoM) | — | +0.4% |
Energy accounted for the bulk of April’s headline acceleration. Core inflation, which excludes food and energy, moved only 20 basis points year-over-year, from 2.6% to 2.8%.
Investors who repositioned based on the headline alone may be making a different bet than they intend. The distinction between a broad-based inflation problem and an energy-driven spike carries materially different implications for rate policy, sector exposure, and portfolio duration.
Energy price surges and broad-based structural inflation produce the same headline number but follow different trajectories. For investors deciding whether April’s CPI warrants a portfolio repositioning, the distinction is where the answer starts.
Energy-driven spikes share three characteristics that typically differentiate them from structural inflation:
The 2022-2024 energy price shock episodes illustrate this pattern. Conflict-driven surges transmitted rapidly into headline CPI, prompted aggressive monetary tightening expectations, and then faded as supply conditions normalised, often faster than consensus had projected at the peak of the alarm.
Core inflation at 2.8% is the figure that strips out this volatile component and offers a cleaner read on underlying price pressure.
Oil price transmission into core CPI is not instantaneous; analyst pass-through estimates place 40-60% of a crude price increase into core categories over a 3-6 month lag, meaning the June and July CPI prints will carry more policy weight than the April figure in determining whether the current energy shock stays confined to headline inflation or begins broadening into services and goods.
The FOMC’s 29 April 2026 statement explicitly referenced “recent increases in global energy prices” as an inflation input. That language is significant. By isolating energy as a distinct variable, rather than characterising inflation broadly as re-accelerating, the Fed signalled that its policy calculus already distinguishes between the headline number and the underlying trend. This framing suggests rate decisions will weigh the durability of the energy shock, not simply react to the top-line print.
For investors wanting to understand the full context behind the Fed’s current posture, our full breakdown of the 29 April FOMC decision examines the four-way dissent in detail, including how the Strait of Hormuz closure shaped the committee’s language and why three hawks outnumbered the lone dovish dissenter in a split that has direct implications for how policymakers will respond to the April CPI data.
Not every analyst interpreted the April report as the start of a sustained inflation problem. Fisher Investments offered a contrarian reading, arguing that the inflation outlook is “likely more favourable than current market consensus.”
The reasoning rests on a monetary framework. Sustained inflation, in this view, requires sustained monetary fuel: money supply growth that outpaces the economy’s capacity to absorb it. Without that fuel, price surges driven by external supply shocks tend to be self-limiting.
Fisher Investments cited two specific factors:
Fisher Investments characterised the inflation outlook as “likely more favourable than current market consensus,” arguing that restrained monetary conditions reduce the probability of a sustained, larger inflation surge.
A data limitation is worth noting honestly. Verified M2 money supply series for 2025-2026 are not yet widely available in published form. The directional argument rests on the monetary framework and on Fisher Investments’ stated view as of 12 May 2026, not on a specific published M2 figure. China’s M2 grew 8.6% year-over-year in April 2026 (per FactSet), beating consensus, a counter-data point that complicates any global monetary restraint narrative.
This is one analytical perspective, not established fact. But the framework it applies, distinguishing between inflation with monetary fuel and inflation without it, is a useful lens for investors evaluating whether consensus fears are correctly calibrated.
The April CPI print prompted markets to abandon remaining 2026 rate-cut expectations. For equity investors, this is where the inflation debate stops being abstract and becomes a portfolio decision.
Higher-for-longer rates raise the discount rate applied to future earnings. Growth-sensitive sectors, where valuations depend most heavily on earnings projected years into the future, face the sharpest compression. This was visible in the market reaction following the 12 May release, with growth equities coming under documented pressure as rate-cut timelines were repriced.
The equity market reaction to the April print was itself informative: the S&P 500 closed near 7,425 on 12 May without a significant sell-off, suggesting markets had already absorbed much of the inflationary deterioration in the weeks before the BLS release, and that the money supply argument against sustained inflation had already filtered into institutional positioning.
The inflation picture does not exist in isolation. April 2026 retail sales rose +0.5% month-over-month and +4.9% year-over-year, per FactSet. Industrial production increased +0.7% month-over-month and +1.4% year-over-year. These figures describe an economy that is not weakening under the inflation pressure, which complicates the Fed’s calculus: cutting rates into strong demand risks reinforcing inflation, but holding rates higher for longer risks overcorrecting if the energy surge fades.
For equity investors, two scenarios carry distinct implications:
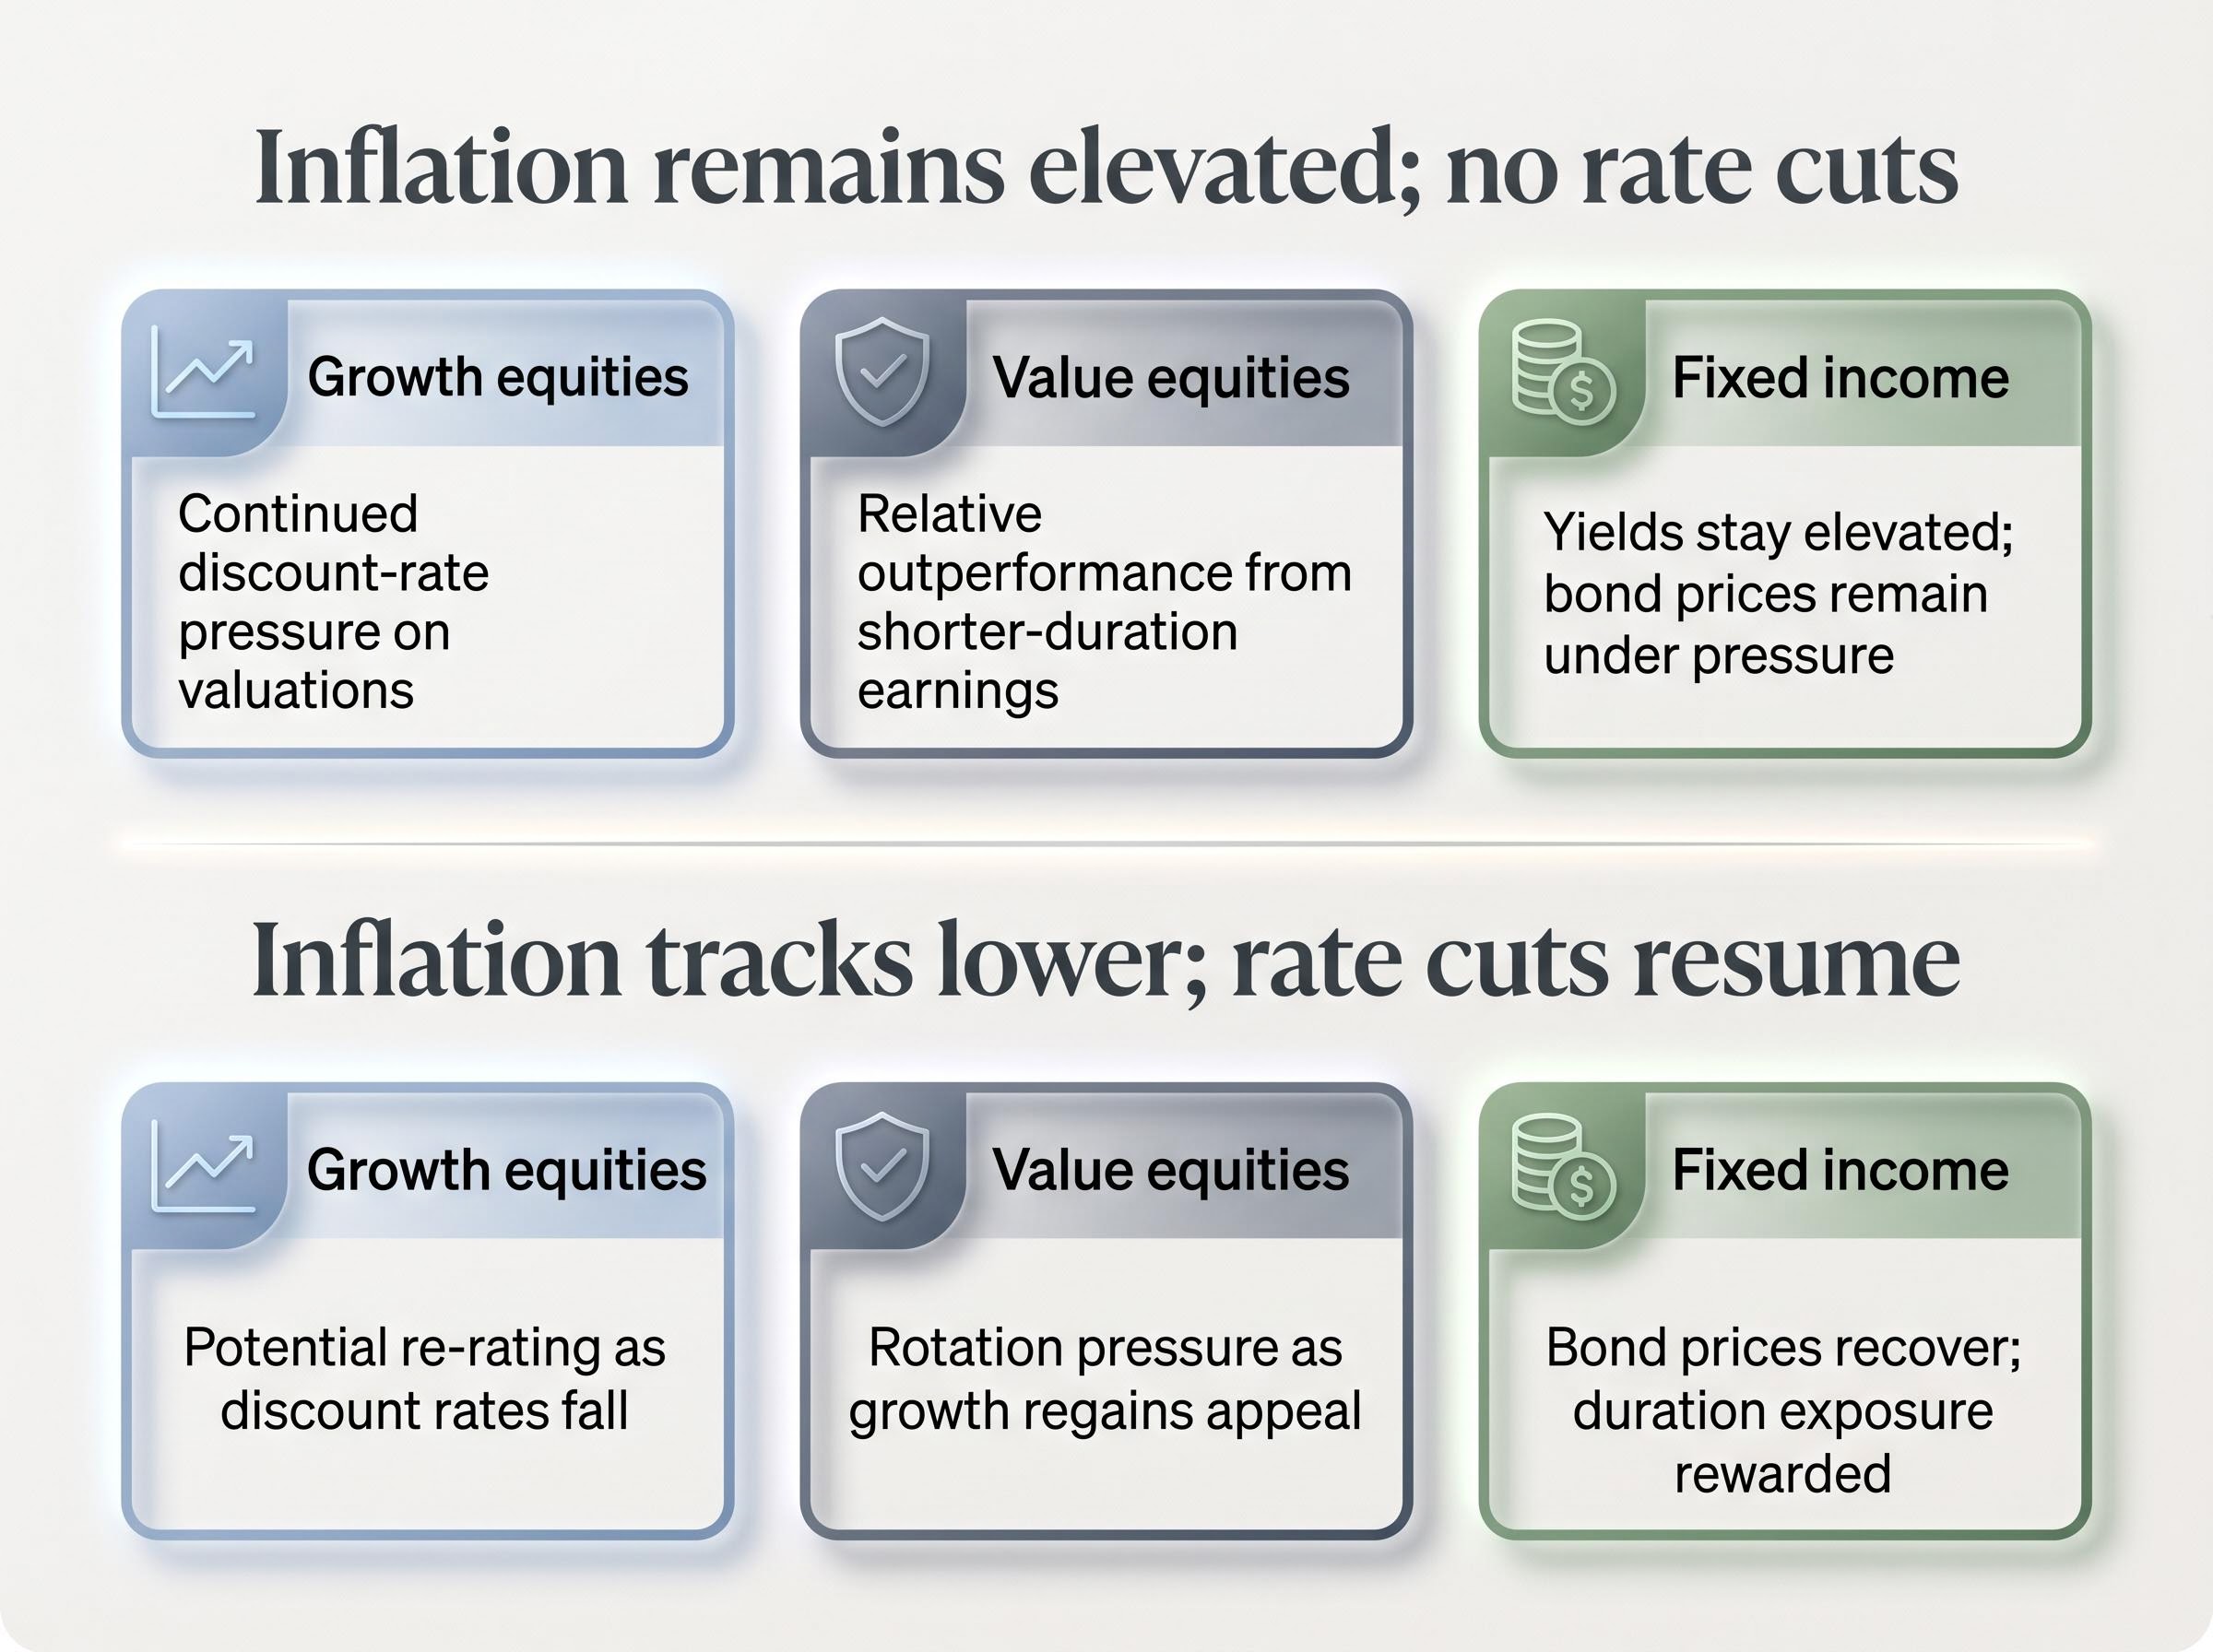
| Scenario | Growth equities | Value equities | Fixed income |
|---|---|---|---|
| Inflation remains elevated; no rate cuts | Continued discount-rate pressure on valuations | Relative outperformance from shorter-duration earnings | Yields stay elevated; bond prices remain under pressure |
| Inflation tracks lower; rate cuts resume | Potential re-rating as discount rates fall | Rotation pressure as growth regains appeal | Bond prices recover; duration exposure rewarded |
The rate-cut repricing is where the inflation call becomes a direct portfolio allocation decision. Knowing which scenario the data supports, and watching the signals that confirm or disconfirm each path, is more productive than reacting to each monthly print in isolation.
If inflation does track more favourably than consensus currently expects, what would the confirming data look like? Fisher Investments characterised the outlook as “a potential upside surprise for investors,” and the conditions that would validate that view are specific enough to monitor.
A positive inflation surprise would mean:
Fisher Investments described the inflation trajectory as “a potential upside surprise for investors,” suggesting the current consensus may be pricing in more persistent inflation than monetary and supply conditions warrant.
This is not a prediction. It is a monitoring framework. Investors who understand the specific conditions that would confirm a cooling trajectory can make more deliberate decisions, rather than reacting to each data release as if it were a standalone verdict.
April’s headline print was driven by energy. Core inflation moved modestly. The monetary backdrop, at least as Fisher Investments reads it, argues against sustained acceleration. And the consumer and industrial economy remains resilient enough to complicate any simple narrative.
Three takeaways for investors:
The Fisher Investments perspective is one analytical view, not a forecast guarantee. The energy and geopolitical uncertainties are real. But investors who treat the inflation data as a nuanced signal, decomposing the components rather than reacting to the headline, are better positioned to hold through volatility or act when confirming data arrives.
Investors ready to act on either scenario outlined above will find our dedicated guide to tactical inflation allocation in 2026 useful; it covers specific asset tilts toward Treasury Inflation-Protected Securities, REITs, and quality equities with pricing power, alongside the case for a cash buffer to exploit dislocations if the energy shock persists longer than the base case.
This article is for informational purposes only and should not be considered financial advice. Investors should conduct their own research and consult with financial professionals before making investment decisions. Past performance does not guarantee future results. Financial projections are subject to market conditions and various risk factors.
Headline CPI includes all consumer prices, including volatile food and energy costs, while core CPI strips those out to reveal underlying price trends. For investors, core CPI is generally a more reliable guide to whether inflation is structurally re-accelerating or being driven by temporary external shocks.
The April 2026 headline inflation reading of 3.8% was driven primarily by a 17.9% year-over-year surge in energy prices, not by broad-based price pressure across the economy. Core inflation, which excludes food and energy, rose only modestly from 2.6% to 2.8%.
Energy-driven inflation spikes tend to push rate-cut expectations lower because they lift the headline CPI figure the Fed monitors, even when underlying price pressure remains contained. Markets abandoned remaining 2026 rate-cut expectations after the April print, though the Fed's own language suggested it was tracking energy as a distinct and potentially temporary variable.
Investors should monitor May and June core CPI prints to see if price pressure broadens beyond energy, energy price trends for signs of stabilisation or retreat, and May 2026 preliminary PMI readings scheduled for the week of 18 May, which will provide real-time signals on activity and pricing pressure.
Fisher Investments argued that sustained inflation requires sustained monetary fuel, meaning money supply growth that outpaces economic capacity. Their view, stated on 12 May 2026, is that restrained monetary expansion makes it unlikely the current energy-driven spike will translate into persistent broad-based inflation, though verified M2 data for 2025-2026 was not yet widely published at the time.