The UK economy expanded by 0.6% quarter-on-quarter in the first three months of 2026, the Office for National Statistics confirmed on 14 May 2026. That translates to an annualised pace of approximately 2.5%, the strongest quarterly reading since Q1 2025. Before the release, prediction markets on Lines.com had priced just a 37.5% probability of even a 0-0.3% print, meaning the result landed well clear of where most participants were positioned.
The number arrives on a day when gilt markets are simultaneously processing political noise around the Labour leadership, making clean interpretation harder than usual. Whether the 0.6% figure represents a durable shift in the UK’s growth trajectory or a statistical catch-up from a weak second half of 2025 is the question that matters most for UK-exposed portfolios. What follows breaks down the mechanics: the sectoral architecture beneath the headline, the demand deferral hypothesis that may explain much of the strength, how the ONS constructs its quarterly estimate, what professional forecasters are signalling, and what investors should actually update on the basis of a single quarter.
The headline number and what it actually measures
The Q1 2026 GDP figure of +0.6% q/q sits alongside a revised Q4 2025 reading of +0.2% q/q, up from an initial estimate of +0.1%. That upward revision matters: it means the economy entered 2026 from a slightly higher base than previously understood, which marginally reduces the catch-up arithmetic needed to explain the Q1 result.
The annualised equivalent of approximately 2.5% sounds forceful. It is worth understanding what that figure is and is not. Annualisation takes one quarter’s growth rate and extrapolates it over four quarters, a convention common in US economic commentary but rarely used as the primary metric in UK reporting. The 2.5% figure assumes the economy would sustain 0.6% growth every quarter for a year. It did not do so in 2025, and forecasters do not expect it to in the quarters ahead.
| Metric | Value |
|---|---|
| Q4 2025 GDP (q/q, revised) | +0.2% |
| Q1 2026 GDP (q/q) | +0.6% |
| Q1 2026 GDP (annualised) | ~2.5% |
| 12-month growth (3 months to Feb vs. year earlier) | +0.8% |
The 0.8% year-on-year growth rate, measured over the three months to February against the same period a year earlier, strips out single-quarter volatility and offers a more conservative reading of the UK’s actual growth pace.
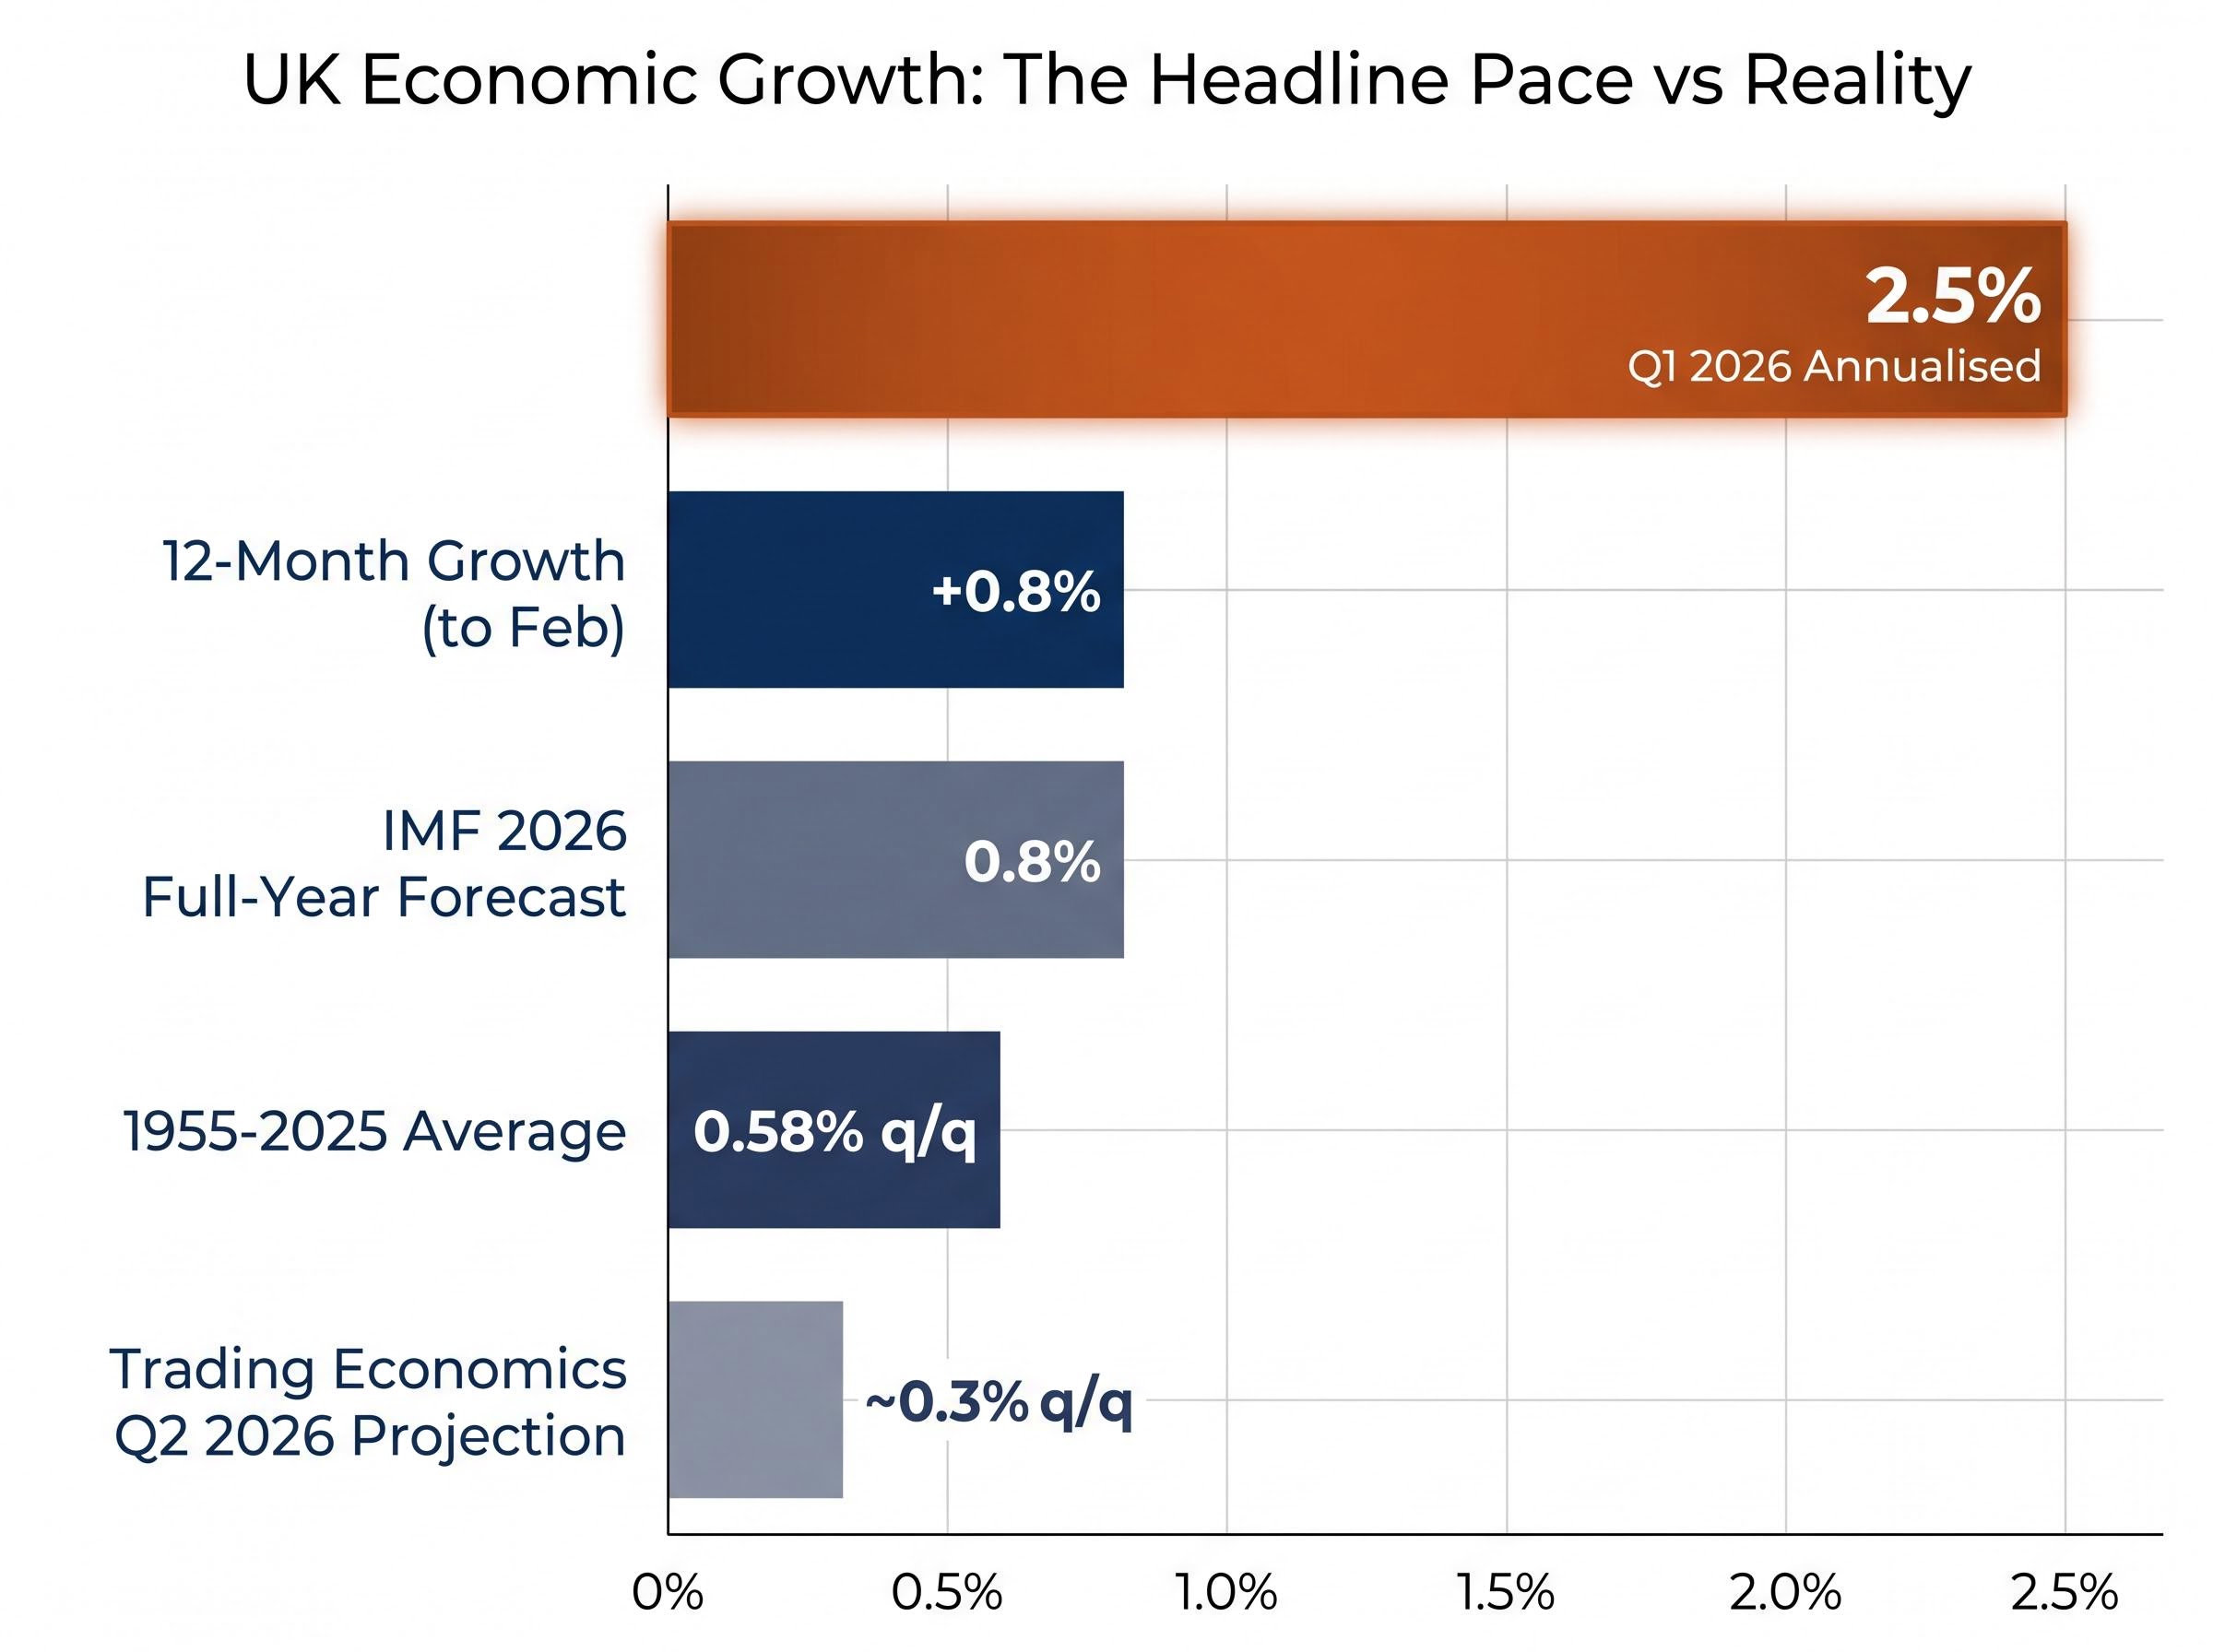
The gap between 2.5% annualised and 0.8% year-on-year is the analytical crux. Investors who anchor to the wrong metric will draw the wrong conclusions. The long-term average quarterly growth rate from 1955 to 2025 sits at 0.58% q/q, according to Trading Economics. At 0.6%, Q1 barely exceeded that historical norm.
The pattern of headline GDP masking demand composition has played out simultaneously in the US, where a 2.0% annualised Q1 2026 print concealed a private sector running at 2.2% once government spending swings and tariff-driven import cycles were stripped out, a reminder that sector-level decomposition routinely tells a different story than the top-line number.
When big ASX news breaks, our subscribers know first
Understanding UK GDP data: how the ONS measures quarterly growth
Before forming a view on what the 0.6% figure means, it helps to understand what the ONS is actually measuring and where the number can mislead.
How the ONS constructs the quarterly number
- The measurement approach. ONS quarterly GDP is a chain-linked, seasonally adjusted estimate drawing on three approaches: output (what was produced), expenditure (what was spent), and income (what was earned). The quarterly figure is a weighted composite, not a simple sum of monthly readings.
- Why Q1 is particularly prone to distortion. Seasonal adjustment uses statistical models to strip out predictable calendar effects, such as shorter working days, holiday patterns, and weather. These adjustments are strongest in Q1, where Christmas, New Year, and variable weather introduce the most noise. The UK has a recent pattern of relatively strong Q1 readings that subsequently soften, a pattern some analysts attribute to seasonal adjustment artefacts rather than genuine acceleration.
- What the monthly profile reveals. Within Q1 2026, the monthly trajectory ran: December +0.1%, January +0.1%, February +0.5%. Two-thirds of the period barely grew. The quarterly figure reflects one exceptional month doing disproportionate lifting.
The practical challenge of interpreting GDP data releases is compounded by the lag between when economic activity occurs and when it is measured, revised, and published; advance estimates carry average absolute revisions of approximately 0.6 percentage points, meaning a quarter’s headline number can look materially different twelve months later.
The ONS first quarterly estimate for Q1 2026 publishes the chain-linked, seasonally adjusted composite drawn from output, expenditure, and income approaches, alongside the monthly profile that shows December, January, and February contributions separately, giving analysts the granular data needed to distinguish genuine acceleration from single-month concentration.
What the monthly breakdown reveals
The three-month versus three-months-earlier comparison of +0.5% confirms a more measured pace than the headline suggests. March data, when the full ONS monthly bulletin becomes available, will refine the picture further. For now, the concentration of growth in a single month is a meaningful qualification on any interpretation of Q1 as a broad, sustained acceleration.
How services, production, and construction each contributed
The February 2026 monthly breakdown showed growth across all three major sectors: services at +0.5%, production at +0.5%, and construction at +1.0%. That breadth is real. It is also misleading if read in isolation.
Where growth was genuine
Services resumed growth after posting a flat 0.0% q/q in Q4 2025, contributing materially to the quarterly figure. Production carried momentum from Q4 2025, when it expanded by +1.2% q/q driven by manufacturing (+4.0%) and machinery and equipment (+3.6%). The three-month production comparison to a year earlier showed +1.2% growth, the strongest sectoral reading on a year-on-year basis.
| Sector | Q4 2025 (q/q) | February 2026 (m/m) |
|---|---|---|
| Services | 0.0% | +0.5% |
| Production | +1.2% | +0.5% |
| Construction | -2.0% | +1.0% |
Where the bounce is more tentative
Construction posted a +1.0% monthly gain in February, but the sector remains -1.8% on a 12-month comparison. A monthly bounce after a -2.0% q/q drag in Q4 is not the same as a sector in recovery. The employment activities subsector tells a similar story: a -6.6% fall in January 2026 followed by a +2.5% rebound in February 2026, but the ONS explicitly describes this industry as being on a “downward trend over the last two years.”
The Q4 demand deferral effect: households and business investment
There is a credible hypothesis that Q4 2025 weakness and Q1 2026 strength are a single two-part event rather than two distinct economic episodes.
The mechanism is straightforward. The late November 2025 budget created policy uncertainty across tax, spending, and regulation. Households and businesses may have deferred spending decisions until that uncertainty cleared, then released pent-up demand into Q1. The data is consistent with this reading.
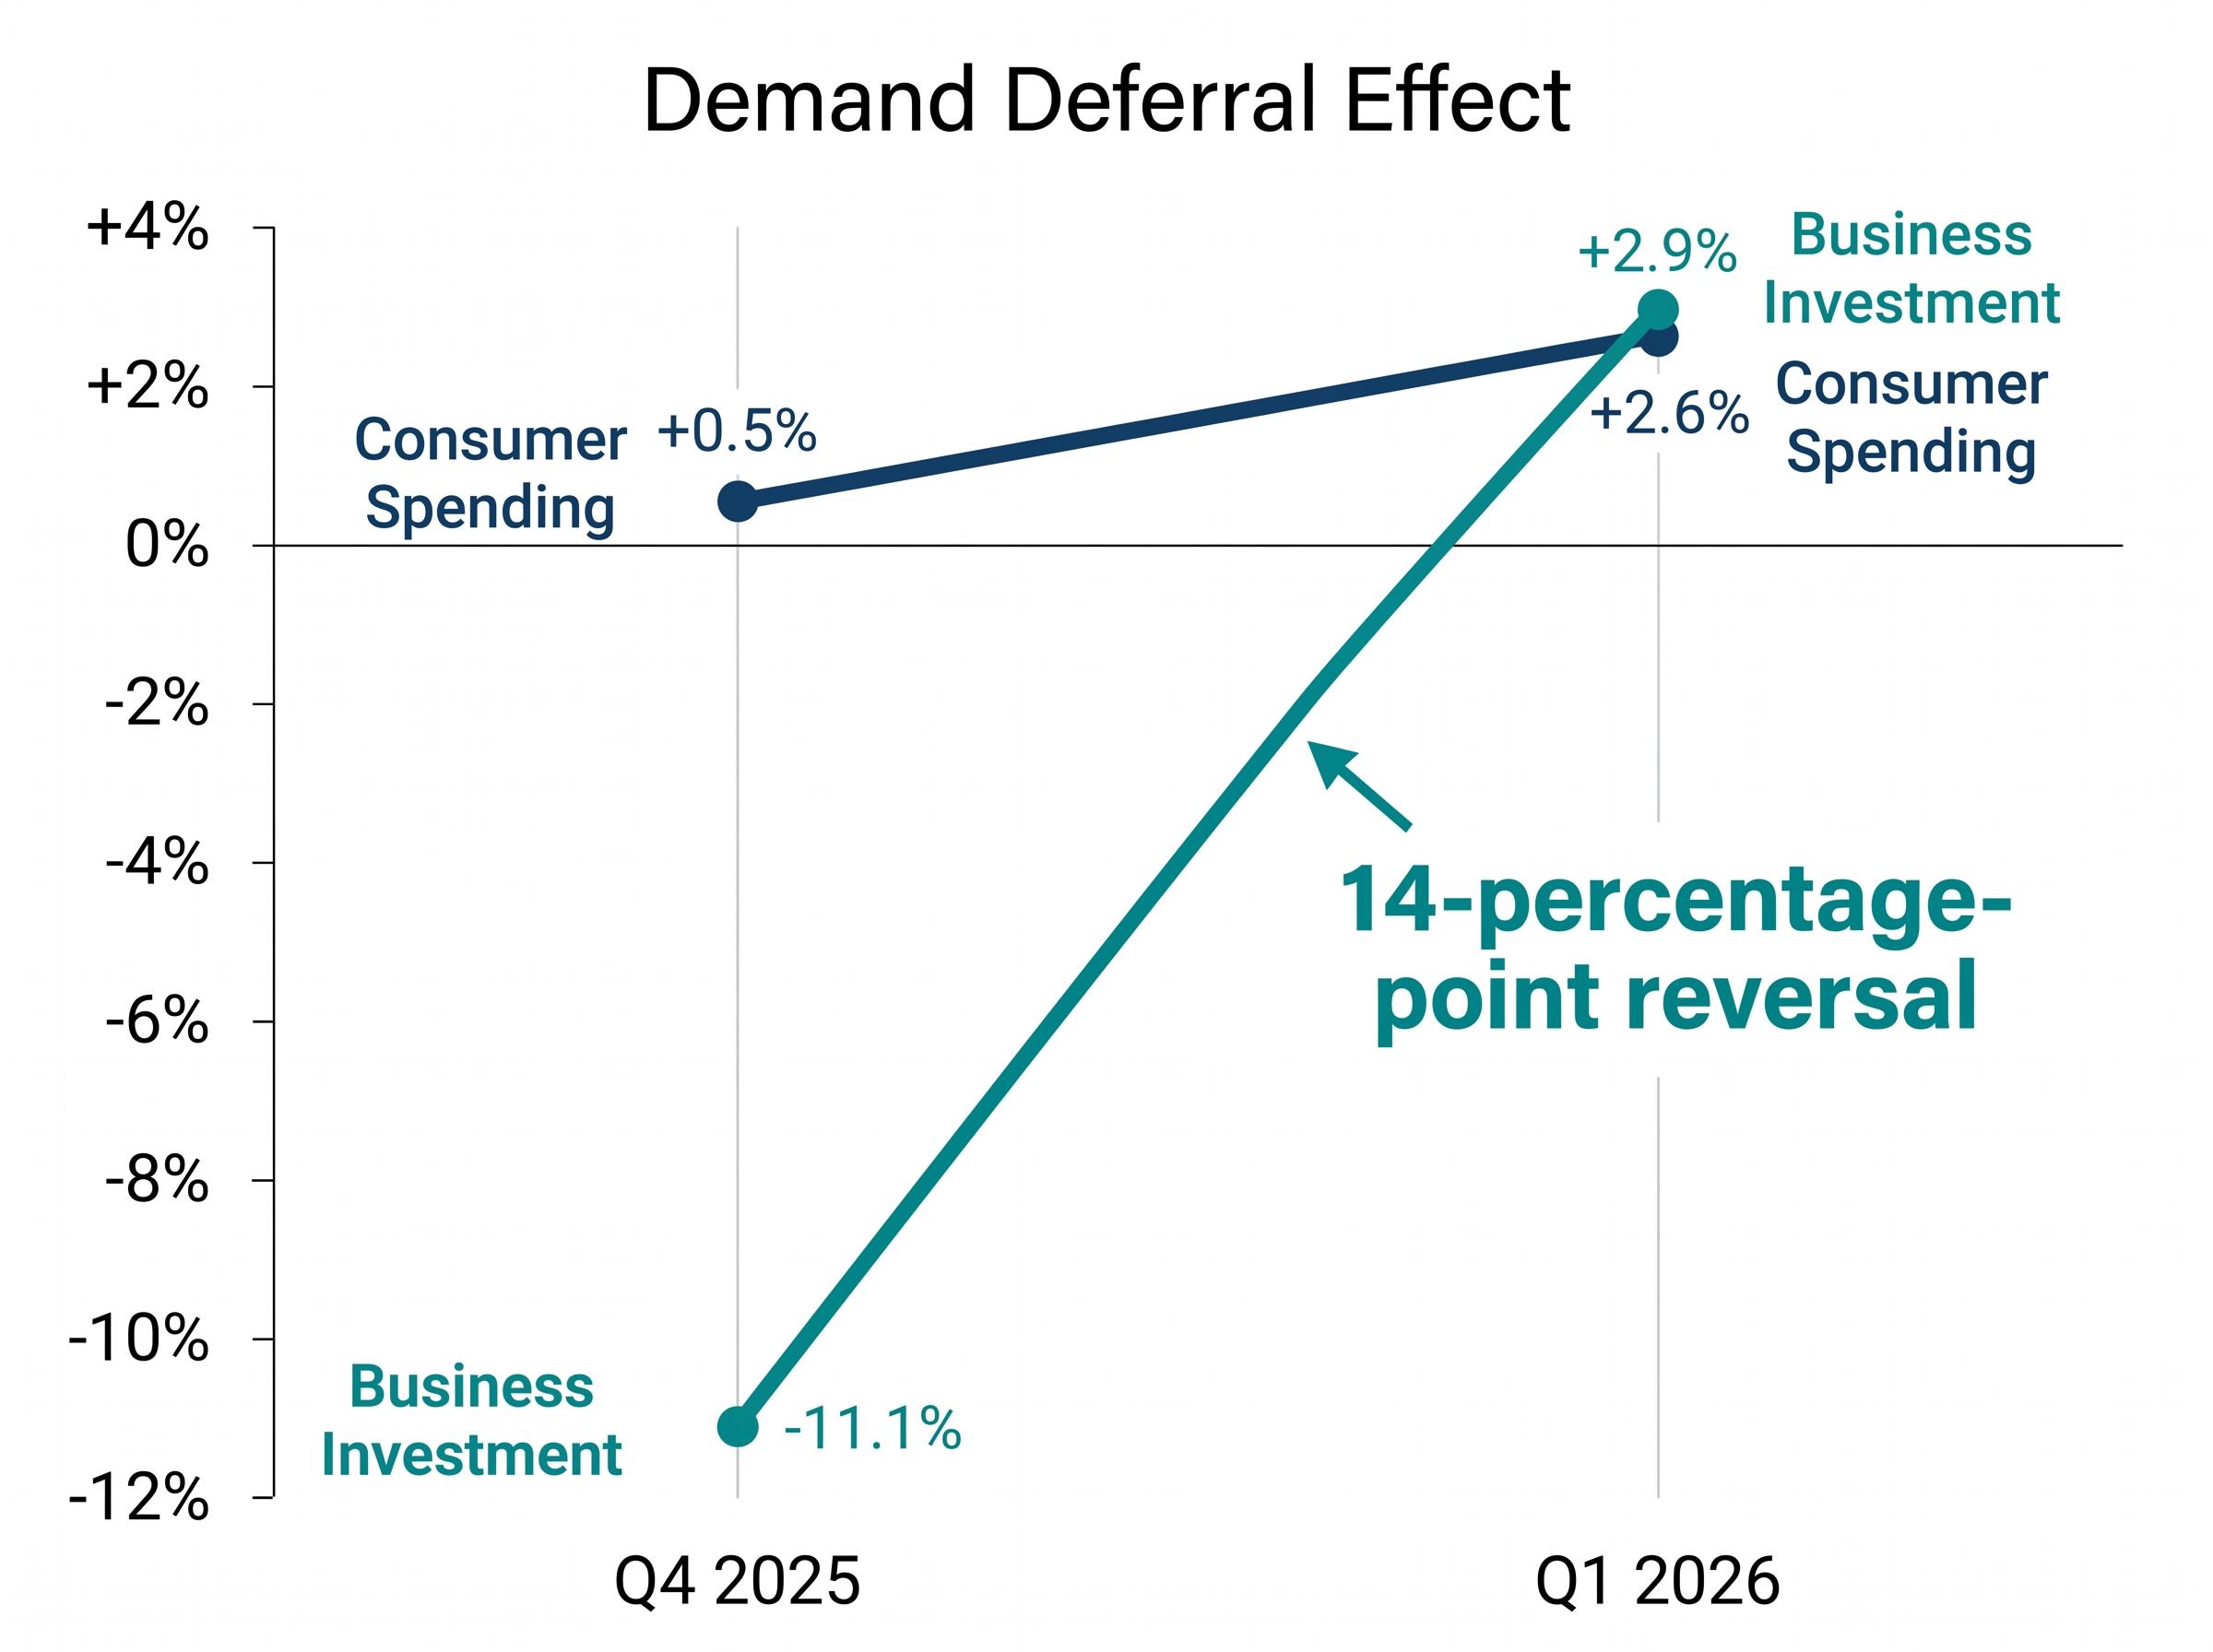
Business investment swung from -11.1% annualised in Q4 2025 to +2.9% annualised in Q1 2026, a 14-percentage-point reversal in a single quarter, according to FactSet data published on 14 May 2026.
Household consumption followed the same pattern, rising from +0.5% annualised in Q4 2025 to +2.6% annualised in Q1 2026. Both consumer and corporate channels moved in the same direction at the same time, consistent with a common cause rather than coincidence.
The pattern is not unique to the UK. US GDP in the same period showed import surging as businesses stockpiled ahead of tariff-related supply chain disruption, a reminder that one-quarter distortions from known policy events are a recurring feature of macro data, not an anomaly.
- Consumer spending: from +0.5% to +2.6% annualised (Q4 to Q1)
- Business investment: from -11.1% to +2.9% annualised (Q4 to Q1)
- Manufacturing and stockpiling: production strength carried over from Q4 into Q1
If Q1’s strength is meaningfully attributable to demand deferral unwinding, the 2.5% annualised pace should not be extrapolated into subsequent quarters. The more relevant question is whether underlying momentum, once normalised, is running at something closer to the IMF’s 0.8% full-year forecast.
What forecasters and markets are signalling about the UK’s growth path
The Q1 2026 annualised pace of 2.5% sits far above where professional forecasters expect the UK to land for the full year. The IMF’s 2026 UK growth forecast stands at 0.8%, according to the IMF World Economic Outlook.
The IMF projects UK GDP growth of 0.8% for full-year 2026, implying that subsequent quarters must run meaningfully below the Q1 pace to land near that forecast.
Global growth divergence is the backdrop against which the UK’s 0.6% print should be evaluated: a US soft landing, broad Asian expansion, and a contracting Eurozone are pulling in different directions simultaneously, with the Eurozone Services PMI at 47.4 and the ECB carrying around 90% market-implied probability of a rate cut in June 2026.
Trading Economics model projections point to approximately 0.3% q/q for Q2 2026 and roughly 0.4% q/q for 2027. Both imply a step-down from Q1, which represents the forecast community’s implicit view that the quarter contains a transitory element.
| Metric | Value |
|---|---|
| Q1 2026 annualised pace | ~2.5% |
| IMF 2026 full-year forecast | 0.8% |
| Trading Economics Q2 2026 projection | ~0.3% q/q |
| Long-term average (1955-2025) | 0.58% q/q |
Pre-release prediction markets had placed 37.5% odds on even a 0-0.3% Q1 print, meaning the final 0.6% was a genuine surprise relative to professional positioning. That kind of upside miss typically drives an initial sterling and gilt reaction.
Gilt market moves on this particular day require cautious interpretation. Two-year yields, the maturity most sensitive to Bank of England rate expectations, are responding to the GDP beat and simultaneous political uncertainty around the Labour leadership. Clean attribution of yield moves to GDP alone is analytically hazardous. For context, UK debt servicing costs ran at 8.7% of tax revenues over the 12 months to April 2026 (ONS), though the average maturity of UK government debt at 13.64 years (Debt Management Office) limits the sensitivity of actual financing costs to short-term yield movements.
The next major ASX story will hit our subscribers first
What this data genuinely changes for UK-exposed investors
What Q1 confirms, and what it does not
The distinction matters more than the headline.
- What Q1 2026 confirms: The UK avoided contraction. The recovery is at least partly broad-based across services and production. Household consumption and business investment both moved higher. The floor under the economy is higher than feared.
- What Q1 2026 does not yet confirm: That 2026 will run at a 2.5% annualised pace. That structural productivity constraints have shifted. That construction is in recovery rather than bouncing off a bad quarter. That the demand deferral effect has fully washed through.
The Bank of England policy angle
A 0.6% q/q print that beats consensus is incrementally hawkish for rate expectations: less urgency to cut. Based on historical communication patterns, the Bank of England is likely to characterise Q1 as encouraging but not decisive, particularly given the demand deferral hypothesis and the softness in year-on-year growth. A cautious easing bias is likely to remain intact.
The investor positioning angle
Q2 2026 monthly GDP data, when released by the ONS, becomes the principal test. If Q2 shows a meaningful deceleration toward the 0.3% q/q Trading Economics projection, the catch-up interpretation is confirmed. If growth holds above 0.4-0.5%, the genuine momentum case strengthens.
Chancellor Reeves cited the growth figures as evidence that policy is working. The gilt market is simultaneously processing Labour leadership uncertainty, making clean GDP signal extraction difficult on this specific date. Investors should be cautious about attributing any single move in yields or sterling solely to the growth print.
This article is for informational purposes only and should not be considered financial advice. Investors should conduct their own research and consult with financial professionals before making investment decisions.
One strong quarter is a signal, not a verdict
The breadth across services and production is real and encouraging. The 14-percentage-point swing in business investment is striking. But the year-on-year rate of approximately 0.8%, the concentration of growth in a single month, and the demand deferral hypothesis all argue against treating Q1 as the start of a sustained expansion phase.
The specific forward test that will resolve the ambiguity is Q2 2026 GDP, and within it the monthly progression of consumer spending and business investment. If both hold above trend, the bull case gains traction. If they revert sharply, Q1 is confirmed as a catch-up quarter.
The UK economy is in better shape than it was a year ago. Structural constraints remain. Today’s number is best understood as evidence that the floor is higher than feared, not that the ceiling has been raised.
For investors wanting to stress-test the UK growth outlook against a deteriorating external backdrop, our deep-dive into global recession risk and the June 2026 threshold examines BCA Research’s seven-factor buffer framework, the transmission lag from the Strait of Hormuz disruption into national GDP figures, and the specific data points that would shift institutional positioning from neutral to defensive.
Q1 2026 delivered a 2.5% annualised pace. The IMF expects 0.8% for the full year. The gap between those two numbers is where the real story lives.